Free Statistics

of Irreproducible Research!

Author's title

Author*The author of this computation has been verified*
R Software Modulerwasp_autocorrelation.wasp
Title produced by software(Partial) Autocorrelation Function
Date of computationWed, 14 Dec 2016 13:52:30 +0100
Cite this page as followsStatistical Computations at FreeStatistics.org, Office for Research Development and Education, URL https://freestatistics.org/blog/index.php?v=date/2016/Dec/14/t1481719986xbnved1rkyztp1r.htm/, Retrieved Sat, 04 May 2024 02:41:03 +0000
Statistical Computations at FreeStatistics.org, Office for Research Development and Education, URL https://freestatistics.org/blog/index.php?pk=299379, Retrieved Sat, 04 May 2024 02:41:03 +0000
QR Codes:

Original text written by user:
IsPrivate?No (this computation is public)
User-defined keywords
Estimated Impact72
Family? (F = Feedback message, R = changed R code, M = changed R Module, P = changed Parameters, D = changed Data)
-       [(Partial) Autocorrelation Function] [Partial] [2016-12-14 12:52:30] [d42b2dfaed369a60e2334709a5cede2f] [Current]
Feedback Forum

Post a new message
Dataseries X:
1800
2000
2200
2250
2400
2350
2350
2250
2250
2200
2150
2150
1900
2050
2100
2100
1900
1950
1900
1950
2000
2050
1900
2050
1750
1950
2250
2150
2250
2500
2250
2300
2550
2550
2600
2900
2400
2750
3300
3200
3150
3200
3200
3250
3600
3550
3600
3600
3300
3650
4200
3900
3950
4200
4300
4350
4650
4650
4450
4750
4300
4600
5350
4750
4900
4700
4500
4700
4700
4350
4400
4450
4050
4700
5050
4750
4800
4900
5000
5050
5400
5400
5350
5600
5200
6000
6650
6050
6050
6400
6400
6100
7050
6450
6250
6600
6000
6600
7400
6650
6250
6650
NA
NA
NA
NA
NA
NA
NA
NA
NA
NA
NA
NA
NA
NA
NA
NA
NA
NA
NA
NA
NA
NA
NA
NA
NA
NA
NA
NA
NA
NA
NA
NA
NA
NA
NA
NA
NA
NA
NA
NA
NA
NA


Summary of computational transaction
Raw Input view raw input (R code)
Raw Outputview raw output of R engine
Computing time1 seconds
R ServerBig Analytics Cloud Computing Center

\begin{tabular}{lllllllll}
\hline
Summary of computational transaction \tabularnewline
Raw Input view raw input (R code)  \tabularnewline
Raw Outputview raw output of R engine  \tabularnewline
Computing time1 seconds \tabularnewline
R ServerBig Analytics Cloud Computing Center \tabularnewline
\hline
\end{tabular}
%Source: https://freestatistics.org/blog/index.php?pk=299379&T=0

[TABLE]
[ROW]
Summary of computational transaction[/C][/ROW] [ROW]Raw Input[/C] view raw input (R code) [/C][/ROW] [ROW]Raw Output[/C]view raw output of R engine [/C][/ROW] [ROW]Computing time[/C]1 seconds[/C][/ROW] [ROW]R Server[/C]Big Analytics Cloud Computing Center[/C][/ROW] [/TABLE] Source: https://freestatistics.org/blog/index.php?pk=299379&T=0

Globally Unique Identifier (entire table): ba.freestatistics.org/blog/index.php?pk=299379&T=0

As an alternative you can also use a QR Code:  

The GUIDs for individual cells are displayed in the table below:

Summary of computational transaction
Raw Input view raw input (R code)
Raw Outputview raw output of R engine
Computing time1 seconds
R ServerBig Analytics Cloud Computing Center


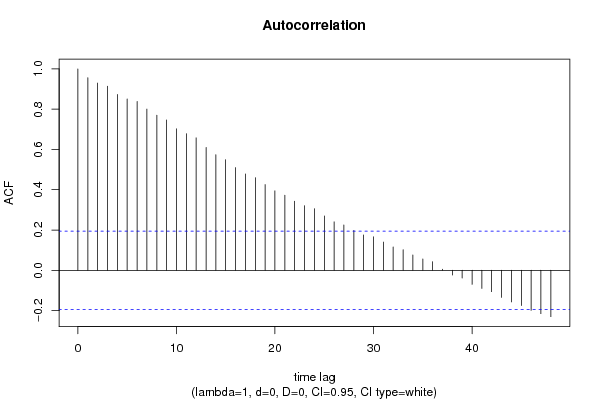
Autocorrelation Function
Time lag kACF(k)T-STATP-value
10.9563779.65890
20.9296369.38890
30.9137549.22850
40.8734618.82150
50.8511478.59620
60.8379618.4630
70.8004428.08410
80.7698597.77520
90.7463997.53830
100.7025647.09550
110.678566.85310
120.6576616.6420
130.6100786.16150
140.5735085.79210
150.5490875.54550
160.5097435.14811e-06
170.478494.83252e-06
180.4596354.64215e-06
190.4253644.2962e-05
200.3945753.9856.3e-05
210.3726653.76370.00014
220.3425463.45950.000396
230.320493.23680.000815
240.3056533.08690.001302
250.2698082.72490.003785
260.2404542.42850.008457
270.2250342.27270.01257
280.1972731.99240.024502
290.1749741.76720.040097
300.1659961.67650.048353
310.1398251.41220.080472
320.1155851.16740.122895
330.1022421.03260.152119
340.075470.76220.223847
350.0558790.56430.286878
360.0424590.42880.334482
370.0053530.05410.478494
38-0.023475-0.23710.406534
39-0.038824-0.39210.347899
40-0.06994-0.70640.240786
41-0.090055-0.90950.182613
42-0.106046-1.0710.143346
43-0.134873-1.36220.088075
44-0.157113-1.58680.057831
45-0.175023-1.76770.040055
46-0.199115-2.0110.023484
47-0.21562-2.17770.015868
48-0.230407-2.3270.010971

\begin{tabular}{lllllllll}
\hline
Autocorrelation Function \tabularnewline
Time lag k & ACF(k) & T-STAT & P-value \tabularnewline
1 & 0.956377 & 9.6589 & 0 \tabularnewline
2 & 0.929636 & 9.3889 & 0 \tabularnewline
3 & 0.913754 & 9.2285 & 0 \tabularnewline
4 & 0.873461 & 8.8215 & 0 \tabularnewline
5 & 0.851147 & 8.5962 & 0 \tabularnewline
6 & 0.837961 & 8.463 & 0 \tabularnewline
7 & 0.800442 & 8.0841 & 0 \tabularnewline
8 & 0.769859 & 7.7752 & 0 \tabularnewline
9 & 0.746399 & 7.5383 & 0 \tabularnewline
10 & 0.702564 & 7.0955 & 0 \tabularnewline
11 & 0.67856 & 6.8531 & 0 \tabularnewline
12 & 0.657661 & 6.642 & 0 \tabularnewline
13 & 0.610078 & 6.1615 & 0 \tabularnewline
14 & 0.573508 & 5.7921 & 0 \tabularnewline
15 & 0.549087 & 5.5455 & 0 \tabularnewline
16 & 0.509743 & 5.1481 & 1e-06 \tabularnewline
17 & 0.47849 & 4.8325 & 2e-06 \tabularnewline
18 & 0.459635 & 4.6421 & 5e-06 \tabularnewline
19 & 0.425364 & 4.296 & 2e-05 \tabularnewline
20 & 0.394575 & 3.985 & 6.3e-05 \tabularnewline
21 & 0.372665 & 3.7637 & 0.00014 \tabularnewline
22 & 0.342546 & 3.4595 & 0.000396 \tabularnewline
23 & 0.32049 & 3.2368 & 0.000815 \tabularnewline
24 & 0.305653 & 3.0869 & 0.001302 \tabularnewline
25 & 0.269808 & 2.7249 & 0.003785 \tabularnewline
26 & 0.240454 & 2.4285 & 0.008457 \tabularnewline
27 & 0.225034 & 2.2727 & 0.01257 \tabularnewline
28 & 0.197273 & 1.9924 & 0.024502 \tabularnewline
29 & 0.174974 & 1.7672 & 0.040097 \tabularnewline
30 & 0.165996 & 1.6765 & 0.048353 \tabularnewline
31 & 0.139825 & 1.4122 & 0.080472 \tabularnewline
32 & 0.115585 & 1.1674 & 0.122895 \tabularnewline
33 & 0.102242 & 1.0326 & 0.152119 \tabularnewline
34 & 0.07547 & 0.7622 & 0.223847 \tabularnewline
35 & 0.055879 & 0.5643 & 0.286878 \tabularnewline
36 & 0.042459 & 0.4288 & 0.334482 \tabularnewline
37 & 0.005353 & 0.0541 & 0.478494 \tabularnewline
38 & -0.023475 & -0.2371 & 0.406534 \tabularnewline
39 & -0.038824 & -0.3921 & 0.347899 \tabularnewline
40 & -0.06994 & -0.7064 & 0.240786 \tabularnewline
41 & -0.090055 & -0.9095 & 0.182613 \tabularnewline
42 & -0.106046 & -1.071 & 0.143346 \tabularnewline
43 & -0.134873 & -1.3622 & 0.088075 \tabularnewline
44 & -0.157113 & -1.5868 & 0.057831 \tabularnewline
45 & -0.175023 & -1.7677 & 0.040055 \tabularnewline
46 & -0.199115 & -2.011 & 0.023484 \tabularnewline
47 & -0.21562 & -2.1777 & 0.015868 \tabularnewline
48 & -0.230407 & -2.327 & 0.010971 \tabularnewline
\hline
\end{tabular}
%Source: https://freestatistics.org/blog/index.php?pk=299379&T=1

[TABLE]
[ROW][C]Autocorrelation Function[/C][/ROW]
[ROW][C]Time lag k[/C][C]ACF(k)[/C][C]T-STAT[/C][C]P-value[/C][/ROW]
[ROW][C]1[/C][C]0.956377[/C][C]9.6589[/C][C]0[/C][/ROW]
[ROW][C]2[/C][C]0.929636[/C][C]9.3889[/C][C]0[/C][/ROW]
[ROW][C]3[/C][C]0.913754[/C][C]9.2285[/C][C]0[/C][/ROW]
[ROW][C]4[/C][C]0.873461[/C][C]8.8215[/C][C]0[/C][/ROW]
[ROW][C]5[/C][C]0.851147[/C][C]8.5962[/C][C]0[/C][/ROW]
[ROW][C]6[/C][C]0.837961[/C][C]8.463[/C][C]0[/C][/ROW]
[ROW][C]7[/C][C]0.800442[/C][C]8.0841[/C][C]0[/C][/ROW]
[ROW][C]8[/C][C]0.769859[/C][C]7.7752[/C][C]0[/C][/ROW]
[ROW][C]9[/C][C]0.746399[/C][C]7.5383[/C][C]0[/C][/ROW]
[ROW][C]10[/C][C]0.702564[/C][C]7.0955[/C][C]0[/C][/ROW]
[ROW][C]11[/C][C]0.67856[/C][C]6.8531[/C][C]0[/C][/ROW]
[ROW][C]12[/C][C]0.657661[/C][C]6.642[/C][C]0[/C][/ROW]
[ROW][C]13[/C][C]0.610078[/C][C]6.1615[/C][C]0[/C][/ROW]
[ROW][C]14[/C][C]0.573508[/C][C]5.7921[/C][C]0[/C][/ROW]
[ROW][C]15[/C][C]0.549087[/C][C]5.5455[/C][C]0[/C][/ROW]
[ROW][C]16[/C][C]0.509743[/C][C]5.1481[/C][C]1e-06[/C][/ROW]
[ROW][C]17[/C][C]0.47849[/C][C]4.8325[/C][C]2e-06[/C][/ROW]
[ROW][C]18[/C][C]0.459635[/C][C]4.6421[/C][C]5e-06[/C][/ROW]
[ROW][C]19[/C][C]0.425364[/C][C]4.296[/C][C]2e-05[/C][/ROW]
[ROW][C]20[/C][C]0.394575[/C][C]3.985[/C][C]6.3e-05[/C][/ROW]
[ROW][C]21[/C][C]0.372665[/C][C]3.7637[/C][C]0.00014[/C][/ROW]
[ROW][C]22[/C][C]0.342546[/C][C]3.4595[/C][C]0.000396[/C][/ROW]
[ROW][C]23[/C][C]0.32049[/C][C]3.2368[/C][C]0.000815[/C][/ROW]
[ROW][C]24[/C][C]0.305653[/C][C]3.0869[/C][C]0.001302[/C][/ROW]
[ROW][C]25[/C][C]0.269808[/C][C]2.7249[/C][C]0.003785[/C][/ROW]
[ROW][C]26[/C][C]0.240454[/C][C]2.4285[/C][C]0.008457[/C][/ROW]
[ROW][C]27[/C][C]0.225034[/C][C]2.2727[/C][C]0.01257[/C][/ROW]
[ROW][C]28[/C][C]0.197273[/C][C]1.9924[/C][C]0.024502[/C][/ROW]
[ROW][C]29[/C][C]0.174974[/C][C]1.7672[/C][C]0.040097[/C][/ROW]
[ROW][C]30[/C][C]0.165996[/C][C]1.6765[/C][C]0.048353[/C][/ROW]
[ROW][C]31[/C][C]0.139825[/C][C]1.4122[/C][C]0.080472[/C][/ROW]
[ROW][C]32[/C][C]0.115585[/C][C]1.1674[/C][C]0.122895[/C][/ROW]
[ROW][C]33[/C][C]0.102242[/C][C]1.0326[/C][C]0.152119[/C][/ROW]
[ROW][C]34[/C][C]0.07547[/C][C]0.7622[/C][C]0.223847[/C][/ROW]
[ROW][C]35[/C][C]0.055879[/C][C]0.5643[/C][C]0.286878[/C][/ROW]
[ROW][C]36[/C][C]0.042459[/C][C]0.4288[/C][C]0.334482[/C][/ROW]
[ROW][C]37[/C][C]0.005353[/C][C]0.0541[/C][C]0.478494[/C][/ROW]
[ROW][C]38[/C][C]-0.023475[/C][C]-0.2371[/C][C]0.406534[/C][/ROW]
[ROW][C]39[/C][C]-0.038824[/C][C]-0.3921[/C][C]0.347899[/C][/ROW]
[ROW][C]40[/C][C]-0.06994[/C][C]-0.7064[/C][C]0.240786[/C][/ROW]
[ROW][C]41[/C][C]-0.090055[/C][C]-0.9095[/C][C]0.182613[/C][/ROW]
[ROW][C]42[/C][C]-0.106046[/C][C]-1.071[/C][C]0.143346[/C][/ROW]
[ROW][C]43[/C][C]-0.134873[/C][C]-1.3622[/C][C]0.088075[/C][/ROW]
[ROW][C]44[/C][C]-0.157113[/C][C]-1.5868[/C][C]0.057831[/C][/ROW]
[ROW][C]45[/C][C]-0.175023[/C][C]-1.7677[/C][C]0.040055[/C][/ROW]
[ROW][C]46[/C][C]-0.199115[/C][C]-2.011[/C][C]0.023484[/C][/ROW]
[ROW][C]47[/C][C]-0.21562[/C][C]-2.1777[/C][C]0.015868[/C][/ROW]
[ROW][C]48[/C][C]-0.230407[/C][C]-2.327[/C][C]0.010971[/C][/ROW]
[/TABLE]
Source: https://freestatistics.org/blog/index.php?pk=299379&T=1

Globally Unique Identifier (entire table): ba.freestatistics.org/blog/index.php?pk=299379&T=1

As an alternative you can also use a QR Code:  

The GUIDs for individual cells are displayed in the table below:

Autocorrelation Function
Time lag kACF(k)T-STATP-value
10.9563779.65890
20.9296369.38890
30.9137549.22850
40.8734618.82150
50.8511478.59620
60.8379618.4630
70.8004428.08410
80.7698597.77520
90.7463997.53830
100.7025647.09550
110.678566.85310
120.6576616.6420
130.6100786.16150
140.5735085.79210
150.5490875.54550
160.5097435.14811e-06
170.478494.83252e-06
180.4596354.64215e-06
190.4253644.2962e-05
200.3945753.9856.3e-05
210.3726653.76370.00014
220.3425463.45950.000396
230.320493.23680.000815
240.3056533.08690.001302
250.2698082.72490.003785
260.2404542.42850.008457
270.2250342.27270.01257
280.1972731.99240.024502
290.1749741.76720.040097
300.1659961.67650.048353
310.1398251.41220.080472
320.1155851.16740.122895
330.1022421.03260.152119
340.075470.76220.223847
350.0558790.56430.286878
360.0424590.42880.334482
370.0053530.05410.478494
38-0.023475-0.23710.406534
39-0.038824-0.39210.347899
40-0.06994-0.70640.240786
41-0.090055-0.90950.182613
42-0.106046-1.0710.143346
43-0.134873-1.36220.088075
44-0.157113-1.58680.057831
45-0.175023-1.76770.040055
46-0.199115-2.0110.023484
47-0.21562-2.17770.015868
48-0.230407-2.3270.010971


Partial Autocorrelation Function
Time lag kPACF(k)T-STATP-value
10.9563779.65890
20.1755231.77270.039632
30.1554791.57030.059726
4-0.247855-2.50320.006947
50.1234141.24640.107733
60.1038321.04870.148407
7-0.180177-1.81970.035869
8-0.073912-0.74650.22855
90.0187430.18930.425117
10-0.125119-1.26360.10462
110.1253641.26610.104178
12-0.009811-0.09910.460633
13-0.211547-2.13650.017514
14-0.072781-0.73510.231997
150.1369731.38340.084788
160.025670.25920.397983
17-0.085925-0.86780.19377
180.0427290.43150.333493
190.0210080.21220.416197
20-0.043135-0.43560.332007
210.0129250.13050.4482
220.0400050.4040.343519
23-0.004885-0.04930.480374
240.0004960.0050.498005
25-0.129998-1.31290.096078
26-0.02792-0.2820.389266
270.0663620.67020.252116
280.0261570.26420.396088
29-0.043582-0.44020.330379
300.0128340.12960.448562
31-0.051619-0.52130.301636
320.0050110.05060.479869
330.0089770.09070.463969
34-0.066973-0.67640.250159
35-0.03002-0.30320.381181
36-0.019963-0.20160.420311
37-0.150981-1.52480.065197
38-0.02626-0.26520.395691
390.0507710.51280.304613
40-0.015709-0.15870.437128
410.007740.07820.468922
42-0.107257-1.08320.140628
430.0300710.30370.380987
440.0462890.46750.320571
45-0.03322-0.33550.368967
46-0.00869-0.08780.46512
47-0.027223-0.27490.39196
48-0.020623-0.20830.417712

\begin{tabular}{lllllllll}
\hline
Partial Autocorrelation Function \tabularnewline
Time lag k & PACF(k) & T-STAT & P-value \tabularnewline
1 & 0.956377 & 9.6589 & 0 \tabularnewline
2 & 0.175523 & 1.7727 & 0.039632 \tabularnewline
3 & 0.155479 & 1.5703 & 0.059726 \tabularnewline
4 & -0.247855 & -2.5032 & 0.006947 \tabularnewline
5 & 0.123414 & 1.2464 & 0.107733 \tabularnewline
6 & 0.103832 & 1.0487 & 0.148407 \tabularnewline
7 & -0.180177 & -1.8197 & 0.035869 \tabularnewline
8 & -0.073912 & -0.7465 & 0.22855 \tabularnewline
9 & 0.018743 & 0.1893 & 0.425117 \tabularnewline
10 & -0.125119 & -1.2636 & 0.10462 \tabularnewline
11 & 0.125364 & 1.2661 & 0.104178 \tabularnewline
12 & -0.009811 & -0.0991 & 0.460633 \tabularnewline
13 & -0.211547 & -2.1365 & 0.017514 \tabularnewline
14 & -0.072781 & -0.7351 & 0.231997 \tabularnewline
15 & 0.136973 & 1.3834 & 0.084788 \tabularnewline
16 & 0.02567 & 0.2592 & 0.397983 \tabularnewline
17 & -0.085925 & -0.8678 & 0.19377 \tabularnewline
18 & 0.042729 & 0.4315 & 0.333493 \tabularnewline
19 & 0.021008 & 0.2122 & 0.416197 \tabularnewline
20 & -0.043135 & -0.4356 & 0.332007 \tabularnewline
21 & 0.012925 & 0.1305 & 0.4482 \tabularnewline
22 & 0.040005 & 0.404 & 0.343519 \tabularnewline
23 & -0.004885 & -0.0493 & 0.480374 \tabularnewline
24 & 0.000496 & 0.005 & 0.498005 \tabularnewline
25 & -0.129998 & -1.3129 & 0.096078 \tabularnewline
26 & -0.02792 & -0.282 & 0.389266 \tabularnewline
27 & 0.066362 & 0.6702 & 0.252116 \tabularnewline
28 & 0.026157 & 0.2642 & 0.396088 \tabularnewline
29 & -0.043582 & -0.4402 & 0.330379 \tabularnewline
30 & 0.012834 & 0.1296 & 0.448562 \tabularnewline
31 & -0.051619 & -0.5213 & 0.301636 \tabularnewline
32 & 0.005011 & 0.0506 & 0.479869 \tabularnewline
33 & 0.008977 & 0.0907 & 0.463969 \tabularnewline
34 & -0.066973 & -0.6764 & 0.250159 \tabularnewline
35 & -0.03002 & -0.3032 & 0.381181 \tabularnewline
36 & -0.019963 & -0.2016 & 0.420311 \tabularnewline
37 & -0.150981 & -1.5248 & 0.065197 \tabularnewline
38 & -0.02626 & -0.2652 & 0.395691 \tabularnewline
39 & 0.050771 & 0.5128 & 0.304613 \tabularnewline
40 & -0.015709 & -0.1587 & 0.437128 \tabularnewline
41 & 0.00774 & 0.0782 & 0.468922 \tabularnewline
42 & -0.107257 & -1.0832 & 0.140628 \tabularnewline
43 & 0.030071 & 0.3037 & 0.380987 \tabularnewline
44 & 0.046289 & 0.4675 & 0.320571 \tabularnewline
45 & -0.03322 & -0.3355 & 0.368967 \tabularnewline
46 & -0.00869 & -0.0878 & 0.46512 \tabularnewline
47 & -0.027223 & -0.2749 & 0.39196 \tabularnewline
48 & -0.020623 & -0.2083 & 0.417712 \tabularnewline
\hline
\end{tabular}
%Source: https://freestatistics.org/blog/index.php?pk=299379&T=2

[TABLE]
[ROW][C]Partial Autocorrelation Function[/C][/ROW]
[ROW][C]Time lag k[/C][C]PACF(k)[/C][C]T-STAT[/C][C]P-value[/C][/ROW]
[ROW][C]1[/C][C]0.956377[/C][C]9.6589[/C][C]0[/C][/ROW]
[ROW][C]2[/C][C]0.175523[/C][C]1.7727[/C][C]0.039632[/C][/ROW]
[ROW][C]3[/C][C]0.155479[/C][C]1.5703[/C][C]0.059726[/C][/ROW]
[ROW][C]4[/C][C]-0.247855[/C][C]-2.5032[/C][C]0.006947[/C][/ROW]
[ROW][C]5[/C][C]0.123414[/C][C]1.2464[/C][C]0.107733[/C][/ROW]
[ROW][C]6[/C][C]0.103832[/C][C]1.0487[/C][C]0.148407[/C][/ROW]
[ROW][C]7[/C][C]-0.180177[/C][C]-1.8197[/C][C]0.035869[/C][/ROW]
[ROW][C]8[/C][C]-0.073912[/C][C]-0.7465[/C][C]0.22855[/C][/ROW]
[ROW][C]9[/C][C]0.018743[/C][C]0.1893[/C][C]0.425117[/C][/ROW]
[ROW][C]10[/C][C]-0.125119[/C][C]-1.2636[/C][C]0.10462[/C][/ROW]
[ROW][C]11[/C][C]0.125364[/C][C]1.2661[/C][C]0.104178[/C][/ROW]
[ROW][C]12[/C][C]-0.009811[/C][C]-0.0991[/C][C]0.460633[/C][/ROW]
[ROW][C]13[/C][C]-0.211547[/C][C]-2.1365[/C][C]0.017514[/C][/ROW]
[ROW][C]14[/C][C]-0.072781[/C][C]-0.7351[/C][C]0.231997[/C][/ROW]
[ROW][C]15[/C][C]0.136973[/C][C]1.3834[/C][C]0.084788[/C][/ROW]
[ROW][C]16[/C][C]0.02567[/C][C]0.2592[/C][C]0.397983[/C][/ROW]
[ROW][C]17[/C][C]-0.085925[/C][C]-0.8678[/C][C]0.19377[/C][/ROW]
[ROW][C]18[/C][C]0.042729[/C][C]0.4315[/C][C]0.333493[/C][/ROW]
[ROW][C]19[/C][C]0.021008[/C][C]0.2122[/C][C]0.416197[/C][/ROW]
[ROW][C]20[/C][C]-0.043135[/C][C]-0.4356[/C][C]0.332007[/C][/ROW]
[ROW][C]21[/C][C]0.012925[/C][C]0.1305[/C][C]0.4482[/C][/ROW]
[ROW][C]22[/C][C]0.040005[/C][C]0.404[/C][C]0.343519[/C][/ROW]
[ROW][C]23[/C][C]-0.004885[/C][C]-0.0493[/C][C]0.480374[/C][/ROW]
[ROW][C]24[/C][C]0.000496[/C][C]0.005[/C][C]0.498005[/C][/ROW]
[ROW][C]25[/C][C]-0.129998[/C][C]-1.3129[/C][C]0.096078[/C][/ROW]
[ROW][C]26[/C][C]-0.02792[/C][C]-0.282[/C][C]0.389266[/C][/ROW]
[ROW][C]27[/C][C]0.066362[/C][C]0.6702[/C][C]0.252116[/C][/ROW]
[ROW][C]28[/C][C]0.026157[/C][C]0.2642[/C][C]0.396088[/C][/ROW]
[ROW][C]29[/C][C]-0.043582[/C][C]-0.4402[/C][C]0.330379[/C][/ROW]
[ROW][C]30[/C][C]0.012834[/C][C]0.1296[/C][C]0.448562[/C][/ROW]
[ROW][C]31[/C][C]-0.051619[/C][C]-0.5213[/C][C]0.301636[/C][/ROW]
[ROW][C]32[/C][C]0.005011[/C][C]0.0506[/C][C]0.479869[/C][/ROW]
[ROW][C]33[/C][C]0.008977[/C][C]0.0907[/C][C]0.463969[/C][/ROW]
[ROW][C]34[/C][C]-0.066973[/C][C]-0.6764[/C][C]0.250159[/C][/ROW]
[ROW][C]35[/C][C]-0.03002[/C][C]-0.3032[/C][C]0.381181[/C][/ROW]
[ROW][C]36[/C][C]-0.019963[/C][C]-0.2016[/C][C]0.420311[/C][/ROW]
[ROW][C]37[/C][C]-0.150981[/C][C]-1.5248[/C][C]0.065197[/C][/ROW]
[ROW][C]38[/C][C]-0.02626[/C][C]-0.2652[/C][C]0.395691[/C][/ROW]
[ROW][C]39[/C][C]0.050771[/C][C]0.5128[/C][C]0.304613[/C][/ROW]
[ROW][C]40[/C][C]-0.015709[/C][C]-0.1587[/C][C]0.437128[/C][/ROW]
[ROW][C]41[/C][C]0.00774[/C][C]0.0782[/C][C]0.468922[/C][/ROW]
[ROW][C]42[/C][C]-0.107257[/C][C]-1.0832[/C][C]0.140628[/C][/ROW]
[ROW][C]43[/C][C]0.030071[/C][C]0.3037[/C][C]0.380987[/C][/ROW]
[ROW][C]44[/C][C]0.046289[/C][C]0.4675[/C][C]0.320571[/C][/ROW]
[ROW][C]45[/C][C]-0.03322[/C][C]-0.3355[/C][C]0.368967[/C][/ROW]
[ROW][C]46[/C][C]-0.00869[/C][C]-0.0878[/C][C]0.46512[/C][/ROW]
[ROW][C]47[/C][C]-0.027223[/C][C]-0.2749[/C][C]0.39196[/C][/ROW]
[ROW][C]48[/C][C]-0.020623[/C][C]-0.2083[/C][C]0.417712[/C][/ROW]
[/TABLE]
Source: https://freestatistics.org/blog/index.php?pk=299379&T=2

Globally Unique Identifier (entire table): ba.freestatistics.org/blog/index.php?pk=299379&T=2

As an alternative you can also use a QR Code:  

The GUIDs for individual cells are displayed in the table below:

Partial Autocorrelation Function
Time lag kPACF(k)T-STATP-value
10.9563779.65890
20.1755231.77270.039632
30.1554791.57030.059726
4-0.247855-2.50320.006947
50.1234141.24640.107733
60.1038321.04870.148407
7-0.180177-1.81970.035869
8-0.073912-0.74650.22855
90.0187430.18930.425117
10-0.125119-1.26360.10462
110.1253641.26610.104178
12-0.009811-0.09910.460633
13-0.211547-2.13650.017514
14-0.072781-0.73510.231997
150.1369731.38340.084788
160.025670.25920.397983
17-0.085925-0.86780.19377
180.0427290.43150.333493
190.0210080.21220.416197
20-0.043135-0.43560.332007
210.0129250.13050.4482
220.0400050.4040.343519
23-0.004885-0.04930.480374
240.0004960.0050.498005
25-0.129998-1.31290.096078
26-0.02792-0.2820.389266
270.0663620.67020.252116
280.0261570.26420.396088
29-0.043582-0.44020.330379
300.0128340.12960.448562
31-0.051619-0.52130.301636
320.0050110.05060.479869
330.0089770.09070.463969
34-0.066973-0.67640.250159
35-0.03002-0.30320.381181
36-0.019963-0.20160.420311
37-0.150981-1.52480.065197
38-0.02626-0.26520.395691
390.0507710.51280.304613
40-0.015709-0.15870.437128
410.007740.07820.468922
42-0.107257-1.08320.140628
430.0300710.30370.380987
440.0462890.46750.320571
45-0.03322-0.33550.368967
46-0.00869-0.08780.46512
47-0.027223-0.27490.39196
48-0.020623-0.20830.417712


Parameters (Session):
par1 = 48 ; par2 = 1 ; par3 = 0 ; par4 = 0 ; par5 = 12 ; par6 = White Noise ; par7 = 0.95 ;
Parameters (R input):
par1 = 48 ; par2 = 1 ; par3 = 0 ; par4 = 0 ; par5 = 12 ; par6 = White Noise ; par7 = 0.95 ; par8 = ;
R code (references can be found in the software module):
if (par1 == 'Default') {
par1 = 10*log10(length(x))
} else {
par1 <- as.numeric(par1)
}
par2 <- as.numeric(par2)
par3 <- as.numeric(par3)
par4 <- as.numeric(par4)
par5 <- as.numeric(par5)
if (par6 == 'White Noise') par6 <- 'white' else par6 <- 'ma'
par7 <- as.numeric(par7)
if (par8 != '') par8 <- as.numeric(par8)
x <- na.omit(x)
ox <- x
if (par8 == '') {
if (par2 == 0) {
x <- log(x)
} else {
x <- (x ^ par2 - 1) / par2
}
} else {
x <- log(x,base=par8)
}
if (par3 > 0) x <- diff(x,lag=1,difference=par3)
if (par4 > 0) x <- diff(x,lag=par5,difference=par4)
bitmap(file='picts.png')
op <- par(mfrow=c(2,1))
plot(ox,type='l',main='Original Time Series',xlab='time',ylab='value')
if (par8=='') {
mytitle <- paste('Working Time Series (lambda=',par2,', d=',par3,', D=',par4,')',sep='')
mysub <- paste('(lambda=',par2,', d=',par3,', D=',par4,', CI=', par7, ', CI type=',par6,')',sep='')
} else {
mytitle <- paste('Working Time Series (base=',par8,', d=',par3,', D=',par4,')',sep='')
mysub <- paste('(base=',par8,', d=',par3,', D=',par4,', CI=', par7, ', CI type=',par6,')',sep='')
}
plot(x,type='l', main=mytitle,xlab='time',ylab='value')
par(op)
dev.off()
bitmap(file='pic1.png')
racf <- acf(x, par1, main='Autocorrelation', xlab='time lag', ylab='ACF', ci.type=par6, ci=par7, sub=mysub)
dev.off()
bitmap(file='pic2.png')
rpacf <- pacf(x,par1,main='Partial Autocorrelation',xlab='lags',ylab='PACF',sub=mysub)
dev.off()
(myacf <- c(racf$acf))
(mypacf <- c(rpacf$acf))
lengthx <- length(x)
sqrtn <- sqrt(lengthx)
load(file='createtable')
a<-table.start()
a<-table.row.start(a)
a<-table.element(a,'Autocorrelation Function',4,TRUE)
a<-table.row.end(a)
a<-table.row.start(a)
a<-table.element(a,'Time lag k',header=TRUE)
a<-table.element(a,'ACF(k)',header=TRUE)
a<-table.element(a,'T-STAT',header=TRUE)
a<-table.element(a,'P-value',header=TRUE)
a<-table.row.end(a)
for (i in 2:(par1+1)) {
a<-table.row.start(a)
a<-table.element(a,i-1,header=TRUE)
a<-table.element(a,round(myacf[i],6))
mytstat <- myacf[i]*sqrtn
a<-table.element(a,round(mytstat,4))
a<-table.element(a,round(1-pt(abs(mytstat),lengthx),6))
a<-table.row.end(a)
}
a<-table.end(a)
table.save(a,file='mytable.tab')
a<-table.start()
a<-table.row.start(a)
a<-table.element(a,'Partial Autocorrelation Function',4,TRUE)
a<-table.row.end(a)
a<-table.row.start(a)
a<-table.element(a,'Time lag k',header=TRUE)
a<-table.element(a,'PACF(k)',header=TRUE)
a<-table.element(a,'T-STAT',header=TRUE)
a<-table.element(a,'P-value',header=TRUE)
a<-table.row.end(a)
for (i in 1:par1) {
a<-table.row.start(a)
a<-table.element(a,i,header=TRUE)
a<-table.element(a,round(mypacf[i],6))
mytstat <- mypacf[i]*sqrtn
a<-table.element(a,round(mytstat,4))
a<-table.element(a,round(1-pt(abs(mytstat),lengthx),6))
a<-table.row.end(a)
}
a<-table.end(a)
table.save(a,file='mytable1.tab')