Free Statistics

of Irreproducible Research!

Author's title

Author*The author of this computation has been verified*
R Software Modulerwasp_univariatedataseries.wasp
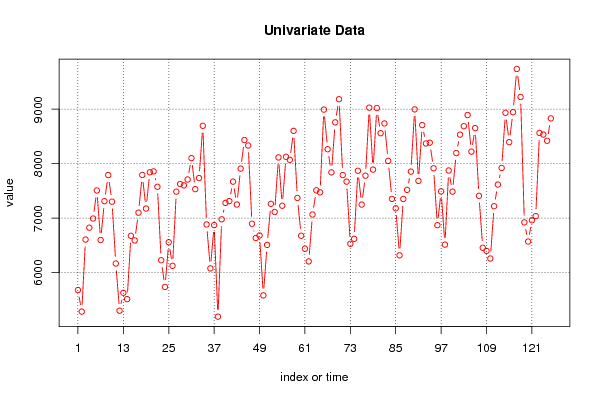
Title produced by softwareUnivariate Data Series
Date of computationWed, 14 Dec 2016 16:09:29 +0100
Cite this page as followsStatistical Computations at FreeStatistics.org, Office for Research Development and Education, URL https://freestatistics.org/blog/index.php?v=date/2016/Dec/14/t1481728177qvd99v8qzep4p6x.htm/, Retrieved Fri, 03 May 2024 19:53:17 +0000
Statistical Computations at FreeStatistics.org, Office for Research Development and Education, URL https://freestatistics.org/blog/index.php?pk=299548, Retrieved Fri, 03 May 2024 19:53:17 +0000
QR Codes:

Original text written by user:
IsPrivate?No (this computation is public)
User-defined keywords
Estimated Impact63
Family? (F = Feedback message, R = changed R code, M = changed R Module, P = changed Parameters, D = changed Data)
-       [Univariate Data Series] [] [2016-12-14 15:09:29] [1bf80170c5e6d32ce8f3ad7977dc404a] [Current]
Feedback Forum

Post a new message
Dataseries X:
5682.5
5286.5
6608
6826
6994.5
7509
6599.5
7312.5
7791.5
7302.5
6168.5
5303
5631.5
5515.5
6676.5
6592.5
7101
7793
7177
7843
7858.5
7576.5
6229
5739.5
6559
6126.5
7486.5
7627.5
7602.5
7710
8102
7533.5
7736.5
8695
6885
6079.5
6874
5194
6980.5
7280.5
7313.5
7670.5
7251
7909.5
8434
8333.5
6898.5
6637
6683
5584
6510.5
7263
7114.5
8114.5
7228.5
8126
8071
8602.5
7371.5
6678
6440.5
6207.5
7067.5
7512
7474.5
8992
8265.5
7841
8758.5
9183.5
7792
7670.5
6530.5
6621.5
7870
7250.5
7779.5
9027.5
7891.5
9021
8559
8738
8051.5
7354
7182
6319.5
7353.5
7519.5
7854.5
8996.5
7684.5
8708.5
8371
8385.5
7916
6872
7492
6515
7875
7487
8195.5
8533
8688
8892.5
8221.5
8652.5
7410.5
6457
6400.5
6260.5
7220
7617
7922
8934
8395
8945
9738
9224
6923
6572.5
6962.5
7038
8564
8534
8420.5
8831


Summary of computational transaction
Raw Input view raw input (R code)
Raw Outputview raw output of R engine
Computing time1 seconds
R ServerBig Analytics Cloud Computing Center

\begin{tabular}{lllllllll}
\hline
Summary of computational transaction \tabularnewline
Raw Input view raw input (R code)  \tabularnewline
Raw Outputview raw output of R engine  \tabularnewline
Computing time1 seconds \tabularnewline
R ServerBig Analytics Cloud Computing Center \tabularnewline
\hline
\end{tabular}
%Source: https://freestatistics.org/blog/index.php?pk=299548&T=0

[TABLE]
[ROW]
Summary of computational transaction[/C][/ROW] [ROW]Raw Input[/C] view raw input (R code) [/C][/ROW] [ROW]Raw Output[/C]view raw output of R engine [/C][/ROW] [ROW]Computing time[/C]1 seconds[/C][/ROW] [ROW]R Server[/C]Big Analytics Cloud Computing Center[/C][/ROW] [/TABLE] Source: https://freestatistics.org/blog/index.php?pk=299548&T=0

Globally Unique Identifier (entire table): ba.freestatistics.org/blog/index.php?pk=299548&T=0

As an alternative you can also use a QR Code:  

The GUIDs for individual cells are displayed in the table below:

Summary of computational transaction
Raw Input view raw input (R code)
Raw Outputview raw output of R engine
Computing time1 seconds
R ServerBig Analytics Cloud Computing Center


Univariate Dataseries
Name of dataseries
Source
Description
Number of observations126

\begin{tabular}{lllllllll}
\hline
Univariate Dataseries \tabularnewline
Name of dataseries &  \tabularnewline
Source &  \tabularnewline
Description &  \tabularnewline
Number of observations & 126 \tabularnewline
\hline
\end{tabular}
%Source: https://freestatistics.org/blog/index.php?pk=299548&T=1

[TABLE]
[ROW][C]Univariate Dataseries[/C][/ROW]
[ROW][C]Name of dataseries[/C][C][/C][/ROW]
[ROW][C]Source[/C][C][/C][/ROW]
[ROW][C]Description[/C][C][/C][/ROW]
[ROW][C]Number of observations[/C][C]126[/C][/ROW]
[/TABLE]
Source: https://freestatistics.org/blog/index.php?pk=299548&T=1

Globally Unique Identifier (entire table): ba.freestatistics.org/blog/index.php?pk=299548&T=1

As an alternative you can also use a QR Code:  

The GUIDs for individual cells are displayed in the table below:

Univariate Dataseries
Name of dataseries
Source
Description
Number of observations126


Summary Statistics of dataseries x
> summary(x)
   Min. 1st Qu.  Median    Mean 3rd Qu.    Max. 
   5194    6838    7500    7471    8123    9738 

\begin{tabular}{lllllllll}
\hline
Summary Statistics of dataseries x \tabularnewline
> summary(x)
   Min. 1st Qu.  Median    Mean 3rd Qu.    Max. 
   5194    6838    7500    7471    8123    9738 
\tabularnewline \hline \end{tabular} %Source: https://freestatistics.org/blog/index.php?pk=299548&T=2

[TABLE]
[ROW][C]Summary Statistics of dataseries x[/C][/ROW]
[ROW][C]
> summary(x)
   Min. 1st Qu.  Median    Mean 3rd Qu.    Max. 
   5194    6838    7500    7471    8123    9738 
[/C][/ROW] [/TABLE] Source: https://freestatistics.org/blog/index.php?pk=299548&T=2

Globally Unique Identifier (entire table): ba.freestatistics.org/blog/index.php?pk=299548&T=2

As an alternative you can also use a QR Code:  

The GUIDs for individual cells are displayed in the table below:

Summary Statistics of dataseries x
> summary(x)
   Min. 1st Qu.  Median    Mean 3rd Qu.    Max. 
   5194    6838    7500    7471    8123    9738 


Parameters (Session):
par4 = 12 ;
Parameters (R input):
par1 = ; par2 = ; par3 = ; par4 = 12 ;
R code (references can be found in the software module):
if (par4 != 'No season') {
par4 <- as.numeric(par4)
if (par4 < 4) par4 <- 12
}
summary(x)
n <- length(x)
bitmap(file='test1.png')
if (par4=='No season') {
plot(x,col=2,type='b',main=main,xlab=xlab,ylab=ylab,xaxt='n')
axis(1,at=seq(1,n,10))
}
if (par4!='No season') {
plot(x,col=2,type='b',main=main,xlab=xlab,ylab=ylab,xaxt='n')
axis(1,at=seq(1,n,par4))
grid(nx=0,ny=NULL,col='black')
abline(v=seq(1,n,par4),col='black',lty='dotted')
}
dev.off()
load(file='createtable')
a<-table.start()
a<-table.row.start(a)
a<-table.element(a,'Univariate Dataseries',2,TRUE)
a<-table.row.end(a)
a<-table.row.start(a)
a<-table.element(a,'Name of dataseries',header=TRUE)
a<-table.element(a,par1)
a<-table.row.end(a)
a<-table.row.start(a)
a<-table.element(a,'Source',header=TRUE)
a<-table.element(a,par2)
a<-table.row.end(a)
a<-table.row.start(a)
a<-table.element(a,'Description',header=TRUE)
a<-table.element(a,par3)
a<-table.row.end(a)
a<-table.row.start(a)
a<-table.element(a,'Number of observations',header=TRUE)
a<-table.element(a,length(x))
a<-table.row.end(a)
a<-table.end(a)
table.save(a,file='mytable.tab')
a<-table.start()
a<-table.row.start(a)
a<-table.element(a,'Summary Statistics of dataseries x',1,TRUE)
a<-table.row.end(a)
a<-table.row.start(a)
a<-table.element(a,paste('
',RC.texteval('summary(x)'),'
',sep=''))
a<-table.row.end(a)
a<-table.end(a)
table.save(a,file='mytable1.tab')