Free Statistics

of Irreproducible Research!

Author's title

Author*The author of this computation has been verified*
R Software Modulerwasp_arimaforecasting.wasp
Title produced by softwareARIMA Forecasting
Date of computationWed, 14 Dec 2016 15:39:22 +0100
Cite this page as followsStatistical Computations at FreeStatistics.org, Office for Research Development and Education, URL https://freestatistics.org/blog/index.php?v=date/2016/Dec/14/t14817311532ohmo5zftt53nk7.htm/, Retrieved Sat, 04 May 2024 03:54:24 +0000
Statistical Computations at FreeStatistics.org, Office for Research Development and Education, URL https://freestatistics.org/blog/index.php?pk=299588, Retrieved Sat, 04 May 2024 03:54:24 +0000
QR Codes:

Original text written by user:
IsPrivate?No (this computation is public)
User-defined keywords
Estimated Impact78
Family? (F = Feedback message, R = changed R code, M = changed R Module, P = changed Parameters, D = changed Data)
-       [ARIMA Forecasting] [Arima forecast 3e] [2016-12-14 14:39:22] [4c05fa0998bf98e29c2e453b139976f4] [Current]
- R P     [ARIMA Forecasting] [slnmsfm] [2016-12-16 15:23:29] [5f979cb1c6fa86b57093c7542788c28c]
- RMPD    [Standard Deviation-Mean Plot] [gqsdhjflkf] [2016-12-16 15:41:10] [5f979cb1c6fa86b57093c7542788c28c]
- RMPD    [ARIMA Backward Selection] [tfzgdheujf] [2016-12-16 15:51:32] [5f979cb1c6fa86b57093c7542788c28c]
-   PD    [ARIMA Forecasting] [dsfgdhj] [2016-12-16 16:05:54] [5f979cb1c6fa86b57093c7542788c28c]
- R         [ARIMA Forecasting] [dfgyhuijk] [2016-12-16 16:18:52] [5f979cb1c6fa86b57093c7542788c28c]
Feedback Forum

Post a new message
Dataseries X:
3281
3397
3498.5
3538
3449.5
3673
3350.5
3604
3673.5
3747
3616
3580.5
3710
3994.5
4091
3954.5
4004
4287
3831
4046.5
4079.5
4029.5
3880
3855
3841.5
4123.5
4133
3958.5
4003
4151.5
3723
3957
3965.5
3861.5
3917.5
3704
3950
4140.5
4090
4162
4066
4358.5
4022.5
4285.5
4373.5
4284.5
4077.5
4122
4181.5
4535.5
4497
4420.5
4370
4712
4475
4578.5
4751.5
4746
4581.5
4645.5
4751
4952.5
4996.5
4998
4986.5
5348
4933
5263
5330.5
5301
5159
5258.5
5411.5
5536.5
5613
5505.5
5476
5782.5
5283
5451.5
5578
5548.5
5379.5
5117.5
5316.5
5505.5
5620.5
5383.5
5461.5
5658.5
5357.5
5622
5608
5604.5
5399
5185
5221
5379.5
5333
5214
5206.5
5630
5285.5
5512.5
5592.5
5554.5
5284.5
5198.5
5241.5
5455
5548.5
5375
5346
5730.5
5457
5603


Summary of computational transaction
Raw Input view raw input (R code)
Raw Outputview raw output of R engine
Computing time1 seconds
R ServerBig Analytics Cloud Computing Center

\begin{tabular}{lllllllll}
\hline
Summary of computational transaction \tabularnewline
Raw Input view raw input (R code)  \tabularnewline
Raw Outputview raw output of R engine  \tabularnewline
Computing time1 seconds \tabularnewline
R ServerBig Analytics Cloud Computing Center \tabularnewline
\hline
\end{tabular}
%Source: https://freestatistics.org/blog/index.php?pk=299588&T=0

[TABLE]
[ROW]
Summary of computational transaction[/C][/ROW] [ROW]Raw Input[/C] view raw input (R code) [/C][/ROW] [ROW]Raw Output[/C]view raw output of R engine [/C][/ROW] [ROW]Computing time[/C]1 seconds[/C][/ROW] [ROW]R Server[/C]Big Analytics Cloud Computing Center[/C][/ROW] [/TABLE] Source: https://freestatistics.org/blog/index.php?pk=299588&T=0

Globally Unique Identifier (entire table): ba.freestatistics.org/blog/index.php?pk=299588&T=0

As an alternative you can also use a QR Code:  

The GUIDs for individual cells are displayed in the table below:

Summary of computational transaction
Raw Input view raw input (R code)
Raw Outputview raw output of R engine
Computing time1 seconds
R ServerBig Analytics Cloud Computing Center


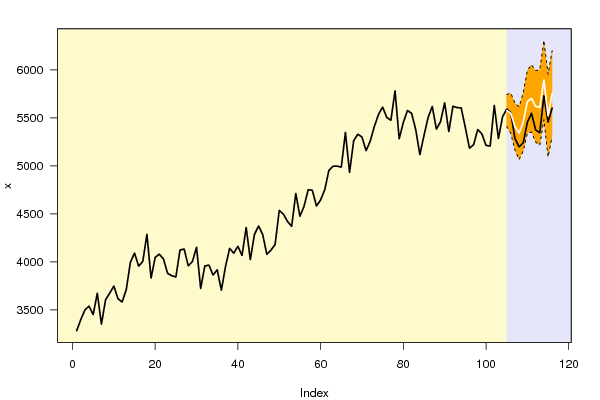
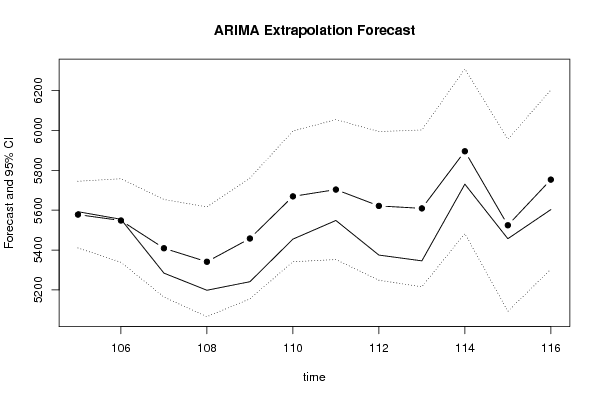
Univariate ARIMA Extrapolation Forecast
timeY[t]F[t]95% LB95% UBp-value(H0: Y[t] = F[t])P(F[t]>Y[t-1])P(F[t]>Y[t-s])P(F[t]>Y[104])
925622-------
935608-------
945604.5-------
955399-------
965185-------
975221-------
985379.5-------
995333-------
1005214-------
1015206.5-------
1025630-------
1035285.5-------
1045512.5-------
1055592.55577.97225410.725745.22430.43240.77850.36250.7785
1065554.55548.28695338.75155757.82240.47680.33960.29950.6311
1075284.55409.2275164.61115653.84280.15880.12220.53270.204
1085198.55341.47965066.21845616.74090.15430.65750.86740.1117
1095241.55458.0885155.30135760.87470.08050.95360.93760.3623
11054555669.31065341.56845997.05280.10.99470.95850.8258
1115548.55703.47795352.55046054.40530.19340.91740.98070.8569
11253755621.47865248.80565994.15170.09740.64940.98390.7167
11353465609.09075215.87286002.30870.09490.87840.97760.6849
1145730.55895.53645482.7956308.27780.21660.99550.89630.9655
11554575524.42675093.04455955.80890.37970.17460.86120.5216
11656035753.26165304.01146202.51180.25610.90190.85320.8532

\begin{tabular}{lllllllll}
\hline
Univariate ARIMA Extrapolation Forecast \tabularnewline
time & Y[t] & F[t] & 95% LB & 95% UB & p-value(H0: Y[t] = F[t]) & P(F[t]>Y[t-1]) & P(F[t]>Y[t-s]) & P(F[t]>Y[104]) \tabularnewline
92 & 5622 & - & - & - & - & - & - & - \tabularnewline
93 & 5608 & - & - & - & - & - & - & - \tabularnewline
94 & 5604.5 & - & - & - & - & - & - & - \tabularnewline
95 & 5399 & - & - & - & - & - & - & - \tabularnewline
96 & 5185 & - & - & - & - & - & - & - \tabularnewline
97 & 5221 & - & - & - & - & - & - & - \tabularnewline
98 & 5379.5 & - & - & - & - & - & - & - \tabularnewline
99 & 5333 & - & - & - & - & - & - & - \tabularnewline
100 & 5214 & - & - & - & - & - & - & - \tabularnewline
101 & 5206.5 & - & - & - & - & - & - & - \tabularnewline
102 & 5630 & - & - & - & - & - & - & - \tabularnewline
103 & 5285.5 & - & - & - & - & - & - & - \tabularnewline
104 & 5512.5 & - & - & - & - & - & - & - \tabularnewline
105 & 5592.5 & 5577.9722 & 5410.72 & 5745.2243 & 0.4324 & 0.7785 & 0.3625 & 0.7785 \tabularnewline
106 & 5554.5 & 5548.2869 & 5338.7515 & 5757.8224 & 0.4768 & 0.3396 & 0.2995 & 0.6311 \tabularnewline
107 & 5284.5 & 5409.227 & 5164.6111 & 5653.8428 & 0.1588 & 0.1222 & 0.5327 & 0.204 \tabularnewline
108 & 5198.5 & 5341.4796 & 5066.2184 & 5616.7409 & 0.1543 & 0.6575 & 0.8674 & 0.1117 \tabularnewline
109 & 5241.5 & 5458.088 & 5155.3013 & 5760.8747 & 0.0805 & 0.9536 & 0.9376 & 0.3623 \tabularnewline
110 & 5455 & 5669.3106 & 5341.5684 & 5997.0528 & 0.1 & 0.9947 & 0.9585 & 0.8258 \tabularnewline
111 & 5548.5 & 5703.4779 & 5352.5504 & 6054.4053 & 0.1934 & 0.9174 & 0.9807 & 0.8569 \tabularnewline
112 & 5375 & 5621.4786 & 5248.8056 & 5994.1517 & 0.0974 & 0.6494 & 0.9839 & 0.7167 \tabularnewline
113 & 5346 & 5609.0907 & 5215.8728 & 6002.3087 & 0.0949 & 0.8784 & 0.9776 & 0.6849 \tabularnewline
114 & 5730.5 & 5895.5364 & 5482.795 & 6308.2778 & 0.2166 & 0.9955 & 0.8963 & 0.9655 \tabularnewline
115 & 5457 & 5524.4267 & 5093.0445 & 5955.8089 & 0.3797 & 0.1746 & 0.8612 & 0.5216 \tabularnewline
116 & 5603 & 5753.2616 & 5304.0114 & 6202.5118 & 0.2561 & 0.9019 & 0.8532 & 0.8532 \tabularnewline
\hline
\end{tabular}
%Source: https://freestatistics.org/blog/index.php?pk=299588&T=1

[TABLE]
[ROW][C]Univariate ARIMA Extrapolation Forecast[/C][/ROW]
[ROW][C]time[/C][C]Y[t][/C][C]F[t][/C][C]95% LB[/C][C]95% UB[/C][C]p-value(H0: Y[t] = F[t])[/C][C]P(F[t]>Y[t-1])[/C][C]P(F[t]>Y[t-s])[/C][C]P(F[t]>Y[104])[/C][/ROW]
[ROW][C]92[/C][C]5622[/C][C]-[/C][C]-[/C][C]-[/C][C]-[/C][C]-[/C][C]-[/C][C]-[/C][/ROW]
[ROW][C]93[/C][C]5608[/C][C]-[/C][C]-[/C][C]-[/C][C]-[/C][C]-[/C][C]-[/C][C]-[/C][/ROW]
[ROW][C]94[/C][C]5604.5[/C][C]-[/C][C]-[/C][C]-[/C][C]-[/C][C]-[/C][C]-[/C][C]-[/C][/ROW]
[ROW][C]95[/C][C]5399[/C][C]-[/C][C]-[/C][C]-[/C][C]-[/C][C]-[/C][C]-[/C][C]-[/C][/ROW]
[ROW][C]96[/C][C]5185[/C][C]-[/C][C]-[/C][C]-[/C][C]-[/C][C]-[/C][C]-[/C][C]-[/C][/ROW]
[ROW][C]97[/C][C]5221[/C][C]-[/C][C]-[/C][C]-[/C][C]-[/C][C]-[/C][C]-[/C][C]-[/C][/ROW]
[ROW][C]98[/C][C]5379.5[/C][C]-[/C][C]-[/C][C]-[/C][C]-[/C][C]-[/C][C]-[/C][C]-[/C][/ROW]
[ROW][C]99[/C][C]5333[/C][C]-[/C][C]-[/C][C]-[/C][C]-[/C][C]-[/C][C]-[/C][C]-[/C][/ROW]
[ROW][C]100[/C][C]5214[/C][C]-[/C][C]-[/C][C]-[/C][C]-[/C][C]-[/C][C]-[/C][C]-[/C][/ROW]
[ROW][C]101[/C][C]5206.5[/C][C]-[/C][C]-[/C][C]-[/C][C]-[/C][C]-[/C][C]-[/C][C]-[/C][/ROW]
[ROW][C]102[/C][C]5630[/C][C]-[/C][C]-[/C][C]-[/C][C]-[/C][C]-[/C][C]-[/C][C]-[/C][/ROW]
[ROW][C]103[/C][C]5285.5[/C][C]-[/C][C]-[/C][C]-[/C][C]-[/C][C]-[/C][C]-[/C][C]-[/C][/ROW]
[ROW][C]104[/C][C]5512.5[/C][C]-[/C][C]-[/C][C]-[/C][C]-[/C][C]-[/C][C]-[/C][C]-[/C][/ROW]
[ROW][C]105[/C][C]5592.5[/C][C]5577.9722[/C][C]5410.72[/C][C]5745.2243[/C][C]0.4324[/C][C]0.7785[/C][C]0.3625[/C][C]0.7785[/C][/ROW]
[ROW][C]106[/C][C]5554.5[/C][C]5548.2869[/C][C]5338.7515[/C][C]5757.8224[/C][C]0.4768[/C][C]0.3396[/C][C]0.2995[/C][C]0.6311[/C][/ROW]
[ROW][C]107[/C][C]5284.5[/C][C]5409.227[/C][C]5164.6111[/C][C]5653.8428[/C][C]0.1588[/C][C]0.1222[/C][C]0.5327[/C][C]0.204[/C][/ROW]
[ROW][C]108[/C][C]5198.5[/C][C]5341.4796[/C][C]5066.2184[/C][C]5616.7409[/C][C]0.1543[/C][C]0.6575[/C][C]0.8674[/C][C]0.1117[/C][/ROW]
[ROW][C]109[/C][C]5241.5[/C][C]5458.088[/C][C]5155.3013[/C][C]5760.8747[/C][C]0.0805[/C][C]0.9536[/C][C]0.9376[/C][C]0.3623[/C][/ROW]
[ROW][C]110[/C][C]5455[/C][C]5669.3106[/C][C]5341.5684[/C][C]5997.0528[/C][C]0.1[/C][C]0.9947[/C][C]0.9585[/C][C]0.8258[/C][/ROW]
[ROW][C]111[/C][C]5548.5[/C][C]5703.4779[/C][C]5352.5504[/C][C]6054.4053[/C][C]0.1934[/C][C]0.9174[/C][C]0.9807[/C][C]0.8569[/C][/ROW]
[ROW][C]112[/C][C]5375[/C][C]5621.4786[/C][C]5248.8056[/C][C]5994.1517[/C][C]0.0974[/C][C]0.6494[/C][C]0.9839[/C][C]0.7167[/C][/ROW]
[ROW][C]113[/C][C]5346[/C][C]5609.0907[/C][C]5215.8728[/C][C]6002.3087[/C][C]0.0949[/C][C]0.8784[/C][C]0.9776[/C][C]0.6849[/C][/ROW]
[ROW][C]114[/C][C]5730.5[/C][C]5895.5364[/C][C]5482.795[/C][C]6308.2778[/C][C]0.2166[/C][C]0.9955[/C][C]0.8963[/C][C]0.9655[/C][/ROW]
[ROW][C]115[/C][C]5457[/C][C]5524.4267[/C][C]5093.0445[/C][C]5955.8089[/C][C]0.3797[/C][C]0.1746[/C][C]0.8612[/C][C]0.5216[/C][/ROW]
[ROW][C]116[/C][C]5603[/C][C]5753.2616[/C][C]5304.0114[/C][C]6202.5118[/C][C]0.2561[/C][C]0.9019[/C][C]0.8532[/C][C]0.8532[/C][/ROW]
[/TABLE]
Source: https://freestatistics.org/blog/index.php?pk=299588&T=1

Globally Unique Identifier (entire table): ba.freestatistics.org/blog/index.php?pk=299588&T=1

As an alternative you can also use a QR Code:  

The GUIDs for individual cells are displayed in the table below:

Univariate ARIMA Extrapolation Forecast
timeY[t]F[t]95% LB95% UBp-value(H0: Y[t] = F[t])P(F[t]>Y[t-1])P(F[t]>Y[t-s])P(F[t]>Y[104])
925622-------
935608-------
945604.5-------
955399-------
965185-------
975221-------
985379.5-------
995333-------
1005214-------
1015206.5-------
1025630-------
1035285.5-------
1045512.5-------
1055592.55577.97225410.725745.22430.43240.77850.36250.7785
1065554.55548.28695338.75155757.82240.47680.33960.29950.6311
1075284.55409.2275164.61115653.84280.15880.12220.53270.204
1085198.55341.47965066.21845616.74090.15430.65750.86740.1117
1095241.55458.0885155.30135760.87470.08050.95360.93760.3623
11054555669.31065341.56845997.05280.10.99470.95850.8258
1115548.55703.47795352.55046054.40530.19340.91740.98070.8569
11253755621.47865248.80565994.15170.09740.64940.98390.7167
11353465609.09075215.87286002.30870.09490.87840.97760.6849
1145730.55895.53645482.7956308.27780.21660.99550.89630.9655
11554575524.42675093.04455955.80890.37970.17460.86120.5216
11656035753.26165304.01146202.51180.25610.90190.85320.8532


Univariate ARIMA Extrapolation Forecast Performance
time% S.E.PEMAPEsMAPESq.EMSERMSEScaledEMASE
1050.01530.00260.00260.0026211.0584000.09130.0913
1060.01930.00110.00190.001938.6022124.830311.17270.0390.0652
1070.0231-0.02360.00910.00915556.81235268.824372.5867-0.78380.3047
1080.0263-0.02750.01370.013520443.16839062.410395.1967-0.89850.4531
1090.0283-0.04130.01920.018946910.372716632.0028128.9651-1.3610.6347
1100.0295-0.03930.02260.022245929.039821514.8423146.6794-1.34670.7534
1110.0314-0.02790.02330.02324018.13721872.4558147.8934-0.97390.7849
1120.0338-0.04590.02620.025760751.722726732.3642163.5003-1.54890.8804
1130.0358-0.04920.02870.028269216.7431452.8504177.3495-1.65320.9663
1140.0357-0.02880.02870.028227237.003831031.2657176.1569-1.03710.9733
1150.0398-0.01240.02720.02684546.356828623.5467169.1849-0.42370.9234
1160.0398-0.02680.02720.026722578.550128119.797167.6896-0.94420.9251

\begin{tabular}{lllllllll}
\hline
Univariate ARIMA Extrapolation Forecast Performance \tabularnewline
time & % S.E. & PE & MAPE & sMAPE & Sq.E & MSE & RMSE & ScaledE & MASE \tabularnewline
105 & 0.0153 & 0.0026 & 0.0026 & 0.0026 & 211.0584 & 0 & 0 & 0.0913 & 0.0913 \tabularnewline
106 & 0.0193 & 0.0011 & 0.0019 & 0.0019 & 38.6022 & 124.8303 & 11.1727 & 0.039 & 0.0652 \tabularnewline
107 & 0.0231 & -0.0236 & 0.0091 & 0.009 & 15556.8123 & 5268.8243 & 72.5867 & -0.7838 & 0.3047 \tabularnewline
108 & 0.0263 & -0.0275 & 0.0137 & 0.0135 & 20443.1683 & 9062.4103 & 95.1967 & -0.8985 & 0.4531 \tabularnewline
109 & 0.0283 & -0.0413 & 0.0192 & 0.0189 & 46910.3727 & 16632.0028 & 128.9651 & -1.361 & 0.6347 \tabularnewline
110 & 0.0295 & -0.0393 & 0.0226 & 0.0222 & 45929.0398 & 21514.8423 & 146.6794 & -1.3467 & 0.7534 \tabularnewline
111 & 0.0314 & -0.0279 & 0.0233 & 0.023 & 24018.137 & 21872.4558 & 147.8934 & -0.9739 & 0.7849 \tabularnewline
112 & 0.0338 & -0.0459 & 0.0262 & 0.0257 & 60751.7227 & 26732.3642 & 163.5003 & -1.5489 & 0.8804 \tabularnewline
113 & 0.0358 & -0.0492 & 0.0287 & 0.0282 & 69216.74 & 31452.8504 & 177.3495 & -1.6532 & 0.9663 \tabularnewline
114 & 0.0357 & -0.0288 & 0.0287 & 0.0282 & 27237.0038 & 31031.2657 & 176.1569 & -1.0371 & 0.9733 \tabularnewline
115 & 0.0398 & -0.0124 & 0.0272 & 0.0268 & 4546.3568 & 28623.5467 & 169.1849 & -0.4237 & 0.9234 \tabularnewline
116 & 0.0398 & -0.0268 & 0.0272 & 0.0267 & 22578.5501 & 28119.797 & 167.6896 & -0.9442 & 0.9251 \tabularnewline
\hline
\end{tabular}
%Source: https://freestatistics.org/blog/index.php?pk=299588&T=2

[TABLE]
[ROW][C]Univariate ARIMA Extrapolation Forecast Performance[/C][/ROW]
[ROW][C]time[/C][C]% S.E.[/C][C]PE[/C][C]MAPE[/C][C]sMAPE[/C][C]Sq.E[/C][C]MSE[/C][C]RMSE[/C][C]ScaledE[/C][C]MASE[/C][/ROW]
[ROW][C]105[/C][C]0.0153[/C][C]0.0026[/C][C]0.0026[/C][C]0.0026[/C][C]211.0584[/C][C]0[/C][C]0[/C][C]0.0913[/C][C]0.0913[/C][/ROW]
[ROW][C]106[/C][C]0.0193[/C][C]0.0011[/C][C]0.0019[/C][C]0.0019[/C][C]38.6022[/C][C]124.8303[/C][C]11.1727[/C][C]0.039[/C][C]0.0652[/C][/ROW]
[ROW][C]107[/C][C]0.0231[/C][C]-0.0236[/C][C]0.0091[/C][C]0.009[/C][C]15556.8123[/C][C]5268.8243[/C][C]72.5867[/C][C]-0.7838[/C][C]0.3047[/C][/ROW]
[ROW][C]108[/C][C]0.0263[/C][C]-0.0275[/C][C]0.0137[/C][C]0.0135[/C][C]20443.1683[/C][C]9062.4103[/C][C]95.1967[/C][C]-0.8985[/C][C]0.4531[/C][/ROW]
[ROW][C]109[/C][C]0.0283[/C][C]-0.0413[/C][C]0.0192[/C][C]0.0189[/C][C]46910.3727[/C][C]16632.0028[/C][C]128.9651[/C][C]-1.361[/C][C]0.6347[/C][/ROW]
[ROW][C]110[/C][C]0.0295[/C][C]-0.0393[/C][C]0.0226[/C][C]0.0222[/C][C]45929.0398[/C][C]21514.8423[/C][C]146.6794[/C][C]-1.3467[/C][C]0.7534[/C][/ROW]
[ROW][C]111[/C][C]0.0314[/C][C]-0.0279[/C][C]0.0233[/C][C]0.023[/C][C]24018.137[/C][C]21872.4558[/C][C]147.8934[/C][C]-0.9739[/C][C]0.7849[/C][/ROW]
[ROW][C]112[/C][C]0.0338[/C][C]-0.0459[/C][C]0.0262[/C][C]0.0257[/C][C]60751.7227[/C][C]26732.3642[/C][C]163.5003[/C][C]-1.5489[/C][C]0.8804[/C][/ROW]
[ROW][C]113[/C][C]0.0358[/C][C]-0.0492[/C][C]0.0287[/C][C]0.0282[/C][C]69216.74[/C][C]31452.8504[/C][C]177.3495[/C][C]-1.6532[/C][C]0.9663[/C][/ROW]
[ROW][C]114[/C][C]0.0357[/C][C]-0.0288[/C][C]0.0287[/C][C]0.0282[/C][C]27237.0038[/C][C]31031.2657[/C][C]176.1569[/C][C]-1.0371[/C][C]0.9733[/C][/ROW]
[ROW][C]115[/C][C]0.0398[/C][C]-0.0124[/C][C]0.0272[/C][C]0.0268[/C][C]4546.3568[/C][C]28623.5467[/C][C]169.1849[/C][C]-0.4237[/C][C]0.9234[/C][/ROW]
[ROW][C]116[/C][C]0.0398[/C][C]-0.0268[/C][C]0.0272[/C][C]0.0267[/C][C]22578.5501[/C][C]28119.797[/C][C]167.6896[/C][C]-0.9442[/C][C]0.9251[/C][/ROW]
[/TABLE]
Source: https://freestatistics.org/blog/index.php?pk=299588&T=2

Globally Unique Identifier (entire table): ba.freestatistics.org/blog/index.php?pk=299588&T=2

As an alternative you can also use a QR Code:  

The GUIDs for individual cells are displayed in the table below:

Univariate ARIMA Extrapolation Forecast Performance
time% S.E.PEMAPEsMAPESq.EMSERMSEScaledEMASE
1050.01530.00260.00260.0026211.0584000.09130.0913
1060.01930.00110.00190.001938.6022124.830311.17270.0390.0652
1070.0231-0.02360.00910.00915556.81235268.824372.5867-0.78380.3047
1080.0263-0.02750.01370.013520443.16839062.410395.1967-0.89850.4531
1090.0283-0.04130.01920.018946910.372716632.0028128.9651-1.3610.6347
1100.0295-0.03930.02260.022245929.039821514.8423146.6794-1.34670.7534
1110.0314-0.02790.02330.02324018.13721872.4558147.8934-0.97390.7849
1120.0338-0.04590.02620.025760751.722726732.3642163.5003-1.54890.8804
1130.0358-0.04920.02870.028269216.7431452.8504177.3495-1.65320.9663
1140.0357-0.02880.02870.028227237.003831031.2657176.1569-1.03710.9733
1150.0398-0.01240.02720.02684546.356828623.5467169.1849-0.42370.9234
1160.0398-0.02680.02720.026722578.550128119.797167.6896-0.94420.9251


Parameters (Session):
par1 = 12 ; par2 = 1 ; par3 = 1 ; par4 = 1 ; par5 = 12 ; par6 = 0 ; par7 = 1 ; par8 = 0 ; par9 = 1 ; par10 = FALSE ;
Parameters (R input):
par1 = 12 ; par2 = 1 ; par3 = 1 ; par4 = 1 ; par5 = 12 ; par6 = 0 ; par7 = 1 ; par8 = 0 ; par9 = 1 ; par10 = FALSE ;
R code (references can be found in the software module):
par1 <- as.numeric(par1) #cut off periods
par2 <- as.numeric(par2) #lambda
par3 <- as.numeric(par3) #degree of non-seasonal differencing
par4 <- as.numeric(par4) #degree of seasonal differencing
par5 <- as.numeric(par5) #seasonal period
par6 <- as.numeric(par6) #p
par7 <- as.numeric(par7) #q
par8 <- as.numeric(par8) #P
par9 <- as.numeric(par9) #Q
if (par10 == 'TRUE') par10 <- TRUE
if (par10 == 'FALSE') par10 <- FALSE
if (par2 == 0) x <- log(x)
if (par2 != 0) x <- x^par2
lx <- length(x)
first <- lx - 2*par1
nx <- lx - par1
nx1 <- nx + 1
fx <- lx - nx
if (fx < 1) {
fx <- par5*2
nx1 <- lx + fx - 1
first <- lx - 2*fx
}
first <- 1
if (fx < 3) fx <- round(lx/10,0)
(arima.out <- arima(x[1:nx], order=c(par6,par3,par7), seasonal=list(order=c(par8,par4,par9), period=par5), include.mean=par10, method='ML'))
(forecast <- predict(arima.out,fx))
(lb <- forecast$pred - 1.96 * forecast$se)
(ub <- forecast$pred + 1.96 * forecast$se)
if (par2 == 0) {
x <- exp(x)
forecast$pred <- exp(forecast$pred)
lb <- exp(lb)
ub <- exp(ub)
}
if (par2 != 0) {
x <- x^(1/par2)
forecast$pred <- forecast$pred^(1/par2)
lb <- lb^(1/par2)
ub <- ub^(1/par2)
}
if (par2 < 0) {
olb <- lb
lb <- ub
ub <- olb
}
(actandfor <- c(x[1:nx], forecast$pred))
(perc.se <- (ub-forecast$pred)/1.96/forecast$pred)
bitmap(file='test1.png')
opar <- par(mar=c(4,4,2,2),las=1)
ylim <- c( min(x[first:nx],lb), max(x[first:nx],ub))
plot(x,ylim=ylim,type='n',xlim=c(first,lx))
usr <- par('usr')
rect(usr[1],usr[3],nx+1,usr[4],border=NA,col='lemonchiffon')
rect(nx1,usr[3],usr[2],usr[4],border=NA,col='lavender')
abline(h= (-3:3)*2 , col ='gray', lty =3)
polygon( c(nx1:lx,lx:nx1), c(lb,rev(ub)), col = 'orange', lty=2,border=NA)
lines(nx1:lx, lb , lty=2)
lines(nx1:lx, ub , lty=2)
lines(x, lwd=2)
lines(nx1:lx, forecast$pred , lwd=2 , col ='white')
box()
par(opar)
dev.off()
prob.dec <- array(NA, dim=fx)
prob.sdec <- array(NA, dim=fx)
prob.ldec <- array(NA, dim=fx)
prob.pval <- array(NA, dim=fx)
perf.pe <- array(0, dim=fx)
perf.spe <- array(0, dim=fx)
perf.scalederr <- array(0, dim=fx)
perf.mase <- array(0, dim=fx)
perf.mase1 <- array(0, dim=fx)
perf.mape <- array(0, dim=fx)
perf.smape <- array(0, dim=fx)
perf.mape1 <- array(0, dim=fx)
perf.smape1 <- array(0,dim=fx)
perf.se <- array(0, dim=fx)
perf.mse <- array(0, dim=fx)
perf.mse1 <- array(0, dim=fx)
perf.rmse <- array(0, dim=fx)
perf.scaleddenom <- 0
for (i in 2:fx) {
perf.scaleddenom = perf.scaleddenom + abs(x[nx+i] - x[nx+i-1])
}
perf.scaleddenom = perf.scaleddenom / (fx-1)
for (i in 1:fx) {
locSD <- (ub[i] - forecast$pred[i]) / 1.96
perf.scalederr[i] = (x[nx+i] - forecast$pred[i]) / perf.scaleddenom
perf.pe[i] = (x[nx+i] - forecast$pred[i]) / x[nx+i]
perf.spe[i] = 2*(x[nx+i] - forecast$pred[i]) / (x[nx+i] + forecast$pred[i])
perf.se[i] = (x[nx+i] - forecast$pred[i])^2
prob.dec[i] = pnorm((x[nx+i-1] - forecast$pred[i]) / locSD)
prob.sdec[i] = pnorm((x[nx+i-par5] - forecast$pred[i]) / locSD)
prob.ldec[i] = pnorm((x[nx] - forecast$pred[i]) / locSD)
prob.pval[i] = pnorm(abs(x[nx+i] - forecast$pred[i]) / locSD)
}
perf.mape[1] = abs(perf.pe[1])
perf.smape[1] = abs(perf.spe[1])
perf.mape1[1] = perf.mape[1]
perf.smape1[1] = perf.smape[1]
perf.mse[1] = perf.se[1]
perf.mase[1] = abs(perf.scalederr[1])
perf.mase1[1] = perf.mase[1]
for (i in 2:fx) {
perf.mape[i] = perf.mape[i-1] + abs(perf.pe[i])
perf.mape1[i] = perf.mape[i] / i
perf.smape[i] = perf.smape[i-1] + abs(perf.spe[i])
perf.smape1[i] = perf.smape[i] / i
perf.mse[i] = perf.mse[i-1] + perf.se[i]
perf.mse1[i] = perf.mse[i] / i
perf.mase[i] = perf.mase[i-1] + abs(perf.scalederr[i])
perf.mase1[i] = perf.mase[i] / i
}
perf.rmse = sqrt(perf.mse1)
bitmap(file='test2.png')
plot(forecast$pred, pch=19, type='b',main='ARIMA Extrapolation Forecast', ylab='Forecast and 95% CI', xlab='time',ylim=c(min(lb),max(ub)))
dum <- forecast$pred
dum[1:par1] <- x[(nx+1):lx]
lines(dum, lty=1)
lines(ub,lty=3)
lines(lb,lty=3)
dev.off()
load(file='createtable')
a<-table.start()
a<-table.row.start(a)
a<-table.element(a,'Univariate ARIMA Extrapolation Forecast',9,TRUE)
a<-table.row.end(a)
a<-table.row.start(a)
a<-table.element(a,'time',1,header=TRUE)
a<-table.element(a,'Y[t]',1,header=TRUE)
a<-table.element(a,'F[t]',1,header=TRUE)
a<-table.element(a,'95% LB',1,header=TRUE)
a<-table.element(a,'95% UB',1,header=TRUE)
a<-table.element(a,'p-value
(H0: Y[t] = F[t])',1,header=TRUE)
a<-table.element(a,'P(F[t]>Y[t-1])',1,header=TRUE)
a<-table.element(a,'P(F[t]>Y[t-s])',1,header=TRUE)
mylab <- paste('P(F[t]>Y[',nx,sep='')
mylab <- paste(mylab,'])',sep='')
a<-table.element(a,mylab,1,header=TRUE)
a<-table.row.end(a)
for (i in (nx-par5):nx) {
a<-table.row.start(a)
a<-table.element(a,i,header=TRUE)
a<-table.element(a,x[i])
a<-table.element(a,'-')
a<-table.row.end(a)
}
for (i in 1:fx) {
a<-table.row.start(a)
a<-table.element(a,nx+i,header=TRUE)
a<-table.element(a,round(x[nx+i],4))
a<-table.element(a,round(forecast$pred[i],4))
a<-table.element(a,round(lb[i],4))
a<-table.element(a,round(ub[i],4))
a<-table.element(a,round((1-prob.pval[i]),4))
a<-table.element(a,round((1-prob.dec[i]),4))
a<-table.element(a,round((1-prob.sdec[i]),4))
a<-table.element(a,round((1-prob.ldec[i]),4))
a<-table.row.end(a)
}
a<-table.end(a)
table.save(a,file='mytable.tab')
a<-table.start()
a<-table.row.start(a)
a<-table.element(a,'Univariate ARIMA Extrapolation Forecast Performance',10,TRUE)
a<-table.row.end(a)
a<-table.row.start(a)
a<-table.element(a,'time',1,header=TRUE)
a<-table.element(a,'% S.E.',1,header=TRUE)
a<-table.element(a,'PE',1,header=TRUE)
a<-table.element(a,'MAPE',1,header=TRUE)
a<-table.element(a,'sMAPE',1,header=TRUE)
a<-table.element(a,'Sq.E',1,header=TRUE)
a<-table.element(a,'MSE',1,header=TRUE)
a<-table.element(a,'RMSE',1,header=TRUE)
a<-table.element(a,'ScaledE',1,header=TRUE)
a<-table.element(a,'MASE',1,header=TRUE)
a<-table.row.end(a)
for (i in 1:fx) {
a<-table.row.start(a)
a<-table.element(a,nx+i,header=TRUE)
a<-table.element(a,round(perc.se[i],4))
a<-table.element(a,round(perf.pe[i],4))
a<-table.element(a,round(perf.mape1[i],4))
a<-table.element(a,round(perf.smape1[i],4))
a<-table.element(a,round(perf.se[i],4))
a<-table.element(a,round(perf.mse1[i],4))
a<-table.element(a,round(perf.rmse[i],4))
a<-table.element(a,round(perf.scalederr[i],4))
a<-table.element(a,round(perf.mase1[i],4))
a<-table.row.end(a)
}
a<-table.end(a)
table.save(a,file='mytable1.tab')