Free Statistics

of Irreproducible Research!

Author's title

Author*The author of this computation has been verified*
R Software Modulerwasp_exponentialsmoothing.wasp
Title produced by softwareExponential Smoothing
Date of computationWed, 14 Dec 2016 18:08:22 +0100
Cite this page as followsStatistical Computations at FreeStatistics.org, Office for Research Development and Education, URL https://freestatistics.org/blog/index.php?v=date/2016/Dec/14/t1481735320y8zg9487aefetby.htm/, Retrieved Sat, 04 May 2024 04:28:33 +0000
Statistical Computations at FreeStatistics.org, Office for Research Development and Education, URL https://freestatistics.org/blog/index.php?pk=299639, Retrieved Sat, 04 May 2024 04:28:33 +0000
QR Codes:

Original text written by user:
IsPrivate?No (this computation is public)
User-defined keywords
Estimated Impact74
Family? (F = Feedback message, R = changed R code, M = changed R Module, P = changed Parameters, D = changed Data)
-       [Exponential Smoothing] [] [2016-12-14 17:08:22] [130d73899007e5ff8a4f636b9bcfb397] [Current]
Feedback Forum

Post a new message
Dataseries X:
4360
3120
4120
4000
5360
5240
4240
5460
4660
5160
5500
3820
5380
4920
4420
5700
6000
7160
6700
4520
5980
6240
4780
4800
5900
4200
5100
5440
5820
6160
7060
6760
5980
7020
6420
6620
7500
6180
8060
6500
6360
7760
7080
7940
7340
7860
6720
7680
8920
7200
7800


Summary of computational transaction
Raw Input view raw input (R code)
Raw Outputview raw output of R engine
Computing time1 seconds
R ServerBig Analytics Cloud Computing Center

\begin{tabular}{lllllllll}
\hline
Summary of computational transaction \tabularnewline
Raw Input view raw input (R code)  \tabularnewline
Raw Outputview raw output of R engine  \tabularnewline
Computing time1 seconds \tabularnewline
R ServerBig Analytics Cloud Computing Center \tabularnewline
\hline
\end{tabular}
%Source: https://freestatistics.org/blog/index.php?pk=299639&T=0

[TABLE]
[ROW]
Summary of computational transaction[/C][/ROW] [ROW]Raw Input[/C] view raw input (R code) [/C][/ROW] [ROW]Raw Output[/C]view raw output of R engine [/C][/ROW] [ROW]Computing time[/C]1 seconds[/C][/ROW] [ROW]R Server[/C]Big Analytics Cloud Computing Center[/C][/ROW] [/TABLE] Source: https://freestatistics.org/blog/index.php?pk=299639&T=0

Globally Unique Identifier (entire table): ba.freestatistics.org/blog/index.php?pk=299639&T=0

As an alternative you can also use a QR Code:  

The GUIDs for individual cells are displayed in the table below:

Summary of computational transaction
Raw Input view raw input (R code)
Raw Outputview raw output of R engine
Computing time1 seconds
R ServerBig Analytics Cloud Computing Center


Estimated Parameters of Exponential Smoothing
ParameterValue
alpha0.321781517234902
betaFALSE
gammaFALSE

\begin{tabular}{lllllllll}
\hline
Estimated Parameters of Exponential Smoothing \tabularnewline
Parameter & Value \tabularnewline
alpha & 0.321781517234902 \tabularnewline
beta & FALSE \tabularnewline
gamma & FALSE \tabularnewline
\hline
\end{tabular}
%Source: https://freestatistics.org/blog/index.php?pk=299639&T=1

[TABLE]
[ROW][C]Estimated Parameters of Exponential Smoothing[/C][/ROW]
[ROW][C]Parameter[/C][C]Value[/C][/ROW]
[ROW][C]alpha[/C][C]0.321781517234902[/C][/ROW]
[ROW][C]beta[/C][C]FALSE[/C][/ROW]
[ROW][C]gamma[/C][C]FALSE[/C][/ROW]
[/TABLE]
Source: https://freestatistics.org/blog/index.php?pk=299639&T=1

Globally Unique Identifier (entire table): ba.freestatistics.org/blog/index.php?pk=299639&T=1

As an alternative you can also use a QR Code:  

The GUIDs for individual cells are displayed in the table below:

Estimated Parameters of Exponential Smoothing
ParameterValue
alpha0.321781517234902
betaFALSE
gammaFALSE


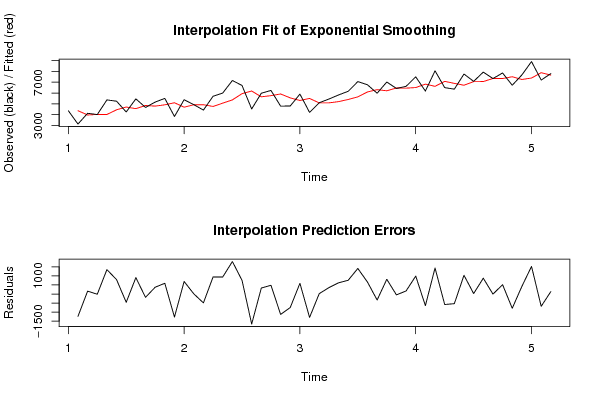
Interpolation Forecasts of Exponential Smoothing
tObservedFittedResiduals
231204360-1240
341203960.99091862872159.009081371279
440004012.1571020865-12.1571020864994
553604008.245171331931351.75482866807
652404443.21489103034796.785108969656
742404699.60561230478-459.605612304777
854604551.71302104767908.28697895233
946604843.98298321966-183.982983219656
1051604784.78065973383375.219340266169
1155004905.51930834056594.480691659443
1238205096.81220726959-1276.81220726959
1353804685.95763799033694.042362009665
1449204909.287642263110.7123577369002
1544204912.73468098884-492.734680988842
1657004754.181767746945.818232254002
1760005058.52859354912941.471406450876
1871605361.476691150161798.52330884984
1967005940.2082502542759.7917497458
2045206184.69519226996-1664.69519226996
2159805649.02704756769330.972952432312
2262405755.52802636507484.471973634927
2347805911.42215309911-1131.42215309911
2448005547.3514160417-747.351416041697
2559005306.86754348015593.132456519852
2642005497.72660526037-1297.72660526037
2751005080.1421692635919.8578307364096
2854405086.53205216695353.467947833054
2958205200.27150471457619.728495285426
3061605399.68868020122760.311319798779
3170605644.342810256941415.65718974306
3267606099.87512865696660.124871343038
3359806312.29111132222-332.29111132222
3470206205.36597335728814.634026642716
3564206467.50014644155-47.5001464415545
3666206452.21547725071167.784522749289
3775006506.20543554951993.794564450489
3861806825.99015831819-645.990158318188
3980606618.122465055751441.87753494425
4065007082.09200591703-582.092005917029
4163606894.78555708274-534.78555708274
4277606722.701449129341037.29855087066
4370807056.4849506540723.5150493459314
4479407064.05165891046875.948341089544
4573407345.91564512564-5.91564512564491
4678607344.01209986169515.987900138309
4767207510.04746924305-790.047469243047
4876807255.82479590242424.175204097575
4989207392.316536650371527.68346334963
5072007883.89683934168-683.896839341682
5178007663.83147674616136.168523253838

\begin{tabular}{lllllllll}
\hline
Interpolation Forecasts of Exponential Smoothing \tabularnewline
t & Observed & Fitted & Residuals \tabularnewline
2 & 3120 & 4360 & -1240 \tabularnewline
3 & 4120 & 3960.99091862872 & 159.009081371279 \tabularnewline
4 & 4000 & 4012.1571020865 & -12.1571020864994 \tabularnewline
5 & 5360 & 4008.24517133193 & 1351.75482866807 \tabularnewline
6 & 5240 & 4443.21489103034 & 796.785108969656 \tabularnewline
7 & 4240 & 4699.60561230478 & -459.605612304777 \tabularnewline
8 & 5460 & 4551.71302104767 & 908.28697895233 \tabularnewline
9 & 4660 & 4843.98298321966 & -183.982983219656 \tabularnewline
10 & 5160 & 4784.78065973383 & 375.219340266169 \tabularnewline
11 & 5500 & 4905.51930834056 & 594.480691659443 \tabularnewline
12 & 3820 & 5096.81220726959 & -1276.81220726959 \tabularnewline
13 & 5380 & 4685.95763799033 & 694.042362009665 \tabularnewline
14 & 4920 & 4909.2876422631 & 10.7123577369002 \tabularnewline
15 & 4420 & 4912.73468098884 & -492.734680988842 \tabularnewline
16 & 5700 & 4754.181767746 & 945.818232254002 \tabularnewline
17 & 6000 & 5058.52859354912 & 941.471406450876 \tabularnewline
18 & 7160 & 5361.47669115016 & 1798.52330884984 \tabularnewline
19 & 6700 & 5940.2082502542 & 759.7917497458 \tabularnewline
20 & 4520 & 6184.69519226996 & -1664.69519226996 \tabularnewline
21 & 5980 & 5649.02704756769 & 330.972952432312 \tabularnewline
22 & 6240 & 5755.52802636507 & 484.471973634927 \tabularnewline
23 & 4780 & 5911.42215309911 & -1131.42215309911 \tabularnewline
24 & 4800 & 5547.3514160417 & -747.351416041697 \tabularnewline
25 & 5900 & 5306.86754348015 & 593.132456519852 \tabularnewline
26 & 4200 & 5497.72660526037 & -1297.72660526037 \tabularnewline
27 & 5100 & 5080.14216926359 & 19.8578307364096 \tabularnewline
28 & 5440 & 5086.53205216695 & 353.467947833054 \tabularnewline
29 & 5820 & 5200.27150471457 & 619.728495285426 \tabularnewline
30 & 6160 & 5399.68868020122 & 760.311319798779 \tabularnewline
31 & 7060 & 5644.34281025694 & 1415.65718974306 \tabularnewline
32 & 6760 & 6099.87512865696 & 660.124871343038 \tabularnewline
33 & 5980 & 6312.29111132222 & -332.29111132222 \tabularnewline
34 & 7020 & 6205.36597335728 & 814.634026642716 \tabularnewline
35 & 6420 & 6467.50014644155 & -47.5001464415545 \tabularnewline
36 & 6620 & 6452.21547725071 & 167.784522749289 \tabularnewline
37 & 7500 & 6506.20543554951 & 993.794564450489 \tabularnewline
38 & 6180 & 6825.99015831819 & -645.990158318188 \tabularnewline
39 & 8060 & 6618.12246505575 & 1441.87753494425 \tabularnewline
40 & 6500 & 7082.09200591703 & -582.092005917029 \tabularnewline
41 & 6360 & 6894.78555708274 & -534.78555708274 \tabularnewline
42 & 7760 & 6722.70144912934 & 1037.29855087066 \tabularnewline
43 & 7080 & 7056.48495065407 & 23.5150493459314 \tabularnewline
44 & 7940 & 7064.05165891046 & 875.948341089544 \tabularnewline
45 & 7340 & 7345.91564512564 & -5.91564512564491 \tabularnewline
46 & 7860 & 7344.01209986169 & 515.987900138309 \tabularnewline
47 & 6720 & 7510.04746924305 & -790.047469243047 \tabularnewline
48 & 7680 & 7255.82479590242 & 424.175204097575 \tabularnewline
49 & 8920 & 7392.31653665037 & 1527.68346334963 \tabularnewline
50 & 7200 & 7883.89683934168 & -683.896839341682 \tabularnewline
51 & 7800 & 7663.83147674616 & 136.168523253838 \tabularnewline
\hline
\end{tabular}
%Source: https://freestatistics.org/blog/index.php?pk=299639&T=2

[TABLE]
[ROW][C]Interpolation Forecasts of Exponential Smoothing[/C][/ROW]
[ROW][C]t[/C][C]Observed[/C][C]Fitted[/C][C]Residuals[/C][/ROW]
[ROW][C]2[/C][C]3120[/C][C]4360[/C][C]-1240[/C][/ROW]
[ROW][C]3[/C][C]4120[/C][C]3960.99091862872[/C][C]159.009081371279[/C][/ROW]
[ROW][C]4[/C][C]4000[/C][C]4012.1571020865[/C][C]-12.1571020864994[/C][/ROW]
[ROW][C]5[/C][C]5360[/C][C]4008.24517133193[/C][C]1351.75482866807[/C][/ROW]
[ROW][C]6[/C][C]5240[/C][C]4443.21489103034[/C][C]796.785108969656[/C][/ROW]
[ROW][C]7[/C][C]4240[/C][C]4699.60561230478[/C][C]-459.605612304777[/C][/ROW]
[ROW][C]8[/C][C]5460[/C][C]4551.71302104767[/C][C]908.28697895233[/C][/ROW]
[ROW][C]9[/C][C]4660[/C][C]4843.98298321966[/C][C]-183.982983219656[/C][/ROW]
[ROW][C]10[/C][C]5160[/C][C]4784.78065973383[/C][C]375.219340266169[/C][/ROW]
[ROW][C]11[/C][C]5500[/C][C]4905.51930834056[/C][C]594.480691659443[/C][/ROW]
[ROW][C]12[/C][C]3820[/C][C]5096.81220726959[/C][C]-1276.81220726959[/C][/ROW]
[ROW][C]13[/C][C]5380[/C][C]4685.95763799033[/C][C]694.042362009665[/C][/ROW]
[ROW][C]14[/C][C]4920[/C][C]4909.2876422631[/C][C]10.7123577369002[/C][/ROW]
[ROW][C]15[/C][C]4420[/C][C]4912.73468098884[/C][C]-492.734680988842[/C][/ROW]
[ROW][C]16[/C][C]5700[/C][C]4754.181767746[/C][C]945.818232254002[/C][/ROW]
[ROW][C]17[/C][C]6000[/C][C]5058.52859354912[/C][C]941.471406450876[/C][/ROW]
[ROW][C]18[/C][C]7160[/C][C]5361.47669115016[/C][C]1798.52330884984[/C][/ROW]
[ROW][C]19[/C][C]6700[/C][C]5940.2082502542[/C][C]759.7917497458[/C][/ROW]
[ROW][C]20[/C][C]4520[/C][C]6184.69519226996[/C][C]-1664.69519226996[/C][/ROW]
[ROW][C]21[/C][C]5980[/C][C]5649.02704756769[/C][C]330.972952432312[/C][/ROW]
[ROW][C]22[/C][C]6240[/C][C]5755.52802636507[/C][C]484.471973634927[/C][/ROW]
[ROW][C]23[/C][C]4780[/C][C]5911.42215309911[/C][C]-1131.42215309911[/C][/ROW]
[ROW][C]24[/C][C]4800[/C][C]5547.3514160417[/C][C]-747.351416041697[/C][/ROW]
[ROW][C]25[/C][C]5900[/C][C]5306.86754348015[/C][C]593.132456519852[/C][/ROW]
[ROW][C]26[/C][C]4200[/C][C]5497.72660526037[/C][C]-1297.72660526037[/C][/ROW]
[ROW][C]27[/C][C]5100[/C][C]5080.14216926359[/C][C]19.8578307364096[/C][/ROW]
[ROW][C]28[/C][C]5440[/C][C]5086.53205216695[/C][C]353.467947833054[/C][/ROW]
[ROW][C]29[/C][C]5820[/C][C]5200.27150471457[/C][C]619.728495285426[/C][/ROW]
[ROW][C]30[/C][C]6160[/C][C]5399.68868020122[/C][C]760.311319798779[/C][/ROW]
[ROW][C]31[/C][C]7060[/C][C]5644.34281025694[/C][C]1415.65718974306[/C][/ROW]
[ROW][C]32[/C][C]6760[/C][C]6099.87512865696[/C][C]660.124871343038[/C][/ROW]
[ROW][C]33[/C][C]5980[/C][C]6312.29111132222[/C][C]-332.29111132222[/C][/ROW]
[ROW][C]34[/C][C]7020[/C][C]6205.36597335728[/C][C]814.634026642716[/C][/ROW]
[ROW][C]35[/C][C]6420[/C][C]6467.50014644155[/C][C]-47.5001464415545[/C][/ROW]
[ROW][C]36[/C][C]6620[/C][C]6452.21547725071[/C][C]167.784522749289[/C][/ROW]
[ROW][C]37[/C][C]7500[/C][C]6506.20543554951[/C][C]993.794564450489[/C][/ROW]
[ROW][C]38[/C][C]6180[/C][C]6825.99015831819[/C][C]-645.990158318188[/C][/ROW]
[ROW][C]39[/C][C]8060[/C][C]6618.12246505575[/C][C]1441.87753494425[/C][/ROW]
[ROW][C]40[/C][C]6500[/C][C]7082.09200591703[/C][C]-582.092005917029[/C][/ROW]
[ROW][C]41[/C][C]6360[/C][C]6894.78555708274[/C][C]-534.78555708274[/C][/ROW]
[ROW][C]42[/C][C]7760[/C][C]6722.70144912934[/C][C]1037.29855087066[/C][/ROW]
[ROW][C]43[/C][C]7080[/C][C]7056.48495065407[/C][C]23.5150493459314[/C][/ROW]
[ROW][C]44[/C][C]7940[/C][C]7064.05165891046[/C][C]875.948341089544[/C][/ROW]
[ROW][C]45[/C][C]7340[/C][C]7345.91564512564[/C][C]-5.91564512564491[/C][/ROW]
[ROW][C]46[/C][C]7860[/C][C]7344.01209986169[/C][C]515.987900138309[/C][/ROW]
[ROW][C]47[/C][C]6720[/C][C]7510.04746924305[/C][C]-790.047469243047[/C][/ROW]
[ROW][C]48[/C][C]7680[/C][C]7255.82479590242[/C][C]424.175204097575[/C][/ROW]
[ROW][C]49[/C][C]8920[/C][C]7392.31653665037[/C][C]1527.68346334963[/C][/ROW]
[ROW][C]50[/C][C]7200[/C][C]7883.89683934168[/C][C]-683.896839341682[/C][/ROW]
[ROW][C]51[/C][C]7800[/C][C]7663.83147674616[/C][C]136.168523253838[/C][/ROW]
[/TABLE]
Source: https://freestatistics.org/blog/index.php?pk=299639&T=2

Globally Unique Identifier (entire table): ba.freestatistics.org/blog/index.php?pk=299639&T=2

As an alternative you can also use a QR Code:  

The GUIDs for individual cells are displayed in the table below:

Interpolation Forecasts of Exponential Smoothing
tObservedFittedResiduals
231204360-1240
341203960.99091862872159.009081371279
440004012.1571020865-12.1571020864994
553604008.245171331931351.75482866807
652404443.21489103034796.785108969656
742404699.60561230478-459.605612304777
854604551.71302104767908.28697895233
946604843.98298321966-183.982983219656
1051604784.78065973383375.219340266169
1155004905.51930834056594.480691659443
1238205096.81220726959-1276.81220726959
1353804685.95763799033694.042362009665
1449204909.287642263110.7123577369002
1544204912.73468098884-492.734680988842
1657004754.181767746945.818232254002
1760005058.52859354912941.471406450876
1871605361.476691150161798.52330884984
1967005940.2082502542759.7917497458
2045206184.69519226996-1664.69519226996
2159805649.02704756769330.972952432312
2262405755.52802636507484.471973634927
2347805911.42215309911-1131.42215309911
2448005547.3514160417-747.351416041697
2559005306.86754348015593.132456519852
2642005497.72660526037-1297.72660526037
2751005080.1421692635919.8578307364096
2854405086.53205216695353.467947833054
2958205200.27150471457619.728495285426
3061605399.68868020122760.311319798779
3170605644.342810256941415.65718974306
3267606099.87512865696660.124871343038
3359806312.29111132222-332.29111132222
3470206205.36597335728814.634026642716
3564206467.50014644155-47.5001464415545
3666206452.21547725071167.784522749289
3775006506.20543554951993.794564450489
3861806825.99015831819-645.990158318188
3980606618.122465055751441.87753494425
4065007082.09200591703-582.092005917029
4163606894.78555708274-534.78555708274
4277606722.701449129341037.29855087066
4370807056.4849506540723.5150493459314
4479407064.05165891046875.948341089544
4573407345.91564512564-5.91564512564491
4678607344.01209986169515.987900138309
4767207510.04746924305-790.047469243047
4876807255.82479590242424.175204097575
4989207392.316536650371527.68346334963
5072007883.89683934168-683.896839341682
5178007663.83147674616136.168523253838


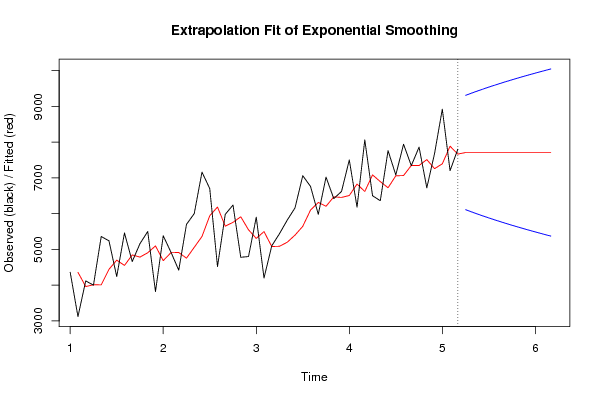
Extrapolation Forecasts of Exponential Smoothing
tForecast95% Lower Bound95% Upper Bound
527707.647990758426110.514657860719304.78132365612
537707.647990758426029.864673710759385.43130780608
547707.647990758425952.917574177579462.37840733927
557707.647990758425879.205809341539536.0901721753
567707.647990758425808.352651245619606.94333027122
577707.647990758425740.049260680159675.24672083668
587707.647990758425674.038702198769741.25727931808
597707.647990758425610.104495517699805.19148599914
607707.647990758425548.062222529439867.23375898741
617707.647990758425487.753248603359927.54273291349
627707.647990758425429.039941497149986.25604001969
637707.647990758425371.8019731303710043.4940083865

\begin{tabular}{lllllllll}
\hline
Extrapolation Forecasts of Exponential Smoothing \tabularnewline
t & Forecast & 95% Lower Bound & 95% Upper Bound \tabularnewline
52 & 7707.64799075842 & 6110.51465786071 & 9304.78132365612 \tabularnewline
53 & 7707.64799075842 & 6029.86467371075 & 9385.43130780608 \tabularnewline
54 & 7707.64799075842 & 5952.91757417757 & 9462.37840733927 \tabularnewline
55 & 7707.64799075842 & 5879.20580934153 & 9536.0901721753 \tabularnewline
56 & 7707.64799075842 & 5808.35265124561 & 9606.94333027122 \tabularnewline
57 & 7707.64799075842 & 5740.04926068015 & 9675.24672083668 \tabularnewline
58 & 7707.64799075842 & 5674.03870219876 & 9741.25727931808 \tabularnewline
59 & 7707.64799075842 & 5610.10449551769 & 9805.19148599914 \tabularnewline
60 & 7707.64799075842 & 5548.06222252943 & 9867.23375898741 \tabularnewline
61 & 7707.64799075842 & 5487.75324860335 & 9927.54273291349 \tabularnewline
62 & 7707.64799075842 & 5429.03994149714 & 9986.25604001969 \tabularnewline
63 & 7707.64799075842 & 5371.80197313037 & 10043.4940083865 \tabularnewline
\hline
\end{tabular}
%Source: https://freestatistics.org/blog/index.php?pk=299639&T=3

[TABLE]
[ROW][C]Extrapolation Forecasts of Exponential Smoothing[/C][/ROW]
[ROW][C]t[/C][C]Forecast[/C][C]95% Lower Bound[/C][C]95% Upper Bound[/C][/ROW]
[ROW][C]52[/C][C]7707.64799075842[/C][C]6110.51465786071[/C][C]9304.78132365612[/C][/ROW]
[ROW][C]53[/C][C]7707.64799075842[/C][C]6029.86467371075[/C][C]9385.43130780608[/C][/ROW]
[ROW][C]54[/C][C]7707.64799075842[/C][C]5952.91757417757[/C][C]9462.37840733927[/C][/ROW]
[ROW][C]55[/C][C]7707.64799075842[/C][C]5879.20580934153[/C][C]9536.0901721753[/C][/ROW]
[ROW][C]56[/C][C]7707.64799075842[/C][C]5808.35265124561[/C][C]9606.94333027122[/C][/ROW]
[ROW][C]57[/C][C]7707.64799075842[/C][C]5740.04926068015[/C][C]9675.24672083668[/C][/ROW]
[ROW][C]58[/C][C]7707.64799075842[/C][C]5674.03870219876[/C][C]9741.25727931808[/C][/ROW]
[ROW][C]59[/C][C]7707.64799075842[/C][C]5610.10449551769[/C][C]9805.19148599914[/C][/ROW]
[ROW][C]60[/C][C]7707.64799075842[/C][C]5548.06222252943[/C][C]9867.23375898741[/C][/ROW]
[ROW][C]61[/C][C]7707.64799075842[/C][C]5487.75324860335[/C][C]9927.54273291349[/C][/ROW]
[ROW][C]62[/C][C]7707.64799075842[/C][C]5429.03994149714[/C][C]9986.25604001969[/C][/ROW]
[ROW][C]63[/C][C]7707.64799075842[/C][C]5371.80197313037[/C][C]10043.4940083865[/C][/ROW]
[/TABLE]
Source: https://freestatistics.org/blog/index.php?pk=299639&T=3

Globally Unique Identifier (entire table): ba.freestatistics.org/blog/index.php?pk=299639&T=3

As an alternative you can also use a QR Code:  

The GUIDs for individual cells are displayed in the table below:

Extrapolation Forecasts of Exponential Smoothing
tForecast95% Lower Bound95% Upper Bound
527707.647990758426110.514657860719304.78132365612
537707.647990758426029.864673710759385.43130780608
547707.647990758425952.917574177579462.37840733927
557707.647990758425879.205809341539536.0901721753
567707.647990758425808.352651245619606.94333027122
577707.647990758425740.049260680159675.24672083668
587707.647990758425674.038702198769741.25727931808
597707.647990758425610.104495517699805.19148599914
607707.647990758425548.062222529439867.23375898741
617707.647990758425487.753248603359927.54273291349
627707.647990758425429.039941497149986.25604001969
637707.647990758425371.8019731303710043.4940083865


Parameters (Session):
par1 = 12 ; par2 = 12 ; par3 = BFGS ;
Parameters (R input):
par1 = 12 ; par2 = Single ; par3 = additive ; par4 = 12 ;
R code (references can be found in the software module):
par1 <- as.numeric(par1)
par4 <- as.numeric(par4)
if (par2 == 'Single') K <- 1
if (par2 == 'Double') K <- 2
if (par2 == 'Triple') K <- par1
nx <- length(x)
nxmK <- nx - K
x <- ts(x, frequency = par1)
if (par2 == 'Single') fit <- HoltWinters(x, gamma=F, beta=F)
if (par2 == 'Double') fit <- HoltWinters(x, gamma=F)
if (par2 == 'Triple') fit <- HoltWinters(x, seasonal=par3)
fit
myresid <- x - fit$fitted[,'xhat']
bitmap(file='test1.png')
op <- par(mfrow=c(2,1))
plot(fit,ylab='Observed (black) / Fitted (red)',main='Interpolation Fit of Exponential Smoothing')
plot(myresid,ylab='Residuals',main='Interpolation Prediction Errors')
par(op)
dev.off()
bitmap(file='test2.png')
p <- predict(fit, par4, prediction.interval=TRUE)
np <- length(p[,1])
plot(fit,p,ylab='Observed (black) / Fitted (red)',main='Extrapolation Fit of Exponential Smoothing')
dev.off()
bitmap(file='test3.png')
op <- par(mfrow = c(2,2))
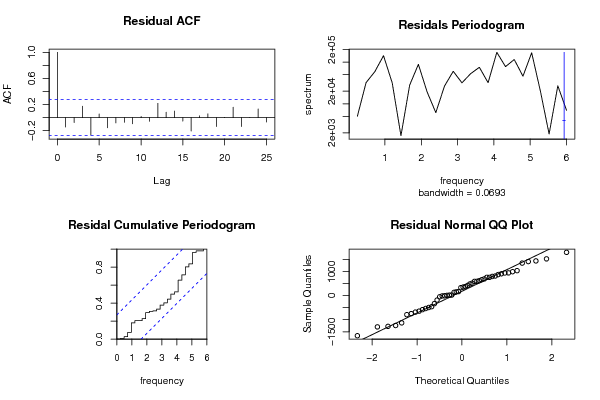
acf(as.numeric(myresid),lag.max = nx/2,main='Residual ACF')
spectrum(myresid,main='Residals Periodogram')
cpgram(myresid,main='Residal Cumulative Periodogram')
qqnorm(myresid,main='Residual Normal QQ Plot')
qqline(myresid)
par(op)
dev.off()
load(file='createtable')
a<-table.start()
a<-table.row.start(a)
a<-table.element(a,'Estimated Parameters of Exponential Smoothing',2,TRUE)
a<-table.row.end(a)
a<-table.row.start(a)
a<-table.element(a,'Parameter',header=TRUE)
a<-table.element(a,'Value',header=TRUE)
a<-table.row.end(a)
a<-table.row.start(a)
a<-table.element(a,'alpha',header=TRUE)
a<-table.element(a,fit$alpha)
a<-table.row.end(a)
a<-table.row.start(a)
a<-table.element(a,'beta',header=TRUE)
a<-table.element(a,fit$beta)
a<-table.row.end(a)
a<-table.row.start(a)
a<-table.element(a,'gamma',header=TRUE)
a<-table.element(a,fit$gamma)
a<-table.row.end(a)
a<-table.end(a)
table.save(a,file='mytable.tab')
a<-table.start()
a<-table.row.start(a)
a<-table.element(a,'Interpolation Forecasts of Exponential Smoothing',4,TRUE)
a<-table.row.end(a)
a<-table.row.start(a)
a<-table.element(a,'t',header=TRUE)
a<-table.element(a,'Observed',header=TRUE)
a<-table.element(a,'Fitted',header=TRUE)
a<-table.element(a,'Residuals',header=TRUE)
a<-table.row.end(a)
for (i in 1:nxmK) {
a<-table.row.start(a)
a<-table.element(a,i+K,header=TRUE)
a<-table.element(a,x[i+K])
a<-table.element(a,fit$fitted[i,'xhat'])
a<-table.element(a,myresid[i])
a<-table.row.end(a)
}
a<-table.end(a)
table.save(a,file='mytable1.tab')
a<-table.start()
a<-table.row.start(a)
a<-table.element(a,'Extrapolation Forecasts of Exponential Smoothing',4,TRUE)
a<-table.row.end(a)
a<-table.row.start(a)
a<-table.element(a,'t',header=TRUE)
a<-table.element(a,'Forecast',header=TRUE)
a<-table.element(a,'95% Lower Bound',header=TRUE)
a<-table.element(a,'95% Upper Bound',header=TRUE)
a<-table.row.end(a)
for (i in 1:np) {
a<-table.row.start(a)
a<-table.element(a,nx+i,header=TRUE)
a<-table.element(a,p[i,'fit'])
a<-table.element(a,p[i,'lwr'])
a<-table.element(a,p[i,'upr'])
a<-table.row.end(a)
}
a<-table.end(a)
table.save(a,file='mytable2.tab')