Free Statistics

of Irreproducible Research!

Author's title

Author*The author of this computation has been verified*
R Software Modulerwasp_structuraltimeseries.wasp
Title produced by softwareStructural Time Series Models
Date of computationWed, 14 Dec 2016 18:10:54 +0100
Cite this page as followsStatistical Computations at FreeStatistics.org, Office for Research Development and Education, URL https://freestatistics.org/blog/index.php?v=date/2016/Dec/14/t1481735467o3e2v8b932356gb.htm/, Retrieved Fri, 03 May 2024 17:06:21 +0000
Statistical Computations at FreeStatistics.org, Office for Research Development and Education, URL https://freestatistics.org/blog/index.php?pk=299641, Retrieved Fri, 03 May 2024 17:06:21 +0000
QR Codes:

Original text written by user:
IsPrivate?No (this computation is public)
User-defined keywords
Estimated Impact70
Family? (F = Feedback message, R = changed R code, M = changed R Module, P = changed Parameters, D = changed Data)
-       [Structural Time Series Models] [] [2016-12-14 17:10:54] [130d73899007e5ff8a4f636b9bcfb397] [Current]
Feedback Forum

Post a new message
Dataseries X:
1000
1583.33
2500
2916.67
3083.33
4062.5
4333.33
4500
3687.5
3333.33
7062.5
9625
7750
7541.67
6166.67
6333.33
10958.33
12000
11333.33
12729.17
9270.83
7833.33
6979.17
6500


Summary of computational transaction
Raw Input view raw input (R code)
Raw Outputview raw output of R engine
Computing time3 seconds
R ServerBig Analytics Cloud Computing Center

\begin{tabular}{lllllllll}
\hline
Summary of computational transaction \tabularnewline
Raw Input view raw input (R code)  \tabularnewline
Raw Outputview raw output of R engine  \tabularnewline
Computing time3 seconds \tabularnewline
R ServerBig Analytics Cloud Computing Center \tabularnewline
\hline
\end{tabular}
%Source: https://freestatistics.org/blog/index.php?pk=299641&T=0

[TABLE]
[ROW]
Summary of computational transaction[/C][/ROW] [ROW]Raw Input[/C] view raw input (R code) [/C][/ROW] [ROW]Raw Output[/C]view raw output of R engine [/C][/ROW] [ROW]Computing time[/C]3 seconds[/C][/ROW] [ROW]R Server[/C]Big Analytics Cloud Computing Center[/C][/ROW] [/TABLE] Source: https://freestatistics.org/blog/index.php?pk=299641&T=0

Globally Unique Identifier (entire table): ba.freestatistics.org/blog/index.php?pk=299641&T=0

As an alternative you can also use a QR Code:  

The GUIDs for individual cells are displayed in the table below:

Summary of computational transaction
Raw Input view raw input (R code)
Raw Outputview raw output of R engine
Computing time3 seconds
R ServerBig Analytics Cloud Computing Center


Structural Time Series Model -- Interpolation
tObservedLevelSlopeSeasonalStand. Residuals
110001000000
21583.331552.9968432212530.333156893343530.33315677875360.194330637876932
325002466.1356210241133.864378975892933.86437897589310.517709767168256
42916.672881.2865512557635.383448744239835.38344874423970.223598717901347
53083.333047.4276716597235.902328340276935.90232834027690.0766799076486714
64062.54022.8840197883239.615980211683739.61598021168370.550976105493417
74333.334292.8072982343140.52270176568540.52270176568510.13505645459723
845004458.9845354005141.015464599487141.01546459948720.0736855744177681
93687.53649.8056069120337.694393087971237.6943930879711-0.498562061933475
103333.333297.1544609961136.175539003890236.1755390038903-0.228900596303149
117062.57012.0657965514650.43420344853850.43420344853782.15721305377724
1296259564.9040059901260.09599400988460.09599400988421.46740039224771
1377508796.5867010595195.1442454998836-1046.58670105951-0.586917800810217
147541.677480.6851470688460.984851565779560.9848529311641-0.703987703485304
156166.676108.2912913164958.378708683513358.3787086835139-0.839672279671116
166333.336274.7551295666558.574870433354258.57487043335430.0633160916793418
1710958.3310891.49758001566.832419985015566.83241998501512.67016271303623
181200011931.407945481568.59205451847568.59205451847480.570025597586669
1911333.3311266.062741910467.267258089610267.2672580896103-0.429937133521868
2012729.1712659.513222708869.656777291190269.65677729119020.776870885728533
219270.839207.5071483870763.322851612932363.3228516129321-2.06296751978214
227833.337772.6967949417560.633205058250660.6332050582503-0.877595412089224
236979.176920.1732764443858.996723555616158.9967235556161-0.534919632990331
2465006441.9642884034558.035711596545758.0357115965458-0.314690145587853

\begin{tabular}{lllllllll}
\hline
Structural Time Series Model -- Interpolation \tabularnewline
t & Observed & Level & Slope & Seasonal & Stand. Residuals \tabularnewline
1 & 1000 & 1000 & 0 & 0 & 0 \tabularnewline
2 & 1583.33 & 1552.99684322125 & 30.3331568933435 & 30.3331567787536 & 0.194330637876932 \tabularnewline
3 & 2500 & 2466.13562102411 & 33.8643789758929 & 33.8643789758931 & 0.517709767168256 \tabularnewline
4 & 2916.67 & 2881.28655125576 & 35.3834487442398 & 35.3834487442397 & 0.223598717901347 \tabularnewline
5 & 3083.33 & 3047.42767165972 & 35.9023283402769 & 35.9023283402769 & 0.0766799076486714 \tabularnewline
6 & 4062.5 & 4022.88401978832 & 39.6159802116837 & 39.6159802116837 & 0.550976105493417 \tabularnewline
7 & 4333.33 & 4292.80729823431 & 40.522701765685 & 40.5227017656851 & 0.13505645459723 \tabularnewline
8 & 4500 & 4458.98453540051 & 41.0154645994871 & 41.0154645994872 & 0.0736855744177681 \tabularnewline
9 & 3687.5 & 3649.80560691203 & 37.6943930879712 & 37.6943930879711 & -0.498562061933475 \tabularnewline
10 & 3333.33 & 3297.15446099611 & 36.1755390038902 & 36.1755390038903 & -0.228900596303149 \tabularnewline
11 & 7062.5 & 7012.06579655146 & 50.434203448538 & 50.4342034485378 & 2.15721305377724 \tabularnewline
12 & 9625 & 9564.90400599012 & 60.095994009884 & 60.0959940098842 & 1.46740039224771 \tabularnewline
13 & 7750 & 8796.58670105951 & 95.1442454998836 & -1046.58670105951 & -0.586917800810217 \tabularnewline
14 & 7541.67 & 7480.68514706884 & 60.9848515657795 & 60.9848529311641 & -0.703987703485304 \tabularnewline
15 & 6166.67 & 6108.29129131649 & 58.3787086835133 & 58.3787086835139 & -0.839672279671116 \tabularnewline
16 & 6333.33 & 6274.75512956665 & 58.5748704333542 & 58.5748704333543 & 0.0633160916793418 \tabularnewline
17 & 10958.33 & 10891.497580015 & 66.8324199850155 & 66.8324199850151 & 2.67016271303623 \tabularnewline
18 & 12000 & 11931.4079454815 & 68.592054518475 & 68.5920545184748 & 0.570025597586669 \tabularnewline
19 & 11333.33 & 11266.0627419104 & 67.2672580896102 & 67.2672580896103 & -0.429937133521868 \tabularnewline
20 & 12729.17 & 12659.5132227088 & 69.6567772911902 & 69.6567772911902 & 0.776870885728533 \tabularnewline
21 & 9270.83 & 9207.50714838707 & 63.3228516129323 & 63.3228516129321 & -2.06296751978214 \tabularnewline
22 & 7833.33 & 7772.69679494175 & 60.6332050582506 & 60.6332050582503 & -0.877595412089224 \tabularnewline
23 & 6979.17 & 6920.17327644438 & 58.9967235556161 & 58.9967235556161 & -0.534919632990331 \tabularnewline
24 & 6500 & 6441.96428840345 & 58.0357115965457 & 58.0357115965458 & -0.314690145587853 \tabularnewline
\hline
\end{tabular}
%Source: https://freestatistics.org/blog/index.php?pk=299641&T=1

[TABLE]
[ROW][C]Structural Time Series Model -- Interpolation[/C][/ROW]
[ROW][C]t[/C][C]Observed[/C][C]Level[/C][C]Slope[/C][C]Seasonal[/C][C]Stand. Residuals[/C][/ROW]
[ROW][C]1[/C][C]1000[/C][C]1000[/C][C]0[/C][C]0[/C][C]0[/C][/ROW]
[ROW][C]2[/C][C]1583.33[/C][C]1552.99684322125[/C][C]30.3331568933435[/C][C]30.3331567787536[/C][C]0.194330637876932[/C][/ROW]
[ROW][C]3[/C][C]2500[/C][C]2466.13562102411[/C][C]33.8643789758929[/C][C]33.8643789758931[/C][C]0.517709767168256[/C][/ROW]
[ROW][C]4[/C][C]2916.67[/C][C]2881.28655125576[/C][C]35.3834487442398[/C][C]35.3834487442397[/C][C]0.223598717901347[/C][/ROW]
[ROW][C]5[/C][C]3083.33[/C][C]3047.42767165972[/C][C]35.9023283402769[/C][C]35.9023283402769[/C][C]0.0766799076486714[/C][/ROW]
[ROW][C]6[/C][C]4062.5[/C][C]4022.88401978832[/C][C]39.6159802116837[/C][C]39.6159802116837[/C][C]0.550976105493417[/C][/ROW]
[ROW][C]7[/C][C]4333.33[/C][C]4292.80729823431[/C][C]40.522701765685[/C][C]40.5227017656851[/C][C]0.13505645459723[/C][/ROW]
[ROW][C]8[/C][C]4500[/C][C]4458.98453540051[/C][C]41.0154645994871[/C][C]41.0154645994872[/C][C]0.0736855744177681[/C][/ROW]
[ROW][C]9[/C][C]3687.5[/C][C]3649.80560691203[/C][C]37.6943930879712[/C][C]37.6943930879711[/C][C]-0.498562061933475[/C][/ROW]
[ROW][C]10[/C][C]3333.33[/C][C]3297.15446099611[/C][C]36.1755390038902[/C][C]36.1755390038903[/C][C]-0.228900596303149[/C][/ROW]
[ROW][C]11[/C][C]7062.5[/C][C]7012.06579655146[/C][C]50.434203448538[/C][C]50.4342034485378[/C][C]2.15721305377724[/C][/ROW]
[ROW][C]12[/C][C]9625[/C][C]9564.90400599012[/C][C]60.095994009884[/C][C]60.0959940098842[/C][C]1.46740039224771[/C][/ROW]
[ROW][C]13[/C][C]7750[/C][C]8796.58670105951[/C][C]95.1442454998836[/C][C]-1046.58670105951[/C][C]-0.586917800810217[/C][/ROW]
[ROW][C]14[/C][C]7541.67[/C][C]7480.68514706884[/C][C]60.9848515657795[/C][C]60.9848529311641[/C][C]-0.703987703485304[/C][/ROW]
[ROW][C]15[/C][C]6166.67[/C][C]6108.29129131649[/C][C]58.3787086835133[/C][C]58.3787086835139[/C][C]-0.839672279671116[/C][/ROW]
[ROW][C]16[/C][C]6333.33[/C][C]6274.75512956665[/C][C]58.5748704333542[/C][C]58.5748704333543[/C][C]0.0633160916793418[/C][/ROW]
[ROW][C]17[/C][C]10958.33[/C][C]10891.497580015[/C][C]66.8324199850155[/C][C]66.8324199850151[/C][C]2.67016271303623[/C][/ROW]
[ROW][C]18[/C][C]12000[/C][C]11931.4079454815[/C][C]68.592054518475[/C][C]68.5920545184748[/C][C]0.570025597586669[/C][/ROW]
[ROW][C]19[/C][C]11333.33[/C][C]11266.0627419104[/C][C]67.2672580896102[/C][C]67.2672580896103[/C][C]-0.429937133521868[/C][/ROW]
[ROW][C]20[/C][C]12729.17[/C][C]12659.5132227088[/C][C]69.6567772911902[/C][C]69.6567772911902[/C][C]0.776870885728533[/C][/ROW]
[ROW][C]21[/C][C]9270.83[/C][C]9207.50714838707[/C][C]63.3228516129323[/C][C]63.3228516129321[/C][C]-2.06296751978214[/C][/ROW]
[ROW][C]22[/C][C]7833.33[/C][C]7772.69679494175[/C][C]60.6332050582506[/C][C]60.6332050582503[/C][C]-0.877595412089224[/C][/ROW]
[ROW][C]23[/C][C]6979.17[/C][C]6920.17327644438[/C][C]58.9967235556161[/C][C]58.9967235556161[/C][C]-0.534919632990331[/C][/ROW]
[ROW][C]24[/C][C]6500[/C][C]6441.96428840345[/C][C]58.0357115965457[/C][C]58.0357115965458[/C][C]-0.314690145587853[/C][/ROW]
[/TABLE]
Source: https://freestatistics.org/blog/index.php?pk=299641&T=1

Globally Unique Identifier (entire table): ba.freestatistics.org/blog/index.php?pk=299641&T=1

As an alternative you can also use a QR Code:  

The GUIDs for individual cells are displayed in the table below:

Structural Time Series Model -- Interpolation
tObservedLevelSlopeSeasonalStand. Residuals
110001000000
21583.331552.9968432212530.333156893343530.33315677875360.194330637876932
325002466.1356210241133.864378975892933.86437897589310.517709767168256
42916.672881.2865512557635.383448744239835.38344874423970.223598717901347
53083.333047.4276716597235.902328340276935.90232834027690.0766799076486714
64062.54022.8840197883239.615980211683739.61598021168370.550976105493417
74333.334292.8072982343140.52270176568540.52270176568510.13505645459723
845004458.9845354005141.015464599487141.01546459948720.0736855744177681
93687.53649.8056069120337.694393087971237.6943930879711-0.498562061933475
103333.333297.1544609961136.175539003890236.1755390038903-0.228900596303149
117062.57012.0657965514650.43420344853850.43420344853782.15721305377724
1296259564.9040059901260.09599400988460.09599400988421.46740039224771
1377508796.5867010595195.1442454998836-1046.58670105951-0.586917800810217
147541.677480.6851470688460.984851565779560.9848529311641-0.703987703485304
156166.676108.2912913164958.378708683513358.3787086835139-0.839672279671116
166333.336274.7551295666558.574870433354258.57487043335430.0633160916793418
1710958.3310891.49758001566.832419985015566.83241998501512.67016271303623
181200011931.407945481568.59205451847568.59205451847480.570025597586669
1911333.3311266.062741910467.267258089610267.2672580896103-0.429937133521868
2012729.1712659.513222708869.656777291190269.65677729119020.776870885728533
219270.839207.5071483870763.322851612932363.3228516129321-2.06296751978214
227833.337772.6967949417560.633205058250660.6332050582503-0.877595412089224
236979.176920.1732764443858.996723555616158.9967235556161-0.534919632990331
2465006441.9642884034558.035711596545758.0357115965458-0.314690145587853


Structural Time Series Model -- Extrapolation
tObservedLevelSeasonal
14846.912275583595977.18386698005-1130.27159139646
25034.419716439546135.94161722862-1101.52190078907
34805.250598431616294.69936747719-1489.44876904558
45096.896275570766453.45711772576-1356.560842155
57492.691666256486612.21486797433880.476798282149
68503.086830976586770.97261822291732.11421275368
78305.159989956226929.730368471471375.42962148475
89086.420717025337088.488118720041997.93259830529
96951.02855065427247.24586896861-296.217318314416
106055.217284061987406.00361921718-1350.7863351552
117492.730586851537564.76136946576-72.0307826142213
128534.403428358417723.51911971433810.884308644081

\begin{tabular}{lllllllll}
\hline
Structural Time Series Model -- Extrapolation \tabularnewline
t & Observed & Level & Seasonal \tabularnewline
1 & 4846.91227558359 & 5977.18386698005 & -1130.27159139646 \tabularnewline
2 & 5034.41971643954 & 6135.94161722862 & -1101.52190078907 \tabularnewline
3 & 4805.25059843161 & 6294.69936747719 & -1489.44876904558 \tabularnewline
4 & 5096.89627557076 & 6453.45711772576 & -1356.560842155 \tabularnewline
5 & 7492.69166625648 & 6612.21486797433 & 880.476798282149 \tabularnewline
6 & 8503.08683097658 & 6770.9726182229 & 1732.11421275368 \tabularnewline
7 & 8305.15998995622 & 6929.73036847147 & 1375.42962148475 \tabularnewline
8 & 9086.42071702533 & 7088.48811872004 & 1997.93259830529 \tabularnewline
9 & 6951.0285506542 & 7247.24586896861 & -296.217318314416 \tabularnewline
10 & 6055.21728406198 & 7406.00361921718 & -1350.7863351552 \tabularnewline
11 & 7492.73058685153 & 7564.76136946576 & -72.0307826142213 \tabularnewline
12 & 8534.40342835841 & 7723.51911971433 & 810.884308644081 \tabularnewline
\hline
\end{tabular}
%Source: https://freestatistics.org/blog/index.php?pk=299641&T=2

[TABLE]
[ROW][C]Structural Time Series Model -- Extrapolation[/C][/ROW]
[ROW][C]t[/C][C]Observed[/C][C]Level[/C][C]Seasonal[/C][/ROW]
[ROW][C]1[/C][C]4846.91227558359[/C][C]5977.18386698005[/C][C]-1130.27159139646[/C][/ROW]
[ROW][C]2[/C][C]5034.41971643954[/C][C]6135.94161722862[/C][C]-1101.52190078907[/C][/ROW]
[ROW][C]3[/C][C]4805.25059843161[/C][C]6294.69936747719[/C][C]-1489.44876904558[/C][/ROW]
[ROW][C]4[/C][C]5096.89627557076[/C][C]6453.45711772576[/C][C]-1356.560842155[/C][/ROW]
[ROW][C]5[/C][C]7492.69166625648[/C][C]6612.21486797433[/C][C]880.476798282149[/C][/ROW]
[ROW][C]6[/C][C]8503.08683097658[/C][C]6770.9726182229[/C][C]1732.11421275368[/C][/ROW]
[ROW][C]7[/C][C]8305.15998995622[/C][C]6929.73036847147[/C][C]1375.42962148475[/C][/ROW]
[ROW][C]8[/C][C]9086.42071702533[/C][C]7088.48811872004[/C][C]1997.93259830529[/C][/ROW]
[ROW][C]9[/C][C]6951.0285506542[/C][C]7247.24586896861[/C][C]-296.217318314416[/C][/ROW]
[ROW][C]10[/C][C]6055.21728406198[/C][C]7406.00361921718[/C][C]-1350.7863351552[/C][/ROW]
[ROW][C]11[/C][C]7492.73058685153[/C][C]7564.76136946576[/C][C]-72.0307826142213[/C][/ROW]
[ROW][C]12[/C][C]8534.40342835841[/C][C]7723.51911971433[/C][C]810.884308644081[/C][/ROW]
[/TABLE]
Source: https://freestatistics.org/blog/index.php?pk=299641&T=2

Globally Unique Identifier (entire table): ba.freestatistics.org/blog/index.php?pk=299641&T=2

As an alternative you can also use a QR Code:  

The GUIDs for individual cells are displayed in the table below:

Structural Time Series Model -- Extrapolation
tObservedLevelSeasonal
14846.912275583595977.18386698005-1130.27159139646
25034.419716439546135.94161722862-1101.52190078907
34805.250598431616294.69936747719-1489.44876904558
45096.896275570766453.45711772576-1356.560842155
57492.691666256486612.21486797433880.476798282149
68503.086830976586770.97261822291732.11421275368
78305.159989956226929.730368471471375.42962148475
89086.420717025337088.488118720041997.93259830529
96951.02855065427247.24586896861-296.217318314416
106055.217284061987406.00361921718-1350.7863351552
117492.730586851537564.76136946576-72.0307826142213
128534.403428358417723.51911971433810.884308644081


Parameters (Session):
par1 = 12 ; par2 = 12 ; par3 = BFGS ;
Parameters (R input):
par1 = 12 ; par2 = 12 ; par3 = BFGS ;
R code (references can be found in the software module):
require('stsm')
require('stsm.class')
require('KFKSDS')
par1 <- as.numeric(par1)
par2 <- as.numeric(par2)
nx <- length(x)
x <- ts(x,frequency=par1)
m <- StructTS(x,type='BSM')
print(m$coef)
print(m$fitted)
print(m$resid)
mylevel <- as.numeric(m$fitted[,'level'])
myslope <- as.numeric(m$fitted[,'slope'])
myseas <- as.numeric(m$fitted[,'sea'])
myresid <- as.numeric(m$resid)
myfit <- mylevel+myseas
mm <- stsm.model(model = 'BSM', y = x, transPars = 'StructTS')
fit2 <- stsmFit(mm, stsm.method = 'maxlik.td.optim', method = par3, KF.args = list(P0cov = TRUE))
(fit2.comps <- tsSmooth(fit2, P0cov = FALSE)$states)
m2 <- set.pars(mm, pmax(fit2$par, .Machine$double.eps))
(ss <- char2numeric(m2))
(pred <- predict(ss, x, n.ahead = par2))
mylagmax <- nx/2
bitmap(file='test2.png')
op <- par(mfrow = c(2,2))
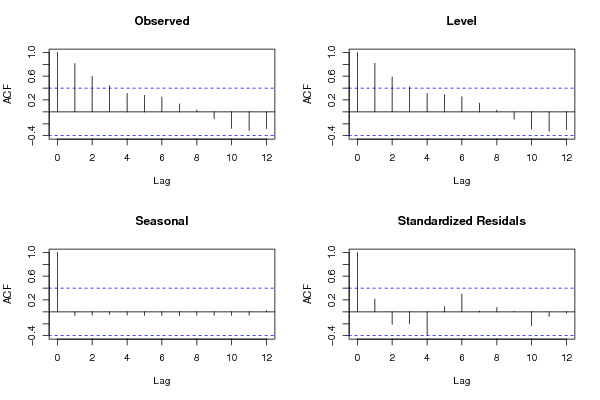
acf(as.numeric(x),lag.max = mylagmax,main='Observed')
acf(mylevel,na.action=na.pass,lag.max = mylagmax,main='Level')
acf(myseas,na.action=na.pass,lag.max = mylagmax,main='Seasonal')
acf(myresid,na.action=na.pass,lag.max = mylagmax,main='Standardized Residals')
par(op)
dev.off()
bitmap(file='test3.png')
op <- par(mfrow = c(2,2))
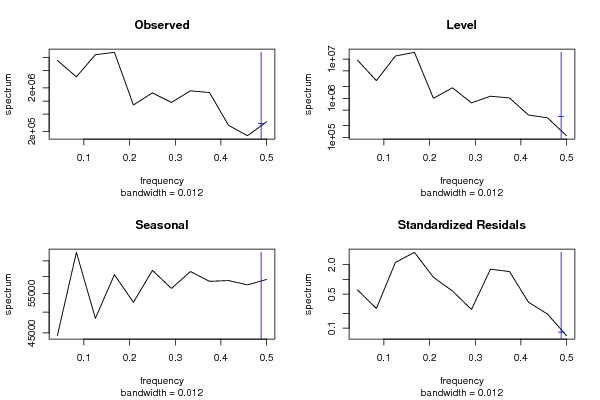
spectrum(as.numeric(x),main='Observed')
spectrum(mylevel,main='Level')
spectrum(myseas,main='Seasonal')
spectrum(myresid,main='Standardized Residals')
par(op)
dev.off()
bitmap(file='test4.png')
op <- par(mfrow = c(2,2))
cpgram(as.numeric(x),main='Observed')
cpgram(mylevel,main='Level')
cpgram(myseas,main='Seasonal')
cpgram(myresid,main='Standardized Residals')
par(op)
dev.off()
bitmap(file='test1.png')
plot(as.numeric(m$resid),main='Standardized Residuals',ylab='Residuals',xlab='time',type='b')
grid()
dev.off()
bitmap(file='test5.png')
op <- par(mfrow = c(2,2))
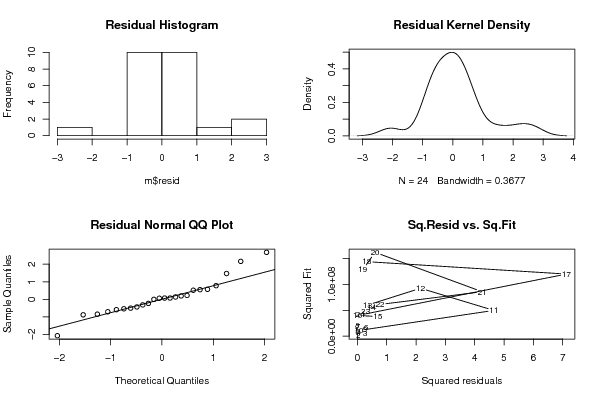
hist(m$resid,main='Residual Histogram')
plot(density(m$resid),main='Residual Kernel Density')
qqnorm(m$resid,main='Residual Normal QQ Plot')
qqline(m$resid)
plot(m$resid^2, myfit^2,main='Sq.Resid vs. Sq.Fit',xlab='Squared residuals',ylab='Squared Fit')
par(op)
dev.off()
bitmap(file='test6.png')
par(mfrow = c(3,1), mar = c(3,3,3,3))
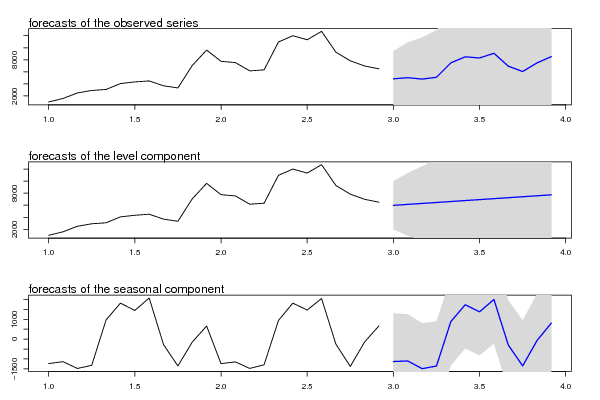
plot(cbind(x, pred$pred), type = 'n', plot.type = 'single', ylab = '')
lines(x)
polygon(c(time(pred$pred), rev(time(pred$pred))), c(pred$pred + 2 * pred$se, rev(pred$pred)), col = 'gray85', border = NA)
polygon(c(time(pred$pred), rev(time(pred$pred))), c(pred$pred - 2 * pred$se, rev(pred$pred)), col = ' gray85', border = NA)
lines(pred$pred, col = 'blue', lwd = 1.5)
mtext(text = 'forecasts of the observed series', side = 3, adj = 0)
plot(cbind(x, pred$a[,1]), type = 'n', plot.type = 'single', ylab = '')
lines(x)
polygon(c(time(pred$a[,1]), rev(time(pred$a[,1]))), c(pred$a[,1] + 2 * sqrt(pred$P[,1]), rev(pred$a[,1])), col = 'gray85', border = NA)
polygon(c(time(pred$a[,1]), rev(time(pred$a[,1]))), c(pred$a[,1] - 2 * sqrt(pred$P[,1]), rev(pred$a[,1])), col = ' gray85', border = NA)
lines(pred$a[,1], col = 'blue', lwd = 1.5)
mtext(text = 'forecasts of the level component', side = 3, adj = 0)
plot(cbind(fit2.comps[,3], pred$a[,3]), type = 'n', plot.type = 'single', ylab = '')
lines(fit2.comps[,3])
polygon(c(time(pred$a[,3]), rev(time(pred$a[,3]))), c(pred$a[,3] + 2 * sqrt(pred$P[,3]), rev(pred$a[,3])), col = 'gray85', border = NA)
polygon(c(time(pred$a[,3]), rev(time(pred$a[,3]))), c(pred$a[,3] - 2 * sqrt(pred$P[,3]), rev(pred$a[,3])), col = ' gray85', border = NA)
lines(pred$a[,3], col = 'blue', lwd = 1.5)
mtext(text = 'forecasts of the seasonal component', side = 3, adj = 0)
dev.off()
load(file='createtable')
a<-table.start()
a<-table.row.start(a)
a<-table.element(a,'Structural Time Series Model -- Interpolation',6,TRUE)
a<-table.row.end(a)
a<-table.row.start(a)
a<-table.element(a,'t',header=TRUE)
a<-table.element(a,'Observed',header=TRUE)
a<-table.element(a,'Level',header=TRUE)
a<-table.element(a,'Slope',header=TRUE)
a<-table.element(a,'Seasonal',header=TRUE)
a<-table.element(a,'Stand. Residuals',header=TRUE)
a<-table.row.end(a)
for (i in 1:nx) {
a<-table.row.start(a)
a<-table.element(a,i,header=TRUE)
a<-table.element(a,x[i])
a<-table.element(a,mylevel[i])
a<-table.element(a,myslope[i])
a<-table.element(a,myseas[i])
a<-table.element(a,myresid[i])
a<-table.row.end(a)
}
a<-table.end(a)
table.save(a,file='mytable.tab')
a<-table.start()
a<-table.row.start(a)
a<-table.element(a,'Structural Time Series Model -- Extrapolation',4,TRUE)
a<-table.row.end(a)
a<-table.row.start(a)
a<-table.element(a,'t',header=TRUE)
a<-table.element(a,'Observed',header=TRUE)
a<-table.element(a,'Level',header=TRUE)
a<-table.element(a,'Seasonal',header=TRUE)
a<-table.row.end(a)
for (i in 1:par2) {
a<-table.row.start(a)
a<-table.element(a,i,header=TRUE)
a<-table.element(a,pred$pred[i])
a<-table.element(a,pred$a[i,1])
a<-table.element(a,pred$a[i,3])
a<-table.row.end(a)
}
a<-table.end(a)
table.save(a,file='mytable1.tab')