Free Statistics

of Irreproducible Research!

Author's title

Author*The author of this computation has been verified*
R Software Modulerwasp_exponentialsmoothing.wasp
Title produced by softwareExponential Smoothing
Date of computationWed, 14 Dec 2016 18:11:40 +0100
Cite this page as followsStatistical Computations at FreeStatistics.org, Office for Research Development and Education, URL https://freestatistics.org/blog/index.php?v=date/2016/Dec/14/t14817355071lpn69ks0pvilze.htm/, Retrieved Fri, 03 May 2024 17:43:14 +0000
Statistical Computations at FreeStatistics.org, Office for Research Development and Education, URL https://freestatistics.org/blog/index.php?pk=299642, Retrieved Fri, 03 May 2024 17:43:14 +0000
QR Codes:

Original text written by user:
IsPrivate?No (this computation is public)
User-defined keywords
Estimated Impact56
Family? (F = Feedback message, R = changed R code, M = changed R Module, P = changed Parameters, D = changed Data)
-       [Exponential Smoothing] [] [2016-12-14 17:11:40] [130d73899007e5ff8a4f636b9bcfb397] [Current]
Feedback Forum

Post a new message
Dataseries X:
1000
1583.33
2500
2916.67
3083.33
4062.5
4333.33
4500
3687.5
3333.33
7062.5
9625
7750
7541.67
6166.67
6333.33
10958.33
12000
11333.33
12729.17
9270.83
7833.33
6979.17
6500


Summary of computational transaction
Raw Input view raw input (R code)
Raw Outputview raw output of R engine
Computing time1 seconds
R ServerBig Analytics Cloud Computing Center

\begin{tabular}{lllllllll}
\hline
Summary of computational transaction \tabularnewline
Raw Input view raw input (R code)  \tabularnewline
Raw Outputview raw output of R engine  \tabularnewline
Computing time1 seconds \tabularnewline
R ServerBig Analytics Cloud Computing Center \tabularnewline
\hline
\end{tabular}
%Source: https://freestatistics.org/blog/index.php?pk=299642&T=0

[TABLE]
[ROW]
Summary of computational transaction[/C][/ROW] [ROW]Raw Input[/C] view raw input (R code) [/C][/ROW] [ROW]Raw Output[/C]view raw output of R engine [/C][/ROW] [ROW]Computing time[/C]1 seconds[/C][/ROW] [ROW]R Server[/C]Big Analytics Cloud Computing Center[/C][/ROW] [/TABLE] Source: https://freestatistics.org/blog/index.php?pk=299642&T=0

Globally Unique Identifier (entire table): ba.freestatistics.org/blog/index.php?pk=299642&T=0

As an alternative you can also use a QR Code:  

The GUIDs for individual cells are displayed in the table below:

Summary of computational transaction
Raw Input view raw input (R code)
Raw Outputview raw output of R engine
Computing time1 seconds
R ServerBig Analytics Cloud Computing Center


Estimated Parameters of Exponential Smoothing
ParameterValue
alpha0.999951286831351
betaFALSE
gammaFALSE

\begin{tabular}{lllllllll}
\hline
Estimated Parameters of Exponential Smoothing \tabularnewline
Parameter & Value \tabularnewline
alpha & 0.999951286831351 \tabularnewline
beta & FALSE \tabularnewline
gamma & FALSE \tabularnewline
\hline
\end{tabular}
%Source: https://freestatistics.org/blog/index.php?pk=299642&T=1

[TABLE]
[ROW][C]Estimated Parameters of Exponential Smoothing[/C][/ROW]
[ROW][C]Parameter[/C][C]Value[/C][/ROW]
[ROW][C]alpha[/C][C]0.999951286831351[/C][/ROW]
[ROW][C]beta[/C][C]FALSE[/C][/ROW]
[ROW][C]gamma[/C][C]FALSE[/C][/ROW]
[/TABLE]
Source: https://freestatistics.org/blog/index.php?pk=299642&T=1

Globally Unique Identifier (entire table): ba.freestatistics.org/blog/index.php?pk=299642&T=1

As an alternative you can also use a QR Code:  

The GUIDs for individual cells are displayed in the table below:

Estimated Parameters of Exponential Smoothing
ParameterValue
alpha0.999951286831351
betaFALSE
gammaFALSE


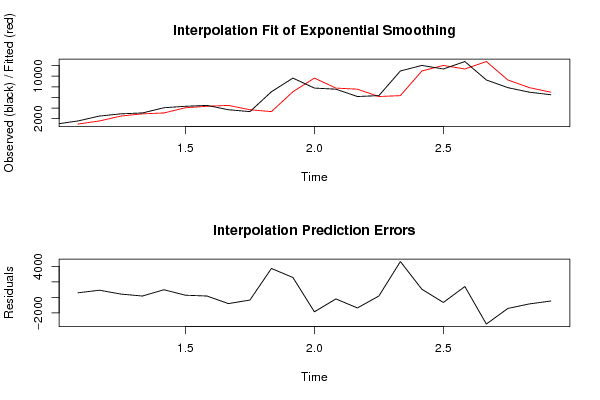
Interpolation Forecasts of Exponential Smoothing
tObservedFittedResiduals
21583.331000583.33
325001583.30158414733916.698415852668
42916.672499.95534471547416.714655284532
53083.332916.64970050872166.680299491281
64062.53083.32188047446979.17811952554
74333.334062.45230113113270.877698868874
845004333.31680468897166.683195311029
93687.54499.9918803334-812.491880333396
103333.333687.53957905399-354.209579053992
117062.53333.347254670963729.15274532904
1296257062.31834115342562.6816588466
1377509624.87516365616-1874.87516365616
147541.677750.09133111004-208.421331110043
156166.677541.68015286345-1375.01015286345
166333.336166.73698110147166.593018898529
1710958.336333.321884726174625.00811527383
181200010958.10470119971041.89529880032
1911333.3311999.9492459786-666.619245978594
2012729.1711333.36247313581395.80752686425
219270.8312729.1020057925-3458.27200579254
227833.339270.99846338745-1437.66846338745
236979.177833.40003338632-854.230033386319
2465006979.21161225168-479.211612251682

\begin{tabular}{lllllllll}
\hline
Interpolation Forecasts of Exponential Smoothing \tabularnewline
t & Observed & Fitted & Residuals \tabularnewline
2 & 1583.33 & 1000 & 583.33 \tabularnewline
3 & 2500 & 1583.30158414733 & 916.698415852668 \tabularnewline
4 & 2916.67 & 2499.95534471547 & 416.714655284532 \tabularnewline
5 & 3083.33 & 2916.64970050872 & 166.680299491281 \tabularnewline
6 & 4062.5 & 3083.32188047446 & 979.17811952554 \tabularnewline
7 & 4333.33 & 4062.45230113113 & 270.877698868874 \tabularnewline
8 & 4500 & 4333.31680468897 & 166.683195311029 \tabularnewline
9 & 3687.5 & 4499.9918803334 & -812.491880333396 \tabularnewline
10 & 3333.33 & 3687.53957905399 & -354.209579053992 \tabularnewline
11 & 7062.5 & 3333.34725467096 & 3729.15274532904 \tabularnewline
12 & 9625 & 7062.3183411534 & 2562.6816588466 \tabularnewline
13 & 7750 & 9624.87516365616 & -1874.87516365616 \tabularnewline
14 & 7541.67 & 7750.09133111004 & -208.421331110043 \tabularnewline
15 & 6166.67 & 7541.68015286345 & -1375.01015286345 \tabularnewline
16 & 6333.33 & 6166.73698110147 & 166.593018898529 \tabularnewline
17 & 10958.33 & 6333.32188472617 & 4625.00811527383 \tabularnewline
18 & 12000 & 10958.1047011997 & 1041.89529880032 \tabularnewline
19 & 11333.33 & 11999.9492459786 & -666.619245978594 \tabularnewline
20 & 12729.17 & 11333.3624731358 & 1395.80752686425 \tabularnewline
21 & 9270.83 & 12729.1020057925 & -3458.27200579254 \tabularnewline
22 & 7833.33 & 9270.99846338745 & -1437.66846338745 \tabularnewline
23 & 6979.17 & 7833.40003338632 & -854.230033386319 \tabularnewline
24 & 6500 & 6979.21161225168 & -479.211612251682 \tabularnewline
\hline
\end{tabular}
%Source: https://freestatistics.org/blog/index.php?pk=299642&T=2

[TABLE]
[ROW][C]Interpolation Forecasts of Exponential Smoothing[/C][/ROW]
[ROW][C]t[/C][C]Observed[/C][C]Fitted[/C][C]Residuals[/C][/ROW]
[ROW][C]2[/C][C]1583.33[/C][C]1000[/C][C]583.33[/C][/ROW]
[ROW][C]3[/C][C]2500[/C][C]1583.30158414733[/C][C]916.698415852668[/C][/ROW]
[ROW][C]4[/C][C]2916.67[/C][C]2499.95534471547[/C][C]416.714655284532[/C][/ROW]
[ROW][C]5[/C][C]3083.33[/C][C]2916.64970050872[/C][C]166.680299491281[/C][/ROW]
[ROW][C]6[/C][C]4062.5[/C][C]3083.32188047446[/C][C]979.17811952554[/C][/ROW]
[ROW][C]7[/C][C]4333.33[/C][C]4062.45230113113[/C][C]270.877698868874[/C][/ROW]
[ROW][C]8[/C][C]4500[/C][C]4333.31680468897[/C][C]166.683195311029[/C][/ROW]
[ROW][C]9[/C][C]3687.5[/C][C]4499.9918803334[/C][C]-812.491880333396[/C][/ROW]
[ROW][C]10[/C][C]3333.33[/C][C]3687.53957905399[/C][C]-354.209579053992[/C][/ROW]
[ROW][C]11[/C][C]7062.5[/C][C]3333.34725467096[/C][C]3729.15274532904[/C][/ROW]
[ROW][C]12[/C][C]9625[/C][C]7062.3183411534[/C][C]2562.6816588466[/C][/ROW]
[ROW][C]13[/C][C]7750[/C][C]9624.87516365616[/C][C]-1874.87516365616[/C][/ROW]
[ROW][C]14[/C][C]7541.67[/C][C]7750.09133111004[/C][C]-208.421331110043[/C][/ROW]
[ROW][C]15[/C][C]6166.67[/C][C]7541.68015286345[/C][C]-1375.01015286345[/C][/ROW]
[ROW][C]16[/C][C]6333.33[/C][C]6166.73698110147[/C][C]166.593018898529[/C][/ROW]
[ROW][C]17[/C][C]10958.33[/C][C]6333.32188472617[/C][C]4625.00811527383[/C][/ROW]
[ROW][C]18[/C][C]12000[/C][C]10958.1047011997[/C][C]1041.89529880032[/C][/ROW]
[ROW][C]19[/C][C]11333.33[/C][C]11999.9492459786[/C][C]-666.619245978594[/C][/ROW]
[ROW][C]20[/C][C]12729.17[/C][C]11333.3624731358[/C][C]1395.80752686425[/C][/ROW]
[ROW][C]21[/C][C]9270.83[/C][C]12729.1020057925[/C][C]-3458.27200579254[/C][/ROW]
[ROW][C]22[/C][C]7833.33[/C][C]9270.99846338745[/C][C]-1437.66846338745[/C][/ROW]
[ROW][C]23[/C][C]6979.17[/C][C]7833.40003338632[/C][C]-854.230033386319[/C][/ROW]
[ROW][C]24[/C][C]6500[/C][C]6979.21161225168[/C][C]-479.211612251682[/C][/ROW]
[/TABLE]
Source: https://freestatistics.org/blog/index.php?pk=299642&T=2

Globally Unique Identifier (entire table): ba.freestatistics.org/blog/index.php?pk=299642&T=2

As an alternative you can also use a QR Code:  

The GUIDs for individual cells are displayed in the table below:

Interpolation Forecasts of Exponential Smoothing
tObservedFittedResiduals
21583.331000583.33
325001583.30158414733916.698415852668
42916.672499.95534471547416.714655284532
53083.332916.64970050872166.680299491281
64062.53083.32188047446979.17811952554
74333.334062.45230113113270.877698868874
845004333.31680468897166.683195311029
93687.54499.9918803334-812.491880333396
103333.333687.53957905399-354.209579053992
117062.53333.347254670963729.15274532904
1296257062.31834115342562.6816588466
1377509624.87516365616-1874.87516365616
147541.677750.09133111004-208.421331110043
156166.677541.68015286345-1375.01015286345
166333.336166.73698110147166.593018898529
1710958.336333.321884726174625.00811527383
181200010958.10470119971041.89529880032
1911333.3311999.9492459786-666.619245978594
2012729.1711333.36247313581395.80752686425
219270.8312729.1020057925-3458.27200579254
227833.339270.99846338745-1437.66846338745
236979.177833.40003338632-854.230033386319
2465006979.21161225168-479.211612251682


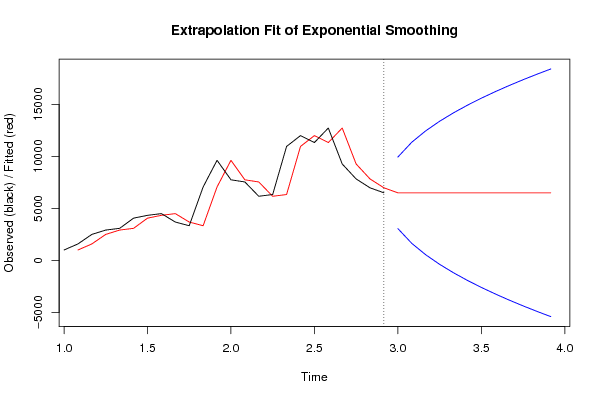
Extrapolation Forecasts of Exponential Smoothing
tForecast95% Lower Bound95% Upper Bound
256500.023343916093061.367818069569938.67886976261
266500.023343916091637.1485073981511362.898180434
276500.02334391609544.29068320642812455.7560046257
286500.02334391609-377.03644759715813377.0831354293
296500.02334391609-1188.7445174679914188.7912053002
306500.02334391609-1922.5861731194214922.6328609516
316500.02334391609-2597.4241512147115597.4708390469
326500.02334391609-3225.5486586381116225.5953464703
336500.02334391609-3815.4965473482616815.5432351804
346500.02334391609-4373.4834720690317373.5301599012
356500.02334391609-4904.2017646776317904.2484525098
366500.02334391609-5411.2969094262718411.3435972584

\begin{tabular}{lllllllll}
\hline
Extrapolation Forecasts of Exponential Smoothing \tabularnewline
t & Forecast & 95% Lower Bound & 95% Upper Bound \tabularnewline
25 & 6500.02334391609 & 3061.36781806956 & 9938.67886976261 \tabularnewline
26 & 6500.02334391609 & 1637.14850739815 & 11362.898180434 \tabularnewline
27 & 6500.02334391609 & 544.290683206428 & 12455.7560046257 \tabularnewline
28 & 6500.02334391609 & -377.036447597158 & 13377.0831354293 \tabularnewline
29 & 6500.02334391609 & -1188.74451746799 & 14188.7912053002 \tabularnewline
30 & 6500.02334391609 & -1922.58617311942 & 14922.6328609516 \tabularnewline
31 & 6500.02334391609 & -2597.42415121471 & 15597.4708390469 \tabularnewline
32 & 6500.02334391609 & -3225.54865863811 & 16225.5953464703 \tabularnewline
33 & 6500.02334391609 & -3815.49654734826 & 16815.5432351804 \tabularnewline
34 & 6500.02334391609 & -4373.48347206903 & 17373.5301599012 \tabularnewline
35 & 6500.02334391609 & -4904.20176467763 & 17904.2484525098 \tabularnewline
36 & 6500.02334391609 & -5411.29690942627 & 18411.3435972584 \tabularnewline
\hline
\end{tabular}
%Source: https://freestatistics.org/blog/index.php?pk=299642&T=3

[TABLE]
[ROW][C]Extrapolation Forecasts of Exponential Smoothing[/C][/ROW]
[ROW][C]t[/C][C]Forecast[/C][C]95% Lower Bound[/C][C]95% Upper Bound[/C][/ROW]
[ROW][C]25[/C][C]6500.02334391609[/C][C]3061.36781806956[/C][C]9938.67886976261[/C][/ROW]
[ROW][C]26[/C][C]6500.02334391609[/C][C]1637.14850739815[/C][C]11362.898180434[/C][/ROW]
[ROW][C]27[/C][C]6500.02334391609[/C][C]544.290683206428[/C][C]12455.7560046257[/C][/ROW]
[ROW][C]28[/C][C]6500.02334391609[/C][C]-377.036447597158[/C][C]13377.0831354293[/C][/ROW]
[ROW][C]29[/C][C]6500.02334391609[/C][C]-1188.74451746799[/C][C]14188.7912053002[/C][/ROW]
[ROW][C]30[/C][C]6500.02334391609[/C][C]-1922.58617311942[/C][C]14922.6328609516[/C][/ROW]
[ROW][C]31[/C][C]6500.02334391609[/C][C]-2597.42415121471[/C][C]15597.4708390469[/C][/ROW]
[ROW][C]32[/C][C]6500.02334391609[/C][C]-3225.54865863811[/C][C]16225.5953464703[/C][/ROW]
[ROW][C]33[/C][C]6500.02334391609[/C][C]-3815.49654734826[/C][C]16815.5432351804[/C][/ROW]
[ROW][C]34[/C][C]6500.02334391609[/C][C]-4373.48347206903[/C][C]17373.5301599012[/C][/ROW]
[ROW][C]35[/C][C]6500.02334391609[/C][C]-4904.20176467763[/C][C]17904.2484525098[/C][/ROW]
[ROW][C]36[/C][C]6500.02334391609[/C][C]-5411.29690942627[/C][C]18411.3435972584[/C][/ROW]
[/TABLE]
Source: https://freestatistics.org/blog/index.php?pk=299642&T=3

Globally Unique Identifier (entire table): ba.freestatistics.org/blog/index.php?pk=299642&T=3

As an alternative you can also use a QR Code:  

The GUIDs for individual cells are displayed in the table below:

Extrapolation Forecasts of Exponential Smoothing
tForecast95% Lower Bound95% Upper Bound
256500.023343916093061.367818069569938.67886976261
266500.023343916091637.1485073981511362.898180434
276500.02334391609544.29068320642812455.7560046257
286500.02334391609-377.03644759715813377.0831354293
296500.02334391609-1188.7445174679914188.7912053002
306500.02334391609-1922.5861731194214922.6328609516
316500.02334391609-2597.4241512147115597.4708390469
326500.02334391609-3225.5486586381116225.5953464703
336500.02334391609-3815.4965473482616815.5432351804
346500.02334391609-4373.4834720690317373.5301599012
356500.02334391609-4904.2017646776317904.2484525098
366500.02334391609-5411.2969094262718411.3435972584


Parameters (Session):
par1 = 12 ; par2 = 12 ; par3 = BFGS ;
Parameters (R input):
par1 = 12 ; par2 = Single ; par3 = additive ; par4 = 12 ;
R code (references can be found in the software module):
par1 <- as.numeric(par1)
par4 <- as.numeric(par4)
if (par2 == 'Single') K <- 1
if (par2 == 'Double') K <- 2
if (par2 == 'Triple') K <- par1
nx <- length(x)
nxmK <- nx - K
x <- ts(x, frequency = par1)
if (par2 == 'Single') fit <- HoltWinters(x, gamma=F, beta=F)
if (par2 == 'Double') fit <- HoltWinters(x, gamma=F)
if (par2 == 'Triple') fit <- HoltWinters(x, seasonal=par3)
fit
myresid <- x - fit$fitted[,'xhat']
bitmap(file='test1.png')
op <- par(mfrow=c(2,1))
plot(fit,ylab='Observed (black) / Fitted (red)',main='Interpolation Fit of Exponential Smoothing')
plot(myresid,ylab='Residuals',main='Interpolation Prediction Errors')
par(op)
dev.off()
bitmap(file='test2.png')
p <- predict(fit, par4, prediction.interval=TRUE)
np <- length(p[,1])
plot(fit,p,ylab='Observed (black) / Fitted (red)',main='Extrapolation Fit of Exponential Smoothing')
dev.off()
bitmap(file='test3.png')
op <- par(mfrow = c(2,2))
acf(as.numeric(myresid),lag.max = nx/2,main='Residual ACF')
spectrum(myresid,main='Residals Periodogram')
cpgram(myresid,main='Residal Cumulative Periodogram')
qqnorm(myresid,main='Residual Normal QQ Plot')
qqline(myresid)
par(op)
dev.off()
load(file='createtable')
a<-table.start()
a<-table.row.start(a)
a<-table.element(a,'Estimated Parameters of Exponential Smoothing',2,TRUE)
a<-table.row.end(a)
a<-table.row.start(a)
a<-table.element(a,'Parameter',header=TRUE)
a<-table.element(a,'Value',header=TRUE)
a<-table.row.end(a)
a<-table.row.start(a)
a<-table.element(a,'alpha',header=TRUE)
a<-table.element(a,fit$alpha)
a<-table.row.end(a)
a<-table.row.start(a)
a<-table.element(a,'beta',header=TRUE)
a<-table.element(a,fit$beta)
a<-table.row.end(a)
a<-table.row.start(a)
a<-table.element(a,'gamma',header=TRUE)
a<-table.element(a,fit$gamma)
a<-table.row.end(a)
a<-table.end(a)
table.save(a,file='mytable.tab')
a<-table.start()
a<-table.row.start(a)
a<-table.element(a,'Interpolation Forecasts of Exponential Smoothing',4,TRUE)
a<-table.row.end(a)
a<-table.row.start(a)
a<-table.element(a,'t',header=TRUE)
a<-table.element(a,'Observed',header=TRUE)
a<-table.element(a,'Fitted',header=TRUE)
a<-table.element(a,'Residuals',header=TRUE)
a<-table.row.end(a)
for (i in 1:nxmK) {
a<-table.row.start(a)
a<-table.element(a,i+K,header=TRUE)
a<-table.element(a,x[i+K])
a<-table.element(a,fit$fitted[i,'xhat'])
a<-table.element(a,myresid[i])
a<-table.row.end(a)
}
a<-table.end(a)
table.save(a,file='mytable1.tab')
a<-table.start()
a<-table.row.start(a)
a<-table.element(a,'Extrapolation Forecasts of Exponential Smoothing',4,TRUE)
a<-table.row.end(a)
a<-table.row.start(a)
a<-table.element(a,'t',header=TRUE)
a<-table.element(a,'Forecast',header=TRUE)
a<-table.element(a,'95% Lower Bound',header=TRUE)
a<-table.element(a,'95% Upper Bound',header=TRUE)
a<-table.row.end(a)
for (i in 1:np) {
a<-table.row.start(a)
a<-table.element(a,nx+i,header=TRUE)
a<-table.element(a,p[i,'fit'])
a<-table.element(a,p[i,'lwr'])
a<-table.element(a,p[i,'upr'])
a<-table.row.end(a)
}
a<-table.end(a)
table.save(a,file='mytable2.tab')