Free Statistics

of Irreproducible Research!

Author's title

Author*The author of this computation has been verified*
R Software Modulerwasp_structuraltimeseries.wasp
Title produced by softwareStructural Time Series Models
Date of computationWed, 14 Dec 2016 18:14:00 +0100
Cite this page as followsStatistical Computations at FreeStatistics.org, Office for Research Development and Education, URL https://freestatistics.org/blog/index.php?v=date/2016/Dec/14/t1481735652jrabfb0re66cf3u.htm/, Retrieved Fri, 03 May 2024 22:34:53 +0000
Statistical Computations at FreeStatistics.org, Office for Research Development and Education, URL https://freestatistics.org/blog/index.php?pk=299644, Retrieved Fri, 03 May 2024 22:34:53 +0000
QR Codes:

Original text written by user:
IsPrivate?No (this computation is public)
User-defined keywords
Estimated Impact61
Family? (F = Feedback message, R = changed R code, M = changed R Module, P = changed Parameters, D = changed Data)
-       [Structural Time Series Models] [] [2016-12-14 17:14:00] [130d73899007e5ff8a4f636b9bcfb397] [Current]
Feedback Forum

Post a new message
Dataseries X:
6155
6490
6285
6450
6240
6375
6100
5600
5505
5155
4720
4645
5210
5580
5830
6395
7265
7460
6790
6810
7040
7385
7170
6620
6485
6035
6165
6320
6430
6785
6895
8030
8115
8915
9630
9250
9535
8320
7070
6375
6535
6480
6925
7020


Summary of computational transaction
Raw Input view raw input (R code)
Raw Outputview raw output of R engine
Computing time4 seconds
R ServerBig Analytics Cloud Computing Center

\begin{tabular}{lllllllll}
\hline
Summary of computational transaction \tabularnewline
Raw Input view raw input (R code)  \tabularnewline
Raw Outputview raw output of R engine  \tabularnewline
Computing time4 seconds \tabularnewline
R ServerBig Analytics Cloud Computing Center \tabularnewline
\hline
\end{tabular}
%Source: https://freestatistics.org/blog/index.php?pk=299644&T=0

[TABLE]
[ROW]
Summary of computational transaction[/C][/ROW] [ROW]Raw Input[/C] view raw input (R code) [/C][/ROW] [ROW]Raw Output[/C]view raw output of R engine [/C][/ROW] [ROW]Computing time[/C]4 seconds[/C][/ROW] [ROW]R Server[/C]Big Analytics Cloud Computing Center[/C][/ROW] [/TABLE] Source: https://freestatistics.org/blog/index.php?pk=299644&T=0

Globally Unique Identifier (entire table): ba.freestatistics.org/blog/index.php?pk=299644&T=0

As an alternative you can also use a QR Code:  

The GUIDs for individual cells are displayed in the table below:

Summary of computational transaction
Raw Input view raw input (R code)
Raw Outputview raw output of R engine
Computing time4 seconds
R ServerBig Analytics Cloud Computing Center


Structural Time Series Model -- Interpolation
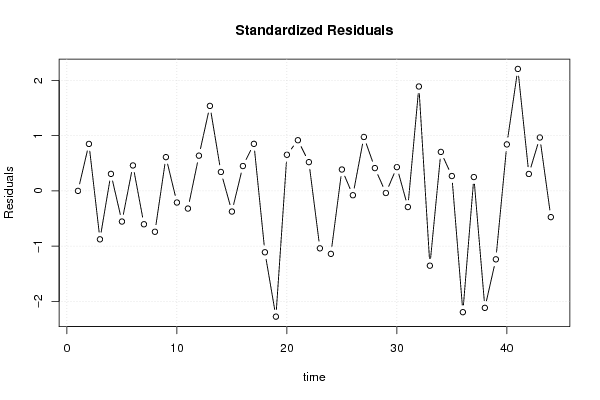
tObservedLevelSlopeSeasonalStand. Residuals
161556155000
264906433.84608069111273.6548767837253.148602838538030.849323802329996
362856327.42489808753-30.79602465377931.99256266174148-0.87544761137837
464506430.5836428946177.42136555877733.861352373556170.307499460131767
562406265.37855934708-119.1641420906192.5195221796839-0.55428508482013
663756347.7817930766644.20089539046384.053804229754770.46044782608267
761006127.94671936491-169.8003192689892.39768913703203-0.603168269625704
856005634.59774233941-432.027439560412.58445859743279-0.739088869111162
955055469.98965715683-215.2954148451634.279109646361780.610860220505802
1051555162.74520615339-289.8159954289822.82134178500651-0.210036604341359
1147204733.10354830814-403.1385326336892.96487202487473-0.319400098484637
1246454608.78872808947-177.1640677537384.16951949972150.636910080253033
1352105062.04351478643325.5021340997376.68154422344661.53649255043109
1455805567.27565339756453.291384969809-1.862683430870150.342215473951813
1558305855.58234361748319.041693329751-6.93138456749394-0.373479749557358
1663956373.62234949231479.697683263444-1.076854657093340.44998418826357
1772657227.03078336456781.659238325679-4.657587293905380.850884848620534
1874607522.05244175305388.074525932339-6.46057340100734-1.10931989912526
1967906912.66106043634-418.725501916425-8.70571749057161-2.27395501055746
2068106780.57356742584-186.89111456986-3.318992170565130.653425982353667
2170406995.75125913826138.29542247293-1.682244267548710.916539773254277
2273857362.30454278315322.90610092134-3.379885273978640.520326056850824
2371707229.75764398956-45.4573186332935-7.7281374260077-1.03823404533421
2466206684.85697819632-449.370109679508-7.80633680651633-1.1384321517243
2564856398.46026599122-318.77141954742368.0819678668830.386574008510511
2660356040.95898182328-347.410799223938-2.44154620149738-0.0782383911872485
2761656123.88144565391.3585020696454-7.464140478841470.974934359609076
2863206307.81907878076148.546426859231-8.37063862864720.412903929881352
2964306439.69007338581135.095905568898-7.79802436766856-0.0379034122838326
3067856763.76333229445287.637911332425-0.2305356632542970.429940313625951
3168956923.32917934855184.251874304585-13.7798032974727-0.291392520588694
3280307937.32381042465854.032654739953-1.581843692513941.88777951898003
3381158196.86869302274374.163001476519-14.3367384926365-1.35251485905369
3489158880.770841977624.184353578442-0.9562944441599850.704686366246188
3596309623.32248181764719.730969539854-6.768738262784920.269298631435421
3692509378.97962452995-58.3544161539422-19.4802298459485-2.19306144024579
3795359427.695132159927.562183842549495.19884497114880.250598390984718
3883208439.29307293523-739.493342080749-21.6736927361579-2.11492322724311
3970707153.66039205154-1180.7796691119-22.1702750634692-1.23703104295199
4063756345.04914800519-881.208526912484-11.79685890158240.841074680684993
4165356435.66780043704-98.6616364319648-10.38314030911312.20524940730255
4264806471.84850999329.98494706806767-7.087116997666660.30622097667026
4369256906.97651802676352.555175783336-30.0245346845390.965531272002148
4470207050.75251511517184.331873557305-7.15779077434521-0.474137995171031

\begin{tabular}{lllllllll}
\hline
Structural Time Series Model -- Interpolation \tabularnewline
t & Observed & Level & Slope & Seasonal & Stand. Residuals \tabularnewline
1 & 6155 & 6155 & 0 & 0 & 0 \tabularnewline
2 & 6490 & 6433.84608069111 & 273.654876783725 & 3.14860283853803 & 0.849323802329996 \tabularnewline
3 & 6285 & 6327.42489808753 & -30.7960246537793 & 1.99256266174148 & -0.87544761137837 \tabularnewline
4 & 6450 & 6430.58364289461 & 77.4213655587773 & 3.86135237355617 & 0.307499460131767 \tabularnewline
5 & 6240 & 6265.37855934708 & -119.164142090619 & 2.5195221796839 & -0.55428508482013 \tabularnewline
6 & 6375 & 6347.78179307666 & 44.2008953904638 & 4.05380422975477 & 0.46044782608267 \tabularnewline
7 & 6100 & 6127.94671936491 & -169.800319268989 & 2.39768913703203 & -0.603168269625704 \tabularnewline
8 & 5600 & 5634.59774233941 & -432.02743956041 & 2.58445859743279 & -0.739088869111162 \tabularnewline
9 & 5505 & 5469.98965715683 & -215.295414845163 & 4.27910964636178 & 0.610860220505802 \tabularnewline
10 & 5155 & 5162.74520615339 & -289.815995428982 & 2.82134178500651 & -0.210036604341359 \tabularnewline
11 & 4720 & 4733.10354830814 & -403.138532633689 & 2.96487202487473 & -0.319400098484637 \tabularnewline
12 & 4645 & 4608.78872808947 & -177.164067753738 & 4.1695194997215 & 0.636910080253033 \tabularnewline
13 & 5210 & 5062.04351478643 & 325.50213409973 & 76.6815442234466 & 1.53649255043109 \tabularnewline
14 & 5580 & 5567.27565339756 & 453.291384969809 & -1.86268343087015 & 0.342215473951813 \tabularnewline
15 & 5830 & 5855.58234361748 & 319.041693329751 & -6.93138456749394 & -0.373479749557358 \tabularnewline
16 & 6395 & 6373.62234949231 & 479.697683263444 & -1.07685465709334 & 0.44998418826357 \tabularnewline
17 & 7265 & 7227.03078336456 & 781.659238325679 & -4.65758729390538 & 0.850884848620534 \tabularnewline
18 & 7460 & 7522.05244175305 & 388.074525932339 & -6.46057340100734 & -1.10931989912526 \tabularnewline
19 & 6790 & 6912.66106043634 & -418.725501916425 & -8.70571749057161 & -2.27395501055746 \tabularnewline
20 & 6810 & 6780.57356742584 & -186.89111456986 & -3.31899217056513 & 0.653425982353667 \tabularnewline
21 & 7040 & 6995.75125913826 & 138.29542247293 & -1.68224426754871 & 0.916539773254277 \tabularnewline
22 & 7385 & 7362.30454278315 & 322.90610092134 & -3.37988527397864 & 0.520326056850824 \tabularnewline
23 & 7170 & 7229.75764398956 & -45.4573186332935 & -7.7281374260077 & -1.03823404533421 \tabularnewline
24 & 6620 & 6684.85697819632 & -449.370109679508 & -7.80633680651633 & -1.1384321517243 \tabularnewline
25 & 6485 & 6398.46026599122 & -318.771419547423 & 68.081967866883 & 0.386574008510511 \tabularnewline
26 & 6035 & 6040.95898182328 & -347.410799223938 & -2.44154620149738 & -0.0782383911872485 \tabularnewline
27 & 6165 & 6123.8814456539 & 1.3585020696454 & -7.46414047884147 & 0.974934359609076 \tabularnewline
28 & 6320 & 6307.81907878076 & 148.546426859231 & -8.3706386286472 & 0.412903929881352 \tabularnewline
29 & 6430 & 6439.69007338581 & 135.095905568898 & -7.79802436766856 & -0.0379034122838326 \tabularnewline
30 & 6785 & 6763.76333229445 & 287.637911332425 & -0.230535663254297 & 0.429940313625951 \tabularnewline
31 & 6895 & 6923.32917934855 & 184.251874304585 & -13.7798032974727 & -0.291392520588694 \tabularnewline
32 & 8030 & 7937.32381042465 & 854.032654739953 & -1.58184369251394 & 1.88777951898003 \tabularnewline
33 & 8115 & 8196.86869302274 & 374.163001476519 & -14.3367384926365 & -1.35251485905369 \tabularnewline
34 & 8915 & 8880.770841977 & 624.184353578442 & -0.956294444159985 & 0.704686366246188 \tabularnewline
35 & 9630 & 9623.32248181764 & 719.730969539854 & -6.76873826278492 & 0.269298631435421 \tabularnewline
36 & 9250 & 9378.97962452995 & -58.3544161539422 & -19.4802298459485 & -2.19306144024579 \tabularnewline
37 & 9535 & 9427.6951321599 & 27.5621838425494 & 95.1988449711488 & 0.250598390984718 \tabularnewline
38 & 8320 & 8439.29307293523 & -739.493342080749 & -21.6736927361579 & -2.11492322724311 \tabularnewline
39 & 7070 & 7153.66039205154 & -1180.7796691119 & -22.1702750634692 & -1.23703104295199 \tabularnewline
40 & 6375 & 6345.04914800519 & -881.208526912484 & -11.7968589015824 & 0.841074680684993 \tabularnewline
41 & 6535 & 6435.66780043704 & -98.6616364319648 & -10.3831403091131 & 2.20524940730255 \tabularnewline
42 & 6480 & 6471.8485099932 & 9.98494706806767 & -7.08711699766666 & 0.30622097667026 \tabularnewline
43 & 6925 & 6906.97651802676 & 352.555175783336 & -30.024534684539 & 0.965531272002148 \tabularnewline
44 & 7020 & 7050.75251511517 & 184.331873557305 & -7.15779077434521 & -0.474137995171031 \tabularnewline
\hline
\end{tabular}
%Source: https://freestatistics.org/blog/index.php?pk=299644&T=1

[TABLE]
[ROW][C]Structural Time Series Model -- Interpolation[/C][/ROW]
[ROW][C]t[/C][C]Observed[/C][C]Level[/C][C]Slope[/C][C]Seasonal[/C][C]Stand. Residuals[/C][/ROW]
[ROW][C]1[/C][C]6155[/C][C]6155[/C][C]0[/C][C]0[/C][C]0[/C][/ROW]
[ROW][C]2[/C][C]6490[/C][C]6433.84608069111[/C][C]273.654876783725[/C][C]3.14860283853803[/C][C]0.849323802329996[/C][/ROW]
[ROW][C]3[/C][C]6285[/C][C]6327.42489808753[/C][C]-30.7960246537793[/C][C]1.99256266174148[/C][C]-0.87544761137837[/C][/ROW]
[ROW][C]4[/C][C]6450[/C][C]6430.58364289461[/C][C]77.4213655587773[/C][C]3.86135237355617[/C][C]0.307499460131767[/C][/ROW]
[ROW][C]5[/C][C]6240[/C][C]6265.37855934708[/C][C]-119.164142090619[/C][C]2.5195221796839[/C][C]-0.55428508482013[/C][/ROW]
[ROW][C]6[/C][C]6375[/C][C]6347.78179307666[/C][C]44.2008953904638[/C][C]4.05380422975477[/C][C]0.46044782608267[/C][/ROW]
[ROW][C]7[/C][C]6100[/C][C]6127.94671936491[/C][C]-169.800319268989[/C][C]2.39768913703203[/C][C]-0.603168269625704[/C][/ROW]
[ROW][C]8[/C][C]5600[/C][C]5634.59774233941[/C][C]-432.02743956041[/C][C]2.58445859743279[/C][C]-0.739088869111162[/C][/ROW]
[ROW][C]9[/C][C]5505[/C][C]5469.98965715683[/C][C]-215.295414845163[/C][C]4.27910964636178[/C][C]0.610860220505802[/C][/ROW]
[ROW][C]10[/C][C]5155[/C][C]5162.74520615339[/C][C]-289.815995428982[/C][C]2.82134178500651[/C][C]-0.210036604341359[/C][/ROW]
[ROW][C]11[/C][C]4720[/C][C]4733.10354830814[/C][C]-403.138532633689[/C][C]2.96487202487473[/C][C]-0.319400098484637[/C][/ROW]
[ROW][C]12[/C][C]4645[/C][C]4608.78872808947[/C][C]-177.164067753738[/C][C]4.1695194997215[/C][C]0.636910080253033[/C][/ROW]
[ROW][C]13[/C][C]5210[/C][C]5062.04351478643[/C][C]325.50213409973[/C][C]76.6815442234466[/C][C]1.53649255043109[/C][/ROW]
[ROW][C]14[/C][C]5580[/C][C]5567.27565339756[/C][C]453.291384969809[/C][C]-1.86268343087015[/C][C]0.342215473951813[/C][/ROW]
[ROW][C]15[/C][C]5830[/C][C]5855.58234361748[/C][C]319.041693329751[/C][C]-6.93138456749394[/C][C]-0.373479749557358[/C][/ROW]
[ROW][C]16[/C][C]6395[/C][C]6373.62234949231[/C][C]479.697683263444[/C][C]-1.07685465709334[/C][C]0.44998418826357[/C][/ROW]
[ROW][C]17[/C][C]7265[/C][C]7227.03078336456[/C][C]781.659238325679[/C][C]-4.65758729390538[/C][C]0.850884848620534[/C][/ROW]
[ROW][C]18[/C][C]7460[/C][C]7522.05244175305[/C][C]388.074525932339[/C][C]-6.46057340100734[/C][C]-1.10931989912526[/C][/ROW]
[ROW][C]19[/C][C]6790[/C][C]6912.66106043634[/C][C]-418.725501916425[/C][C]-8.70571749057161[/C][C]-2.27395501055746[/C][/ROW]
[ROW][C]20[/C][C]6810[/C][C]6780.57356742584[/C][C]-186.89111456986[/C][C]-3.31899217056513[/C][C]0.653425982353667[/C][/ROW]
[ROW][C]21[/C][C]7040[/C][C]6995.75125913826[/C][C]138.29542247293[/C][C]-1.68224426754871[/C][C]0.916539773254277[/C][/ROW]
[ROW][C]22[/C][C]7385[/C][C]7362.30454278315[/C][C]322.90610092134[/C][C]-3.37988527397864[/C][C]0.520326056850824[/C][/ROW]
[ROW][C]23[/C][C]7170[/C][C]7229.75764398956[/C][C]-45.4573186332935[/C][C]-7.7281374260077[/C][C]-1.03823404533421[/C][/ROW]
[ROW][C]24[/C][C]6620[/C][C]6684.85697819632[/C][C]-449.370109679508[/C][C]-7.80633680651633[/C][C]-1.1384321517243[/C][/ROW]
[ROW][C]25[/C][C]6485[/C][C]6398.46026599122[/C][C]-318.771419547423[/C][C]68.081967866883[/C][C]0.386574008510511[/C][/ROW]
[ROW][C]26[/C][C]6035[/C][C]6040.95898182328[/C][C]-347.410799223938[/C][C]-2.44154620149738[/C][C]-0.0782383911872485[/C][/ROW]
[ROW][C]27[/C][C]6165[/C][C]6123.8814456539[/C][C]1.3585020696454[/C][C]-7.46414047884147[/C][C]0.974934359609076[/C][/ROW]
[ROW][C]28[/C][C]6320[/C][C]6307.81907878076[/C][C]148.546426859231[/C][C]-8.3706386286472[/C][C]0.412903929881352[/C][/ROW]
[ROW][C]29[/C][C]6430[/C][C]6439.69007338581[/C][C]135.095905568898[/C][C]-7.79802436766856[/C][C]-0.0379034122838326[/C][/ROW]
[ROW][C]30[/C][C]6785[/C][C]6763.76333229445[/C][C]287.637911332425[/C][C]-0.230535663254297[/C][C]0.429940313625951[/C][/ROW]
[ROW][C]31[/C][C]6895[/C][C]6923.32917934855[/C][C]184.251874304585[/C][C]-13.7798032974727[/C][C]-0.291392520588694[/C][/ROW]
[ROW][C]32[/C][C]8030[/C][C]7937.32381042465[/C][C]854.032654739953[/C][C]-1.58184369251394[/C][C]1.88777951898003[/C][/ROW]
[ROW][C]33[/C][C]8115[/C][C]8196.86869302274[/C][C]374.163001476519[/C][C]-14.3367384926365[/C][C]-1.35251485905369[/C][/ROW]
[ROW][C]34[/C][C]8915[/C][C]8880.770841977[/C][C]624.184353578442[/C][C]-0.956294444159985[/C][C]0.704686366246188[/C][/ROW]
[ROW][C]35[/C][C]9630[/C][C]9623.32248181764[/C][C]719.730969539854[/C][C]-6.76873826278492[/C][C]0.269298631435421[/C][/ROW]
[ROW][C]36[/C][C]9250[/C][C]9378.97962452995[/C][C]-58.3544161539422[/C][C]-19.4802298459485[/C][C]-2.19306144024579[/C][/ROW]
[ROW][C]37[/C][C]9535[/C][C]9427.6951321599[/C][C]27.5621838425494[/C][C]95.1988449711488[/C][C]0.250598390984718[/C][/ROW]
[ROW][C]38[/C][C]8320[/C][C]8439.29307293523[/C][C]-739.493342080749[/C][C]-21.6736927361579[/C][C]-2.11492322724311[/C][/ROW]
[ROW][C]39[/C][C]7070[/C][C]7153.66039205154[/C][C]-1180.7796691119[/C][C]-22.1702750634692[/C][C]-1.23703104295199[/C][/ROW]
[ROW][C]40[/C][C]6375[/C][C]6345.04914800519[/C][C]-881.208526912484[/C][C]-11.7968589015824[/C][C]0.841074680684993[/C][/ROW]
[ROW][C]41[/C][C]6535[/C][C]6435.66780043704[/C][C]-98.6616364319648[/C][C]-10.3831403091131[/C][C]2.20524940730255[/C][/ROW]
[ROW][C]42[/C][C]6480[/C][C]6471.8485099932[/C][C]9.98494706806767[/C][C]-7.08711699766666[/C][C]0.30622097667026[/C][/ROW]
[ROW][C]43[/C][C]6925[/C][C]6906.97651802676[/C][C]352.555175783336[/C][C]-30.024534684539[/C][C]0.965531272002148[/C][/ROW]
[ROW][C]44[/C][C]7020[/C][C]7050.75251511517[/C][C]184.331873557305[/C][C]-7.15779077434521[/C][C]-0.474137995171031[/C][/ROW]
[/TABLE]
Source: https://freestatistics.org/blog/index.php?pk=299644&T=1

Globally Unique Identifier (entire table): ba.freestatistics.org/blog/index.php?pk=299644&T=1

As an alternative you can also use a QR Code:  

The GUIDs for individual cells are displayed in the table below:

Structural Time Series Model -- Interpolation
tObservedLevelSlopeSeasonalStand. Residuals
161556155000
264906433.84608069111273.6548767837253.148602838538030.849323802329996
362856327.42489808753-30.79602465377931.99256266174148-0.87544761137837
464506430.5836428946177.42136555877733.861352373556170.307499460131767
562406265.37855934708-119.1641420906192.5195221796839-0.55428508482013
663756347.7817930766644.20089539046384.053804229754770.46044782608267
761006127.94671936491-169.8003192689892.39768913703203-0.603168269625704
856005634.59774233941-432.027439560412.58445859743279-0.739088869111162
955055469.98965715683-215.2954148451634.279109646361780.610860220505802
1051555162.74520615339-289.8159954289822.82134178500651-0.210036604341359
1147204733.10354830814-403.1385326336892.96487202487473-0.319400098484637
1246454608.78872808947-177.1640677537384.16951949972150.636910080253033
1352105062.04351478643325.5021340997376.68154422344661.53649255043109
1455805567.27565339756453.291384969809-1.862683430870150.342215473951813
1558305855.58234361748319.041693329751-6.93138456749394-0.373479749557358
1663956373.62234949231479.697683263444-1.076854657093340.44998418826357
1772657227.03078336456781.659238325679-4.657587293905380.850884848620534
1874607522.05244175305388.074525932339-6.46057340100734-1.10931989912526
1967906912.66106043634-418.725501916425-8.70571749057161-2.27395501055746
2068106780.57356742584-186.89111456986-3.318992170565130.653425982353667
2170406995.75125913826138.29542247293-1.682244267548710.916539773254277
2273857362.30454278315322.90610092134-3.379885273978640.520326056850824
2371707229.75764398956-45.4573186332935-7.7281374260077-1.03823404533421
2466206684.85697819632-449.370109679508-7.80633680651633-1.1384321517243
2564856398.46026599122-318.77141954742368.0819678668830.386574008510511
2660356040.95898182328-347.410799223938-2.44154620149738-0.0782383911872485
2761656123.88144565391.3585020696454-7.464140478841470.974934359609076
2863206307.81907878076148.546426859231-8.37063862864720.412903929881352
2964306439.69007338581135.095905568898-7.79802436766856-0.0379034122838326
3067856763.76333229445287.637911332425-0.2305356632542970.429940313625951
3168956923.32917934855184.251874304585-13.7798032974727-0.291392520588694
3280307937.32381042465854.032654739953-1.581843692513941.88777951898003
3381158196.86869302274374.163001476519-14.3367384926365-1.35251485905369
3489158880.770841977624.184353578442-0.9562944441599850.704686366246188
3596309623.32248181764719.730969539854-6.768738262784920.269298631435421
3692509378.97962452995-58.3544161539422-19.4802298459485-2.19306144024579
3795359427.695132159927.562183842549495.19884497114880.250598390984718
3883208439.29307293523-739.493342080749-21.6736927361579-2.11492322724311
3970707153.66039205154-1180.7796691119-22.1702750634692-1.23703104295199
4063756345.04914800519-881.208526912484-11.79685890158240.841074680684993
4165356435.66780043704-98.6616364319648-10.38314030911312.20524940730255
4264806471.84850999329.98494706806767-7.087116997666660.30622097667026
4369256906.97651802676352.555175783336-30.0245346845390.965531272002148
4470207050.75251511517184.331873557305-7.15779077434521-0.474137995171031


Structural Time Series Model -- Extrapolation
tObservedLevelSeasonal
17222.212570596337206.7863727072415.42619788909
27640.820526714737326.3868299036314.433696811129
37847.618303522587445.98728709996401.631016422621
47606.387868989457565.5877442963340.8001246931219
58055.678915874717685.18820149269370.490714382016
67789.365020268667804.78865868905-15.4236384203901
77602.968351133347924.38911588542-321.420764752076
87676.744775033928043.98957308178-367.244798047861
98029.261003602698163.59003027814-134.329026675453
108180.282041468318283.19048747451-102.908446006196
118230.573313622598402.79094467087-172.217631048278
128493.15395661958522.39140186723-29.2374452477245

\begin{tabular}{lllllllll}
\hline
Structural Time Series Model -- Extrapolation \tabularnewline
t & Observed & Level & Seasonal \tabularnewline
1 & 7222.21257059633 & 7206.78637270724 & 15.42619788909 \tabularnewline
2 & 7640.82052671473 & 7326.3868299036 & 314.433696811129 \tabularnewline
3 & 7847.61830352258 & 7445.98728709996 & 401.631016422621 \tabularnewline
4 & 7606.38786898945 & 7565.58774429633 & 40.8001246931219 \tabularnewline
5 & 8055.67891587471 & 7685.18820149269 & 370.490714382016 \tabularnewline
6 & 7789.36502026866 & 7804.78865868905 & -15.4236384203901 \tabularnewline
7 & 7602.96835113334 & 7924.38911588542 & -321.420764752076 \tabularnewline
8 & 7676.74477503392 & 8043.98957308178 & -367.244798047861 \tabularnewline
9 & 8029.26100360269 & 8163.59003027814 & -134.329026675453 \tabularnewline
10 & 8180.28204146831 & 8283.19048747451 & -102.908446006196 \tabularnewline
11 & 8230.57331362259 & 8402.79094467087 & -172.217631048278 \tabularnewline
12 & 8493.1539566195 & 8522.39140186723 & -29.2374452477245 \tabularnewline
\hline
\end{tabular}
%Source: https://freestatistics.org/blog/index.php?pk=299644&T=2

[TABLE]
[ROW][C]Structural Time Series Model -- Extrapolation[/C][/ROW]
[ROW][C]t[/C][C]Observed[/C][C]Level[/C][C]Seasonal[/C][/ROW]
[ROW][C]1[/C][C]7222.21257059633[/C][C]7206.78637270724[/C][C]15.42619788909[/C][/ROW]
[ROW][C]2[/C][C]7640.82052671473[/C][C]7326.3868299036[/C][C]314.433696811129[/C][/ROW]
[ROW][C]3[/C][C]7847.61830352258[/C][C]7445.98728709996[/C][C]401.631016422621[/C][/ROW]
[ROW][C]4[/C][C]7606.38786898945[/C][C]7565.58774429633[/C][C]40.8001246931219[/C][/ROW]
[ROW][C]5[/C][C]8055.67891587471[/C][C]7685.18820149269[/C][C]370.490714382016[/C][/ROW]
[ROW][C]6[/C][C]7789.36502026866[/C][C]7804.78865868905[/C][C]-15.4236384203901[/C][/ROW]
[ROW][C]7[/C][C]7602.96835113334[/C][C]7924.38911588542[/C][C]-321.420764752076[/C][/ROW]
[ROW][C]8[/C][C]7676.74477503392[/C][C]8043.98957308178[/C][C]-367.244798047861[/C][/ROW]
[ROW][C]9[/C][C]8029.26100360269[/C][C]8163.59003027814[/C][C]-134.329026675453[/C][/ROW]
[ROW][C]10[/C][C]8180.28204146831[/C][C]8283.19048747451[/C][C]-102.908446006196[/C][/ROW]
[ROW][C]11[/C][C]8230.57331362259[/C][C]8402.79094467087[/C][C]-172.217631048278[/C][/ROW]
[ROW][C]12[/C][C]8493.1539566195[/C][C]8522.39140186723[/C][C]-29.2374452477245[/C][/ROW]
[/TABLE]
Source: https://freestatistics.org/blog/index.php?pk=299644&T=2

Globally Unique Identifier (entire table): ba.freestatistics.org/blog/index.php?pk=299644&T=2

As an alternative you can also use a QR Code:  

The GUIDs for individual cells are displayed in the table below:

Structural Time Series Model -- Extrapolation
tObservedLevelSeasonal
17222.212570596337206.7863727072415.42619788909
27640.820526714737326.3868299036314.433696811129
37847.618303522587445.98728709996401.631016422621
47606.387868989457565.5877442963340.8001246931219
58055.678915874717685.18820149269370.490714382016
67789.365020268667804.78865868905-15.4236384203901
77602.968351133347924.38911588542-321.420764752076
87676.744775033928043.98957308178-367.244798047861
98029.261003602698163.59003027814-134.329026675453
108180.282041468318283.19048747451-102.908446006196
118230.573313622598402.79094467087-172.217631048278
128493.15395661958522.39140186723-29.2374452477245


Parameters (Session):
par1 = 12 ; par2 = 12 ; par3 = BFGS ;
Parameters (R input):
par1 = 12 ; par2 = 12 ; par3 = BFGS ;
R code (references can be found in the software module):
require('stsm')
require('stsm.class')
require('KFKSDS')
par1 <- as.numeric(par1)
par2 <- as.numeric(par2)
nx <- length(x)
x <- ts(x,frequency=par1)
m <- StructTS(x,type='BSM')
print(m$coef)
print(m$fitted)
print(m$resid)
mylevel <- as.numeric(m$fitted[,'level'])
myslope <- as.numeric(m$fitted[,'slope'])
myseas <- as.numeric(m$fitted[,'sea'])
myresid <- as.numeric(m$resid)
myfit <- mylevel+myseas
mm <- stsm.model(model = 'BSM', y = x, transPars = 'StructTS')
fit2 <- stsmFit(mm, stsm.method = 'maxlik.td.optim', method = par3, KF.args = list(P0cov = TRUE))
(fit2.comps <- tsSmooth(fit2, P0cov = FALSE)$states)
m2 <- set.pars(mm, pmax(fit2$par, .Machine$double.eps))
(ss <- char2numeric(m2))
(pred <- predict(ss, x, n.ahead = par2))
mylagmax <- nx/2
bitmap(file='test2.png')
op <- par(mfrow = c(2,2))
acf(as.numeric(x),lag.max = mylagmax,main='Observed')
acf(mylevel,na.action=na.pass,lag.max = mylagmax,main='Level')
acf(myseas,na.action=na.pass,lag.max = mylagmax,main='Seasonal')
acf(myresid,na.action=na.pass,lag.max = mylagmax,main='Standardized Residals')
par(op)
dev.off()
bitmap(file='test3.png')
op <- par(mfrow = c(2,2))
spectrum(as.numeric(x),main='Observed')
spectrum(mylevel,main='Level')
spectrum(myseas,main='Seasonal')
spectrum(myresid,main='Standardized Residals')
par(op)
dev.off()
bitmap(file='test4.png')
op <- par(mfrow = c(2,2))
cpgram(as.numeric(x),main='Observed')
cpgram(mylevel,main='Level')
cpgram(myseas,main='Seasonal')
cpgram(myresid,main='Standardized Residals')
par(op)
dev.off()
bitmap(file='test1.png')
plot(as.numeric(m$resid),main='Standardized Residuals',ylab='Residuals',xlab='time',type='b')
grid()
dev.off()
bitmap(file='test5.png')
op <- par(mfrow = c(2,2))
hist(m$resid,main='Residual Histogram')
plot(density(m$resid),main='Residual Kernel Density')
qqnorm(m$resid,main='Residual Normal QQ Plot')
qqline(m$resid)
plot(m$resid^2, myfit^2,main='Sq.Resid vs. Sq.Fit',xlab='Squared residuals',ylab='Squared Fit')
par(op)
dev.off()
bitmap(file='test6.png')
par(mfrow = c(3,1), mar = c(3,3,3,3))
plot(cbind(x, pred$pred), type = 'n', plot.type = 'single', ylab = '')
lines(x)
polygon(c(time(pred$pred), rev(time(pred$pred))), c(pred$pred + 2 * pred$se, rev(pred$pred)), col = 'gray85', border = NA)
polygon(c(time(pred$pred), rev(time(pred$pred))), c(pred$pred - 2 * pred$se, rev(pred$pred)), col = ' gray85', border = NA)
lines(pred$pred, col = 'blue', lwd = 1.5)
mtext(text = 'forecasts of the observed series', side = 3, adj = 0)
plot(cbind(x, pred$a[,1]), type = 'n', plot.type = 'single', ylab = '')
lines(x)
polygon(c(time(pred$a[,1]), rev(time(pred$a[,1]))), c(pred$a[,1] + 2 * sqrt(pred$P[,1]), rev(pred$a[,1])), col = 'gray85', border = NA)
polygon(c(time(pred$a[,1]), rev(time(pred$a[,1]))), c(pred$a[,1] - 2 * sqrt(pred$P[,1]), rev(pred$a[,1])), col = ' gray85', border = NA)
lines(pred$a[,1], col = 'blue', lwd = 1.5)
mtext(text = 'forecasts of the level component', side = 3, adj = 0)
plot(cbind(fit2.comps[,3], pred$a[,3]), type = 'n', plot.type = 'single', ylab = '')
lines(fit2.comps[,3])
polygon(c(time(pred$a[,3]), rev(time(pred$a[,3]))), c(pred$a[,3] + 2 * sqrt(pred$P[,3]), rev(pred$a[,3])), col = 'gray85', border = NA)
polygon(c(time(pred$a[,3]), rev(time(pred$a[,3]))), c(pred$a[,3] - 2 * sqrt(pred$P[,3]), rev(pred$a[,3])), col = ' gray85', border = NA)
lines(pred$a[,3], col = 'blue', lwd = 1.5)
mtext(text = 'forecasts of the seasonal component', side = 3, adj = 0)
dev.off()
load(file='createtable')
a<-table.start()
a<-table.row.start(a)
a<-table.element(a,'Structural Time Series Model -- Interpolation',6,TRUE)
a<-table.row.end(a)
a<-table.row.start(a)
a<-table.element(a,'t',header=TRUE)
a<-table.element(a,'Observed',header=TRUE)
a<-table.element(a,'Level',header=TRUE)
a<-table.element(a,'Slope',header=TRUE)
a<-table.element(a,'Seasonal',header=TRUE)
a<-table.element(a,'Stand. Residuals',header=TRUE)
a<-table.row.end(a)
for (i in 1:nx) {
a<-table.row.start(a)
a<-table.element(a,i,header=TRUE)
a<-table.element(a,x[i])
a<-table.element(a,mylevel[i])
a<-table.element(a,myslope[i])
a<-table.element(a,myseas[i])
a<-table.element(a,myresid[i])
a<-table.row.end(a)
}
a<-table.end(a)
table.save(a,file='mytable.tab')
a<-table.start()
a<-table.row.start(a)
a<-table.element(a,'Structural Time Series Model -- Extrapolation',4,TRUE)
a<-table.row.end(a)
a<-table.row.start(a)
a<-table.element(a,'t',header=TRUE)
a<-table.element(a,'Observed',header=TRUE)
a<-table.element(a,'Level',header=TRUE)
a<-table.element(a,'Seasonal',header=TRUE)
a<-table.row.end(a)
for (i in 1:par2) {
a<-table.row.start(a)
a<-table.element(a,i,header=TRUE)
a<-table.element(a,pred$pred[i])
a<-table.element(a,pred$a[i,1])
a<-table.element(a,pred$a[i,3])
a<-table.row.end(a)
}
a<-table.end(a)
table.save(a,file='mytable1.tab')