Free Statistics

of Irreproducible Research!

Author's title

Author*The author of this computation has been verified*
R Software Modulerwasp_structuraltimeseries.wasp
Title produced by softwareStructural Time Series Models
Date of computationWed, 14 Dec 2016 19:22:09 +0100
Cite this page as followsStatistical Computations at FreeStatistics.org, Office for Research Development and Education, URL https://freestatistics.org/blog/index.php?v=date/2016/Dec/14/t148173974250634a6jnt65r3q.htm/, Retrieved Fri, 03 May 2024 19:19:13 +0000
Statistical Computations at FreeStatistics.org, Office for Research Development and Education, URL https://freestatistics.org/blog/index.php?pk=299681, Retrieved Fri, 03 May 2024 19:19:13 +0000
QR Codes:

Original text written by user:
IsPrivate?No (this computation is public)
User-defined keywords
Estimated Impact67
Family? (F = Feedback message, R = changed R code, M = changed R Module, P = changed Parameters, D = changed Data)
-       [Structural Time Series Models] [] [2016-12-14 18:22:09] [130d73899007e5ff8a4f636b9bcfb397] [Current]
Feedback Forum

Post a new message
Dataseries X:
2176.85
1899.95
2604
2561.65
2382.5
2155.35
2738.6
2704.25
2540
2251
2982.25
3074.85
2951.25
1105.75
2595.05
2667
2475.2
2015.55
2988.2
3361.25
2861.2
2427.35
3411.9
3404.5
3406.2
2679.3
3677.2
3815.35
3422.85
2925.85
3827.5
4319.65
4004.85
3109.2
4137.35
4847.6


Summary of computational transaction
Raw Input view raw input (R code)
Raw Outputview raw output of R engine
Computing time3 seconds
R ServerBig Analytics Cloud Computing Center

\begin{tabular}{lllllllll}
\hline
Summary of computational transaction \tabularnewline
Raw Input view raw input (R code)  \tabularnewline
Raw Outputview raw output of R engine  \tabularnewline
Computing time3 seconds \tabularnewline
R ServerBig Analytics Cloud Computing Center \tabularnewline
\hline
\end{tabular}
%Source: https://freestatistics.org/blog/index.php?pk=299681&T=0

[TABLE]
[ROW]
Summary of computational transaction[/C][/ROW] [ROW]Raw Input[/C] view raw input (R code) [/C][/ROW] [ROW]Raw Output[/C]view raw output of R engine [/C][/ROW] [ROW]Computing time[/C]3 seconds[/C][/ROW] [ROW]R Server[/C]Big Analytics Cloud Computing Center[/C][/ROW] [/TABLE] Source: https://freestatistics.org/blog/index.php?pk=299681&T=0

Globally Unique Identifier (entire table): ba.freestatistics.org/blog/index.php?pk=299681&T=0

As an alternative you can also use a QR Code:  

The GUIDs for individual cells are displayed in the table below:

Summary of computational transaction
Raw Input view raw input (R code)
Raw Outputview raw output of R engine
Computing time3 seconds
R ServerBig Analytics Cloud Computing Center


Structural Time Series Model -- Interpolation
tObservedLevelSlopeSeasonalStand. Residuals
12176.852176.85000
21899.952101.3050372868-0.922842647670858-157.068577510493-0.810943761398599
326042263.3808647907613.0947496699948298.1038523979870.959663991164835
42561.652409.044407107824.3773876747626115.424182141390.857544706273096
52382.52436.6488801623624.6129041749456-55.23484889142380.0240356746062385
62155.352359.5536147098118.3641134688095-166.29313185146-0.815565812208471
72738.62456.3213860921422.610043957319251.7766227858490.647121308409489
82704.252562.2943772538126.8461835807387109.0665878697850.693718874636845
925402589.5167050716626.8649993001173-49.66535901403540.00312951061329822
1022512496.7741202259720.8191305004292-198.652519300631-0.991848397039675
112982.252621.3187152693526.1718063784553320.2591137627510.856549710001564
123074.852800.9464677126334.2706513520407214.0263857180581.26193909391012
132951.252934.4499178484535.901011485174-23.44621980929570.88858835683742
141105.752557.7735561508320.4980944750782-1293.25637423553-3.4866531685923
152595.052394.7951133807410.2229237951901262.665590339032-1.40029979581461
1626672391.688013322779.3759743959728279.631291768433-0.0988197588070324
172475.22419.42253236810.562447723812149.72580848186680.138880951241335
182015.552377.353780470967.24414381062075-343.890001834225-0.409054385999705
192988.22490.8087397448413.7169769055887460.4096342933240.839797353894734
203361.252747.92523357928.1345125309028527.6231064744561.93887126194352
212861.22868.0879727429633.4782486147509-39.41181837183330.734237156177837
222427.352880.4677963742932.2715974815494-445.662547432189-0.168104578649171
233411.92991.4722251513636.6967121900754392.658769168670.625758138632054
243404.53077.0555235408939.3703242246898310.2201671043490.388341371743321
253406.23119.1055236677139.5107248803775286.1438472881610.0215192019107199
262679.33362.628306205550.6775929632509-755.3363315384771.6292273219842
273677.23462.8028280786753.5620932400038197.3766965544730.386311398570018
283815.353540.4982789717855.0262077559148266.7256617133880.185518592953995
293422.853542.9165160425951.7843019197802-102.401072191495-0.404718002275196
302925.853531.9178099805247.9160013349989-584.802340812326-0.487240370724945
313827.53558.9867877686646.641540256511275.643322601643-0.163098790757439
324319.653675.7685504664150.8856554269644619.7533213435510.550929337836712
334004.853842.8753995665357.8461568363362121.9353455005170.913093160722082
343109.23847.8449123817154.7096536821838-720.450545743795-0.414703142520118
354137.353862.2800568640252.3416175631935288.902725663542-0.315357463728852
364847.64114.4299548167664.0069814926734664.5589063301521.56546976061189

\begin{tabular}{lllllllll}
\hline
Structural Time Series Model -- Interpolation \tabularnewline
t & Observed & Level & Slope & Seasonal & Stand. Residuals \tabularnewline
1 & 2176.85 & 2176.85 & 0 & 0 & 0 \tabularnewline
2 & 1899.95 & 2101.3050372868 & -0.922842647670858 & -157.068577510493 & -0.810943761398599 \tabularnewline
3 & 2604 & 2263.38086479076 & 13.0947496699948 & 298.103852397987 & 0.959663991164835 \tabularnewline
4 & 2561.65 & 2409.0444071078 & 24.3773876747626 & 115.42418214139 & 0.857544706273096 \tabularnewline
5 & 2382.5 & 2436.64888016236 & 24.6129041749456 & -55.2348488914238 & 0.0240356746062385 \tabularnewline
6 & 2155.35 & 2359.55361470981 & 18.3641134688095 & -166.29313185146 & -0.815565812208471 \tabularnewline
7 & 2738.6 & 2456.32138609214 & 22.610043957319 & 251.776622785849 & 0.647121308409489 \tabularnewline
8 & 2704.25 & 2562.29437725381 & 26.8461835807387 & 109.066587869785 & 0.693718874636845 \tabularnewline
9 & 2540 & 2589.51670507166 & 26.8649993001173 & -49.6653590140354 & 0.00312951061329822 \tabularnewline
10 & 2251 & 2496.77412022597 & 20.8191305004292 & -198.652519300631 & -0.991848397039675 \tabularnewline
11 & 2982.25 & 2621.31871526935 & 26.1718063784553 & 320.259113762751 & 0.856549710001564 \tabularnewline
12 & 3074.85 & 2800.94646771263 & 34.2706513520407 & 214.026385718058 & 1.26193909391012 \tabularnewline
13 & 2951.25 & 2934.44991784845 & 35.901011485174 & -23.4462198092957 & 0.88858835683742 \tabularnewline
14 & 1105.75 & 2557.77355615083 & 20.4980944750782 & -1293.25637423553 & -3.4866531685923 \tabularnewline
15 & 2595.05 & 2394.79511338074 & 10.2229237951901 & 262.665590339032 & -1.40029979581461 \tabularnewline
16 & 2667 & 2391.68801332277 & 9.3759743959728 & 279.631291768433 & -0.0988197588070324 \tabularnewline
17 & 2475.2 & 2419.422532368 & 10.5624477238121 & 49.7258084818668 & 0.138880951241335 \tabularnewline
18 & 2015.55 & 2377.35378047096 & 7.24414381062075 & -343.890001834225 & -0.409054385999705 \tabularnewline
19 & 2988.2 & 2490.80873974484 & 13.7169769055887 & 460.409634293324 & 0.839797353894734 \tabularnewline
20 & 3361.25 & 2747.925233579 & 28.1345125309028 & 527.623106474456 & 1.93887126194352 \tabularnewline
21 & 2861.2 & 2868.08797274296 & 33.4782486147509 & -39.4118183718333 & 0.734237156177837 \tabularnewline
22 & 2427.35 & 2880.46779637429 & 32.2715974815494 & -445.662547432189 & -0.168104578649171 \tabularnewline
23 & 3411.9 & 2991.47222515136 & 36.6967121900754 & 392.65876916867 & 0.625758138632054 \tabularnewline
24 & 3404.5 & 3077.05552354089 & 39.3703242246898 & 310.220167104349 & 0.388341371743321 \tabularnewline
25 & 3406.2 & 3119.10552366771 & 39.5107248803775 & 286.143847288161 & 0.0215192019107199 \tabularnewline
26 & 2679.3 & 3362.6283062055 & 50.6775929632509 & -755.336331538477 & 1.6292273219842 \tabularnewline
27 & 3677.2 & 3462.80282807867 & 53.5620932400038 & 197.376696554473 & 0.386311398570018 \tabularnewline
28 & 3815.35 & 3540.49827897178 & 55.0262077559148 & 266.725661713388 & 0.185518592953995 \tabularnewline
29 & 3422.85 & 3542.91651604259 & 51.7843019197802 & -102.401072191495 & -0.404718002275196 \tabularnewline
30 & 2925.85 & 3531.91780998052 & 47.9160013349989 & -584.802340812326 & -0.487240370724945 \tabularnewline
31 & 3827.5 & 3558.98678776866 & 46.641540256511 & 275.643322601643 & -0.163098790757439 \tabularnewline
32 & 4319.65 & 3675.76855046641 & 50.8856554269644 & 619.753321343551 & 0.550929337836712 \tabularnewline
33 & 4004.85 & 3842.87539956653 & 57.8461568363362 & 121.935345500517 & 0.913093160722082 \tabularnewline
34 & 3109.2 & 3847.84491238171 & 54.7096536821838 & -720.450545743795 & -0.414703142520118 \tabularnewline
35 & 4137.35 & 3862.28005686402 & 52.3416175631935 & 288.902725663542 & -0.315357463728852 \tabularnewline
36 & 4847.6 & 4114.42995481676 & 64.0069814926734 & 664.558906330152 & 1.56546976061189 \tabularnewline
\hline
\end{tabular}
%Source: https://freestatistics.org/blog/index.php?pk=299681&T=1

[TABLE]
[ROW][C]Structural Time Series Model -- Interpolation[/C][/ROW]
[ROW][C]t[/C][C]Observed[/C][C]Level[/C][C]Slope[/C][C]Seasonal[/C][C]Stand. Residuals[/C][/ROW]
[ROW][C]1[/C][C]2176.85[/C][C]2176.85[/C][C]0[/C][C]0[/C][C]0[/C][/ROW]
[ROW][C]2[/C][C]1899.95[/C][C]2101.3050372868[/C][C]-0.922842647670858[/C][C]-157.068577510493[/C][C]-0.810943761398599[/C][/ROW]
[ROW][C]3[/C][C]2604[/C][C]2263.38086479076[/C][C]13.0947496699948[/C][C]298.103852397987[/C][C]0.959663991164835[/C][/ROW]
[ROW][C]4[/C][C]2561.65[/C][C]2409.0444071078[/C][C]24.3773876747626[/C][C]115.42418214139[/C][C]0.857544706273096[/C][/ROW]
[ROW][C]5[/C][C]2382.5[/C][C]2436.64888016236[/C][C]24.6129041749456[/C][C]-55.2348488914238[/C][C]0.0240356746062385[/C][/ROW]
[ROW][C]6[/C][C]2155.35[/C][C]2359.55361470981[/C][C]18.3641134688095[/C][C]-166.29313185146[/C][C]-0.815565812208471[/C][/ROW]
[ROW][C]7[/C][C]2738.6[/C][C]2456.32138609214[/C][C]22.610043957319[/C][C]251.776622785849[/C][C]0.647121308409489[/C][/ROW]
[ROW][C]8[/C][C]2704.25[/C][C]2562.29437725381[/C][C]26.8461835807387[/C][C]109.066587869785[/C][C]0.693718874636845[/C][/ROW]
[ROW][C]9[/C][C]2540[/C][C]2589.51670507166[/C][C]26.8649993001173[/C][C]-49.6653590140354[/C][C]0.00312951061329822[/C][/ROW]
[ROW][C]10[/C][C]2251[/C][C]2496.77412022597[/C][C]20.8191305004292[/C][C]-198.652519300631[/C][C]-0.991848397039675[/C][/ROW]
[ROW][C]11[/C][C]2982.25[/C][C]2621.31871526935[/C][C]26.1718063784553[/C][C]320.259113762751[/C][C]0.856549710001564[/C][/ROW]
[ROW][C]12[/C][C]3074.85[/C][C]2800.94646771263[/C][C]34.2706513520407[/C][C]214.026385718058[/C][C]1.26193909391012[/C][/ROW]
[ROW][C]13[/C][C]2951.25[/C][C]2934.44991784845[/C][C]35.901011485174[/C][C]-23.4462198092957[/C][C]0.88858835683742[/C][/ROW]
[ROW][C]14[/C][C]1105.75[/C][C]2557.77355615083[/C][C]20.4980944750782[/C][C]-1293.25637423553[/C][C]-3.4866531685923[/C][/ROW]
[ROW][C]15[/C][C]2595.05[/C][C]2394.79511338074[/C][C]10.2229237951901[/C][C]262.665590339032[/C][C]-1.40029979581461[/C][/ROW]
[ROW][C]16[/C][C]2667[/C][C]2391.68801332277[/C][C]9.3759743959728[/C][C]279.631291768433[/C][C]-0.0988197588070324[/C][/ROW]
[ROW][C]17[/C][C]2475.2[/C][C]2419.422532368[/C][C]10.5624477238121[/C][C]49.7258084818668[/C][C]0.138880951241335[/C][/ROW]
[ROW][C]18[/C][C]2015.55[/C][C]2377.35378047096[/C][C]7.24414381062075[/C][C]-343.890001834225[/C][C]-0.409054385999705[/C][/ROW]
[ROW][C]19[/C][C]2988.2[/C][C]2490.80873974484[/C][C]13.7169769055887[/C][C]460.409634293324[/C][C]0.839797353894734[/C][/ROW]
[ROW][C]20[/C][C]3361.25[/C][C]2747.925233579[/C][C]28.1345125309028[/C][C]527.623106474456[/C][C]1.93887126194352[/C][/ROW]
[ROW][C]21[/C][C]2861.2[/C][C]2868.08797274296[/C][C]33.4782486147509[/C][C]-39.4118183718333[/C][C]0.734237156177837[/C][/ROW]
[ROW][C]22[/C][C]2427.35[/C][C]2880.46779637429[/C][C]32.2715974815494[/C][C]-445.662547432189[/C][C]-0.168104578649171[/C][/ROW]
[ROW][C]23[/C][C]3411.9[/C][C]2991.47222515136[/C][C]36.6967121900754[/C][C]392.65876916867[/C][C]0.625758138632054[/C][/ROW]
[ROW][C]24[/C][C]3404.5[/C][C]3077.05552354089[/C][C]39.3703242246898[/C][C]310.220167104349[/C][C]0.388341371743321[/C][/ROW]
[ROW][C]25[/C][C]3406.2[/C][C]3119.10552366771[/C][C]39.5107248803775[/C][C]286.143847288161[/C][C]0.0215192019107199[/C][/ROW]
[ROW][C]26[/C][C]2679.3[/C][C]3362.6283062055[/C][C]50.6775929632509[/C][C]-755.336331538477[/C][C]1.6292273219842[/C][/ROW]
[ROW][C]27[/C][C]3677.2[/C][C]3462.80282807867[/C][C]53.5620932400038[/C][C]197.376696554473[/C][C]0.386311398570018[/C][/ROW]
[ROW][C]28[/C][C]3815.35[/C][C]3540.49827897178[/C][C]55.0262077559148[/C][C]266.725661713388[/C][C]0.185518592953995[/C][/ROW]
[ROW][C]29[/C][C]3422.85[/C][C]3542.91651604259[/C][C]51.7843019197802[/C][C]-102.401072191495[/C][C]-0.404718002275196[/C][/ROW]
[ROW][C]30[/C][C]2925.85[/C][C]3531.91780998052[/C][C]47.9160013349989[/C][C]-584.802340812326[/C][C]-0.487240370724945[/C][/ROW]
[ROW][C]31[/C][C]3827.5[/C][C]3558.98678776866[/C][C]46.641540256511[/C][C]275.643322601643[/C][C]-0.163098790757439[/C][/ROW]
[ROW][C]32[/C][C]4319.65[/C][C]3675.76855046641[/C][C]50.8856554269644[/C][C]619.753321343551[/C][C]0.550929337836712[/C][/ROW]
[ROW][C]33[/C][C]4004.85[/C][C]3842.87539956653[/C][C]57.8461568363362[/C][C]121.935345500517[/C][C]0.913093160722082[/C][/ROW]
[ROW][C]34[/C][C]3109.2[/C][C]3847.84491238171[/C][C]54.7096536821838[/C][C]-720.450545743795[/C][C]-0.414703142520118[/C][/ROW]
[ROW][C]35[/C][C]4137.35[/C][C]3862.28005686402[/C][C]52.3416175631935[/C][C]288.902725663542[/C][C]-0.315357463728852[/C][/ROW]
[ROW][C]36[/C][C]4847.6[/C][C]4114.42995481676[/C][C]64.0069814926734[/C][C]664.558906330152[/C][C]1.56546976061189[/C][/ROW]
[/TABLE]
Source: https://freestatistics.org/blog/index.php?pk=299681&T=1

Globally Unique Identifier (entire table): ba.freestatistics.org/blog/index.php?pk=299681&T=1

As an alternative you can also use a QR Code:  

The GUIDs for individual cells are displayed in the table below:

Structural Time Series Model -- Interpolation
tObservedLevelSlopeSeasonalStand. Residuals
12176.852176.85000
21899.952101.3050372868-0.922842647670858-157.068577510493-0.810943761398599
326042263.3808647907613.0947496699948298.1038523979870.959663991164835
42561.652409.044407107824.3773876747626115.424182141390.857544706273096
52382.52436.6488801623624.6129041749456-55.23484889142380.0240356746062385
62155.352359.5536147098118.3641134688095-166.29313185146-0.815565812208471
72738.62456.3213860921422.610043957319251.7766227858490.647121308409489
82704.252562.2943772538126.8461835807387109.0665878697850.693718874636845
925402589.5167050716626.8649993001173-49.66535901403540.00312951061329822
1022512496.7741202259720.8191305004292-198.652519300631-0.991848397039675
112982.252621.3187152693526.1718063784553320.2591137627510.856549710001564
123074.852800.9464677126334.2706513520407214.0263857180581.26193909391012
132951.252934.4499178484535.901011485174-23.44621980929570.88858835683742
141105.752557.7735561508320.4980944750782-1293.25637423553-3.4866531685923
152595.052394.7951133807410.2229237951901262.665590339032-1.40029979581461
1626672391.688013322779.3759743959728279.631291768433-0.0988197588070324
172475.22419.42253236810.562447723812149.72580848186680.138880951241335
182015.552377.353780470967.24414381062075-343.890001834225-0.409054385999705
192988.22490.8087397448413.7169769055887460.4096342933240.839797353894734
203361.252747.92523357928.1345125309028527.6231064744561.93887126194352
212861.22868.0879727429633.4782486147509-39.41181837183330.734237156177837
222427.352880.4677963742932.2715974815494-445.662547432189-0.168104578649171
233411.92991.4722251513636.6967121900754392.658769168670.625758138632054
243404.53077.0555235408939.3703242246898310.2201671043490.388341371743321
253406.23119.1055236677139.5107248803775286.1438472881610.0215192019107199
262679.33362.628306205550.6775929632509-755.3363315384771.6292273219842
273677.23462.8028280786753.5620932400038197.3766965544730.386311398570018
283815.353540.4982789717855.0262077559148266.7256617133880.185518592953995
293422.853542.9165160425951.7843019197802-102.401072191495-0.404718002275196
302925.853531.9178099805247.9160013349989-584.802340812326-0.487240370724945
313827.53558.9867877686646.641540256511275.643322601643-0.163098790757439
324319.653675.7685504664150.8856554269644619.7533213435510.550929337836712
334004.853842.8753995665357.8461568363362121.9353455005170.913093160722082
343109.23847.8449123817154.7096536821838-720.450545743795-0.414703142520118
354137.353862.2800568640252.3416175631935288.902725663542-0.315357463728852
364847.64114.4299548167664.0069814926734664.5589063301521.56546976061189


Structural Time Series Model -- Extrapolation
tObservedLevelSeasonal
14149.111866291514101.4655693302347.6462969612828
23370.471033878694160.66584553625-790.194811657557
34374.083802624474219.86612174228154.217680882191
44526.830406603434279.0663979483247.764008655131
54190.963007262894338.26667415433-147.303666891435
63725.134597820114397.46695036035-672.332352540243
74619.651026299584456.66722656637162.983799733204
85070.648811964254515.8675027724554.781309191852
94747.465986193944575.06777897842172.398207215512
103923.603182458584634.26805518445-710.664872725867
114918.805019120644693.46833139047225.336687730168
125508.036321042264752.6686075965755.367713445761

\begin{tabular}{lllllllll}
\hline
Structural Time Series Model -- Extrapolation \tabularnewline
t & Observed & Level & Seasonal \tabularnewline
1 & 4149.11186629151 & 4101.46556933023 & 47.6462969612828 \tabularnewline
2 & 3370.47103387869 & 4160.66584553625 & -790.194811657557 \tabularnewline
3 & 4374.08380262447 & 4219.86612174228 & 154.217680882191 \tabularnewline
4 & 4526.83040660343 & 4279.0663979483 & 247.764008655131 \tabularnewline
5 & 4190.96300726289 & 4338.26667415433 & -147.303666891435 \tabularnewline
6 & 3725.13459782011 & 4397.46695036035 & -672.332352540243 \tabularnewline
7 & 4619.65102629958 & 4456.66722656637 & 162.983799733204 \tabularnewline
8 & 5070.64881196425 & 4515.8675027724 & 554.781309191852 \tabularnewline
9 & 4747.46598619394 & 4575.06777897842 & 172.398207215512 \tabularnewline
10 & 3923.60318245858 & 4634.26805518445 & -710.664872725867 \tabularnewline
11 & 4918.80501912064 & 4693.46833139047 & 225.336687730168 \tabularnewline
12 & 5508.03632104226 & 4752.6686075965 & 755.367713445761 \tabularnewline
\hline
\end{tabular}
%Source: https://freestatistics.org/blog/index.php?pk=299681&T=2

[TABLE]
[ROW][C]Structural Time Series Model -- Extrapolation[/C][/ROW]
[ROW][C]t[/C][C]Observed[/C][C]Level[/C][C]Seasonal[/C][/ROW]
[ROW][C]1[/C][C]4149.11186629151[/C][C]4101.46556933023[/C][C]47.6462969612828[/C][/ROW]
[ROW][C]2[/C][C]3370.47103387869[/C][C]4160.66584553625[/C][C]-790.194811657557[/C][/ROW]
[ROW][C]3[/C][C]4374.08380262447[/C][C]4219.86612174228[/C][C]154.217680882191[/C][/ROW]
[ROW][C]4[/C][C]4526.83040660343[/C][C]4279.0663979483[/C][C]247.764008655131[/C][/ROW]
[ROW][C]5[/C][C]4190.96300726289[/C][C]4338.26667415433[/C][C]-147.303666891435[/C][/ROW]
[ROW][C]6[/C][C]3725.13459782011[/C][C]4397.46695036035[/C][C]-672.332352540243[/C][/ROW]
[ROW][C]7[/C][C]4619.65102629958[/C][C]4456.66722656637[/C][C]162.983799733204[/C][/ROW]
[ROW][C]8[/C][C]5070.64881196425[/C][C]4515.8675027724[/C][C]554.781309191852[/C][/ROW]
[ROW][C]9[/C][C]4747.46598619394[/C][C]4575.06777897842[/C][C]172.398207215512[/C][/ROW]
[ROW][C]10[/C][C]3923.60318245858[/C][C]4634.26805518445[/C][C]-710.664872725867[/C][/ROW]
[ROW][C]11[/C][C]4918.80501912064[/C][C]4693.46833139047[/C][C]225.336687730168[/C][/ROW]
[ROW][C]12[/C][C]5508.03632104226[/C][C]4752.6686075965[/C][C]755.367713445761[/C][/ROW]
[/TABLE]
Source: https://freestatistics.org/blog/index.php?pk=299681&T=2

Globally Unique Identifier (entire table): ba.freestatistics.org/blog/index.php?pk=299681&T=2

As an alternative you can also use a QR Code:  

The GUIDs for individual cells are displayed in the table below:

Structural Time Series Model -- Extrapolation
tObservedLevelSeasonal
14149.111866291514101.4655693302347.6462969612828
23370.471033878694160.66584553625-790.194811657557
34374.083802624474219.86612174228154.217680882191
44526.830406603434279.0663979483247.764008655131
54190.963007262894338.26667415433-147.303666891435
63725.134597820114397.46695036035-672.332352540243
74619.651026299584456.66722656637162.983799733204
85070.648811964254515.8675027724554.781309191852
94747.465986193944575.06777897842172.398207215512
103923.603182458584634.26805518445-710.664872725867
114918.805019120644693.46833139047225.336687730168
125508.036321042264752.6686075965755.367713445761


Parameters (Session):
par1 = 12 ; par2 = 12 ; par3 = BFGS ;
Parameters (R input):
par1 = 12 ; par2 = 12 ; par3 = BFGS ;
R code (references can be found in the software module):
require('stsm')
require('stsm.class')
require('KFKSDS')
par1 <- as.numeric(par1)
par2 <- as.numeric(par2)
nx <- length(x)
x <- ts(x,frequency=par1)
m <- StructTS(x,type='BSM')
print(m$coef)
print(m$fitted)
print(m$resid)
mylevel <- as.numeric(m$fitted[,'level'])
myslope <- as.numeric(m$fitted[,'slope'])
myseas <- as.numeric(m$fitted[,'sea'])
myresid <- as.numeric(m$resid)
myfit <- mylevel+myseas
mm <- stsm.model(model = 'BSM', y = x, transPars = 'StructTS')
fit2 <- stsmFit(mm, stsm.method = 'maxlik.td.optim', method = par3, KF.args = list(P0cov = TRUE))
(fit2.comps <- tsSmooth(fit2, P0cov = FALSE)$states)
m2 <- set.pars(mm, pmax(fit2$par, .Machine$double.eps))
(ss <- char2numeric(m2))
(pred <- predict(ss, x, n.ahead = par2))
mylagmax <- nx/2
bitmap(file='test2.png')
op <- par(mfrow = c(2,2))
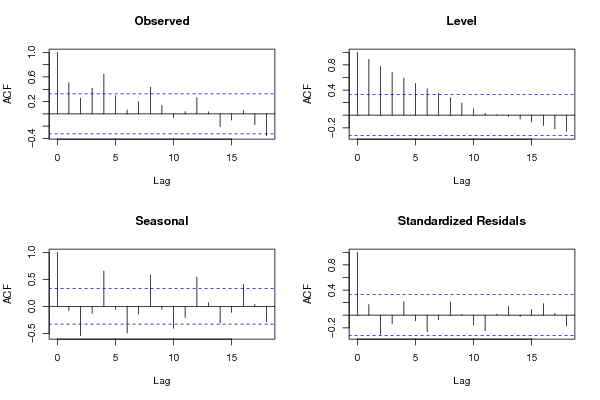
acf(as.numeric(x),lag.max = mylagmax,main='Observed')
acf(mylevel,na.action=na.pass,lag.max = mylagmax,main='Level')
acf(myseas,na.action=na.pass,lag.max = mylagmax,main='Seasonal')
acf(myresid,na.action=na.pass,lag.max = mylagmax,main='Standardized Residals')
par(op)
dev.off()
bitmap(file='test3.png')
op <- par(mfrow = c(2,2))
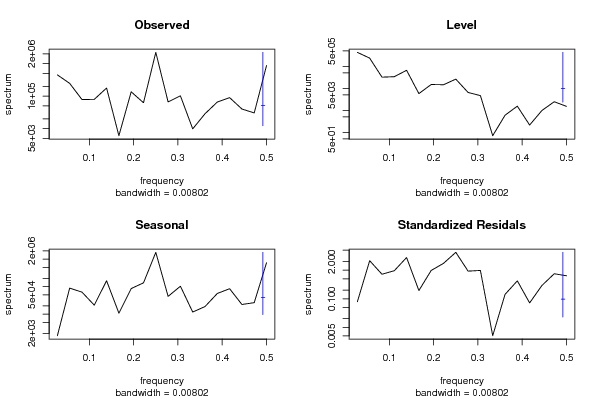
spectrum(as.numeric(x),main='Observed')
spectrum(mylevel,main='Level')
spectrum(myseas,main='Seasonal')
spectrum(myresid,main='Standardized Residals')
par(op)
dev.off()
bitmap(file='test4.png')
op <- par(mfrow = c(2,2))
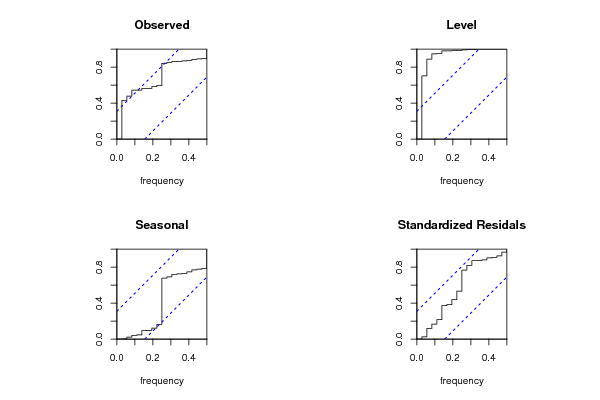
cpgram(as.numeric(x),main='Observed')
cpgram(mylevel,main='Level')
cpgram(myseas,main='Seasonal')
cpgram(myresid,main='Standardized Residals')
par(op)
dev.off()
bitmap(file='test1.png')
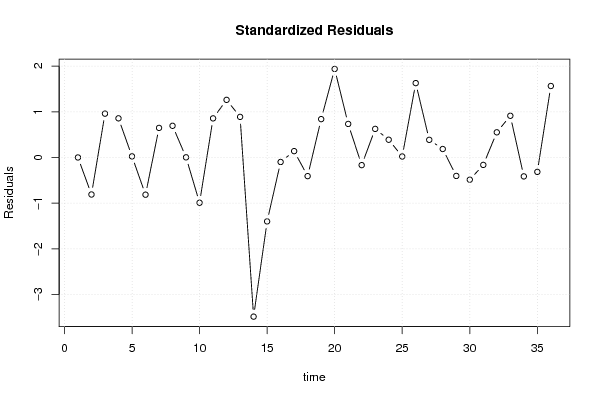
plot(as.numeric(m$resid),main='Standardized Residuals',ylab='Residuals',xlab='time',type='b')
grid()
dev.off()
bitmap(file='test5.png')
op <- par(mfrow = c(2,2))
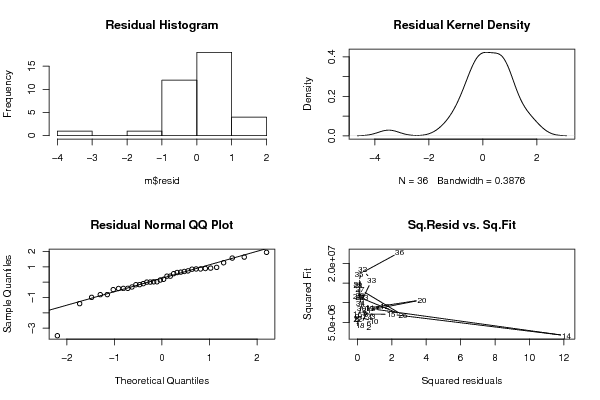
hist(m$resid,main='Residual Histogram')
plot(density(m$resid),main='Residual Kernel Density')
qqnorm(m$resid,main='Residual Normal QQ Plot')
qqline(m$resid)
plot(m$resid^2, myfit^2,main='Sq.Resid vs. Sq.Fit',xlab='Squared residuals',ylab='Squared Fit')
par(op)
dev.off()
bitmap(file='test6.png')
par(mfrow = c(3,1), mar = c(3,3,3,3))
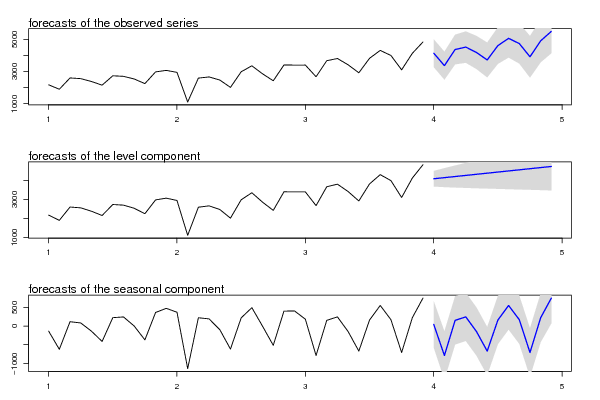
plot(cbind(x, pred$pred), type = 'n', plot.type = 'single', ylab = '')
lines(x)
polygon(c(time(pred$pred), rev(time(pred$pred))), c(pred$pred + 2 * pred$se, rev(pred$pred)), col = 'gray85', border = NA)
polygon(c(time(pred$pred), rev(time(pred$pred))), c(pred$pred - 2 * pred$se, rev(pred$pred)), col = ' gray85', border = NA)
lines(pred$pred, col = 'blue', lwd = 1.5)
mtext(text = 'forecasts of the observed series', side = 3, adj = 0)
plot(cbind(x, pred$a[,1]), type = 'n', plot.type = 'single', ylab = '')
lines(x)
polygon(c(time(pred$a[,1]), rev(time(pred$a[,1]))), c(pred$a[,1] + 2 * sqrt(pred$P[,1]), rev(pred$a[,1])), col = 'gray85', border = NA)
polygon(c(time(pred$a[,1]), rev(time(pred$a[,1]))), c(pred$a[,1] - 2 * sqrt(pred$P[,1]), rev(pred$a[,1])), col = ' gray85', border = NA)
lines(pred$a[,1], col = 'blue', lwd = 1.5)
mtext(text = 'forecasts of the level component', side = 3, adj = 0)
plot(cbind(fit2.comps[,3], pred$a[,3]), type = 'n', plot.type = 'single', ylab = '')
lines(fit2.comps[,3])
polygon(c(time(pred$a[,3]), rev(time(pred$a[,3]))), c(pred$a[,3] + 2 * sqrt(pred$P[,3]), rev(pred$a[,3])), col = 'gray85', border = NA)
polygon(c(time(pred$a[,3]), rev(time(pred$a[,3]))), c(pred$a[,3] - 2 * sqrt(pred$P[,3]), rev(pred$a[,3])), col = ' gray85', border = NA)
lines(pred$a[,3], col = 'blue', lwd = 1.5)
mtext(text = 'forecasts of the seasonal component', side = 3, adj = 0)
dev.off()
load(file='createtable')
a<-table.start()
a<-table.row.start(a)
a<-table.element(a,'Structural Time Series Model -- Interpolation',6,TRUE)
a<-table.row.end(a)
a<-table.row.start(a)
a<-table.element(a,'t',header=TRUE)
a<-table.element(a,'Observed',header=TRUE)
a<-table.element(a,'Level',header=TRUE)
a<-table.element(a,'Slope',header=TRUE)
a<-table.element(a,'Seasonal',header=TRUE)
a<-table.element(a,'Stand. Residuals',header=TRUE)
a<-table.row.end(a)
for (i in 1:nx) {
a<-table.row.start(a)
a<-table.element(a,i,header=TRUE)
a<-table.element(a,x[i])
a<-table.element(a,mylevel[i])
a<-table.element(a,myslope[i])
a<-table.element(a,myseas[i])
a<-table.element(a,myresid[i])
a<-table.row.end(a)
}
a<-table.end(a)
table.save(a,file='mytable.tab')
a<-table.start()
a<-table.row.start(a)
a<-table.element(a,'Structural Time Series Model -- Extrapolation',4,TRUE)
a<-table.row.end(a)
a<-table.row.start(a)
a<-table.element(a,'t',header=TRUE)
a<-table.element(a,'Observed',header=TRUE)
a<-table.element(a,'Level',header=TRUE)
a<-table.element(a,'Seasonal',header=TRUE)
a<-table.row.end(a)
for (i in 1:par2) {
a<-table.row.start(a)
a<-table.element(a,i,header=TRUE)
a<-table.element(a,pred$pred[i])
a<-table.element(a,pred$a[i,1])
a<-table.element(a,pred$a[i,3])
a<-table.row.end(a)
}
a<-table.end(a)
table.save(a,file='mytable1.tab')