Free Statistics

of Irreproducible Research!

Author's title

Author*The author of this computation has been verified*
R Software Modulerwasp_exponentialsmoothing.wasp
Title produced by softwareExponential Smoothing
Date of computationWed, 14 Dec 2016 19:30:14 +0100
Cite this page as followsStatistical Computations at FreeStatistics.org, Office for Research Development and Education, URL https://freestatistics.org/blog/index.php?v=date/2016/Dec/14/t1481740223l0rleltdo03f6qr.htm/, Retrieved Fri, 03 May 2024 20:55:39 +0000
Statistical Computations at FreeStatistics.org, Office for Research Development and Education, URL https://freestatistics.org/blog/index.php?pk=299684, Retrieved Fri, 03 May 2024 20:55:39 +0000
QR Codes:

Original text written by user:
IsPrivate?No (this computation is public)
User-defined keywords
Estimated Impact77
Family? (F = Feedback message, R = changed R code, M = changed R Module, P = changed Parameters, D = changed Data)
-       [Exponential Smoothing] [] [2016-12-14 18:30:14] [130d73899007e5ff8a4f636b9bcfb397] [Current]
Feedback Forum

Post a new message
Dataseries X:
1623.25
2140.55
2451.15
2964.45
3619.1
3764.25
4156
3374.55
4268.55
5290.7
5635.2
5845.9
7286.05
7686.95


Summary of computational transaction
Raw Input view raw input (R code)
Raw Outputview raw output of R engine
Computing time2 seconds
R ServerBig Analytics Cloud Computing Center

\begin{tabular}{lllllllll}
\hline
Summary of computational transaction \tabularnewline
Raw Input view raw input (R code)  \tabularnewline
Raw Outputview raw output of R engine  \tabularnewline
Computing time2 seconds \tabularnewline
R ServerBig Analytics Cloud Computing Center \tabularnewline
\hline
\end{tabular}
%Source: https://freestatistics.org/blog/index.php?pk=299684&T=0

[TABLE]
[ROW]
Summary of computational transaction[/C][/ROW] [ROW]Raw Input[/C] view raw input (R code) [/C][/ROW] [ROW]Raw Output[/C]view raw output of R engine [/C][/ROW] [ROW]Computing time[/C]2 seconds[/C][/ROW] [ROW]R Server[/C]Big Analytics Cloud Computing Center[/C][/ROW] [/TABLE] Source: https://freestatistics.org/blog/index.php?pk=299684&T=0

Globally Unique Identifier (entire table): ba.freestatistics.org/blog/index.php?pk=299684&T=0

As an alternative you can also use a QR Code:  

The GUIDs for individual cells are displayed in the table below:

Summary of computational transaction
Raw Input view raw input (R code)
Raw Outputview raw output of R engine
Computing time2 seconds
R ServerBig Analytics Cloud Computing Center


Estimated Parameters of Exponential Smoothing
ParameterValue
alpha0.999923203365937
betaFALSE
gammaFALSE

\begin{tabular}{lllllllll}
\hline
Estimated Parameters of Exponential Smoothing \tabularnewline
Parameter & Value \tabularnewline
alpha & 0.999923203365937 \tabularnewline
beta & FALSE \tabularnewline
gamma & FALSE \tabularnewline
\hline
\end{tabular}
%Source: https://freestatistics.org/blog/index.php?pk=299684&T=1

[TABLE]
[ROW][C]Estimated Parameters of Exponential Smoothing[/C][/ROW]
[ROW][C]Parameter[/C][C]Value[/C][/ROW]
[ROW][C]alpha[/C][C]0.999923203365937[/C][/ROW]
[ROW][C]beta[/C][C]FALSE[/C][/ROW]
[ROW][C]gamma[/C][C]FALSE[/C][/ROW]
[/TABLE]
Source: https://freestatistics.org/blog/index.php?pk=299684&T=1

Globally Unique Identifier (entire table): ba.freestatistics.org/blog/index.php?pk=299684&T=1

As an alternative you can also use a QR Code:  

The GUIDs for individual cells are displayed in the table below:

Estimated Parameters of Exponential Smoothing
ParameterValue
alpha0.999923203365937
betaFALSE
gammaFALSE


Interpolation Forecasts of Exponential Smoothing
tObservedFittedResiduals
22140.551623.25517.3
32451.152140.5102731012310.639726898801
42964.452451.12614391457513.323856085432
53619.12964.41057845567654.689421544332
63764.253619.04972205607145.200277943931
741563764.23884910739391.761150892611
83374.554155.96991406226-781.419914062255
94268.553374.61001041919893.93998958081
105290.74268.481348417751022.21865158225
115635.25290.62149704828344.578502951718
125845.95635.1735375308210.726462469197
137286.055845.883816916971440.16618308303
147686.957285.93940008465401.010599915353

\begin{tabular}{lllllllll}
\hline
Interpolation Forecasts of Exponential Smoothing \tabularnewline
t & Observed & Fitted & Residuals \tabularnewline
2 & 2140.55 & 1623.25 & 517.3 \tabularnewline
3 & 2451.15 & 2140.5102731012 & 310.639726898801 \tabularnewline
4 & 2964.45 & 2451.12614391457 & 513.323856085432 \tabularnewline
5 & 3619.1 & 2964.41057845567 & 654.689421544332 \tabularnewline
6 & 3764.25 & 3619.04972205607 & 145.200277943931 \tabularnewline
7 & 4156 & 3764.23884910739 & 391.761150892611 \tabularnewline
8 & 3374.55 & 4155.96991406226 & -781.419914062255 \tabularnewline
9 & 4268.55 & 3374.61001041919 & 893.93998958081 \tabularnewline
10 & 5290.7 & 4268.48134841775 & 1022.21865158225 \tabularnewline
11 & 5635.2 & 5290.62149704828 & 344.578502951718 \tabularnewline
12 & 5845.9 & 5635.1735375308 & 210.726462469197 \tabularnewline
13 & 7286.05 & 5845.88381691697 & 1440.16618308303 \tabularnewline
14 & 7686.95 & 7285.93940008465 & 401.010599915353 \tabularnewline
\hline
\end{tabular}
%Source: https://freestatistics.org/blog/index.php?pk=299684&T=2

[TABLE]
[ROW][C]Interpolation Forecasts of Exponential Smoothing[/C][/ROW]
[ROW][C]t[/C][C]Observed[/C][C]Fitted[/C][C]Residuals[/C][/ROW]
[ROW][C]2[/C][C]2140.55[/C][C]1623.25[/C][C]517.3[/C][/ROW]
[ROW][C]3[/C][C]2451.15[/C][C]2140.5102731012[/C][C]310.639726898801[/C][/ROW]
[ROW][C]4[/C][C]2964.45[/C][C]2451.12614391457[/C][C]513.323856085432[/C][/ROW]
[ROW][C]5[/C][C]3619.1[/C][C]2964.41057845567[/C][C]654.689421544332[/C][/ROW]
[ROW][C]6[/C][C]3764.25[/C][C]3619.04972205607[/C][C]145.200277943931[/C][/ROW]
[ROW][C]7[/C][C]4156[/C][C]3764.23884910739[/C][C]391.761150892611[/C][/ROW]
[ROW][C]8[/C][C]3374.55[/C][C]4155.96991406226[/C][C]-781.419914062255[/C][/ROW]
[ROW][C]9[/C][C]4268.55[/C][C]3374.61001041919[/C][C]893.93998958081[/C][/ROW]
[ROW][C]10[/C][C]5290.7[/C][C]4268.48134841775[/C][C]1022.21865158225[/C][/ROW]
[ROW][C]11[/C][C]5635.2[/C][C]5290.62149704828[/C][C]344.578502951718[/C][/ROW]
[ROW][C]12[/C][C]5845.9[/C][C]5635.1735375308[/C][C]210.726462469197[/C][/ROW]
[ROW][C]13[/C][C]7286.05[/C][C]5845.88381691697[/C][C]1440.16618308303[/C][/ROW]
[ROW][C]14[/C][C]7686.95[/C][C]7285.93940008465[/C][C]401.010599915353[/C][/ROW]
[/TABLE]
Source: https://freestatistics.org/blog/index.php?pk=299684&T=2

Globally Unique Identifier (entire table): ba.freestatistics.org/blog/index.php?pk=299684&T=2

As an alternative you can also use a QR Code:  

The GUIDs for individual cells are displayed in the table below:

Interpolation Forecasts of Exponential Smoothing
tObservedFittedResiduals
22140.551623.25517.3
32451.152140.5102731012310.639726898801
42964.452451.12614391457513.323856085432
53619.12964.41057845567654.689421544332
63764.253619.04972205607145.200277943931
741563764.23884910739391.761150892611
83374.554155.96991406226-781.419914062255
94268.553374.61001041919893.93998958081
105290.74268.481348417751022.21865158225
115635.25290.62149704828344.578502951718
125845.95635.1735375308210.726462469197
137286.055845.883816916971440.16618308303
147686.957285.93940008465401.010599915353


Extrapolation Forecasts of Exponential Smoothing
tForecast95% Lower Bound95% Upper Bound
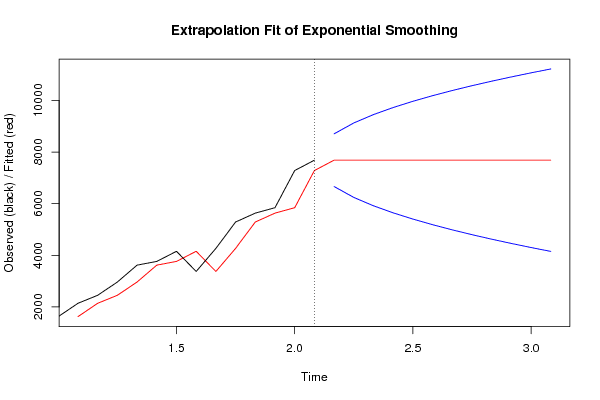
157686.91920373576666.179299878138707.65910759328
167686.91920373576243.430416649119130.4079908223
177686.91920373575919.036344052329454.80206341908
187686.91920373575645.556978975039728.28142849637
197686.91920373575404.615617488389969.22278998302
207686.91920373575186.7872898329710187.0511176384
217686.91920373574986.4730342976810387.3653731737
227686.91920373574800.0247752624310573.813632209
237686.91920373574624.9085296413710748.92987783
247686.91920373574459.2793081796410914.5590992918
257686.91920373574301.7442861719611072.0941212994
267686.91920373574151.2213730917611222.6170343796

\begin{tabular}{lllllllll}
\hline
Extrapolation Forecasts of Exponential Smoothing \tabularnewline
t & Forecast & 95% Lower Bound & 95% Upper Bound \tabularnewline
15 & 7686.9192037357 & 6666.17929987813 & 8707.65910759328 \tabularnewline
16 & 7686.9192037357 & 6243.43041664911 & 9130.4079908223 \tabularnewline
17 & 7686.9192037357 & 5919.03634405232 & 9454.80206341908 \tabularnewline
18 & 7686.9192037357 & 5645.55697897503 & 9728.28142849637 \tabularnewline
19 & 7686.9192037357 & 5404.61561748838 & 9969.22278998302 \tabularnewline
20 & 7686.9192037357 & 5186.78728983297 & 10187.0511176384 \tabularnewline
21 & 7686.9192037357 & 4986.47303429768 & 10387.3653731737 \tabularnewline
22 & 7686.9192037357 & 4800.02477526243 & 10573.813632209 \tabularnewline
23 & 7686.9192037357 & 4624.90852964137 & 10748.92987783 \tabularnewline
24 & 7686.9192037357 & 4459.27930817964 & 10914.5590992918 \tabularnewline
25 & 7686.9192037357 & 4301.74428617196 & 11072.0941212994 \tabularnewline
26 & 7686.9192037357 & 4151.22137309176 & 11222.6170343796 \tabularnewline
\hline
\end{tabular}
%Source: https://freestatistics.org/blog/index.php?pk=299684&T=3

[TABLE]
[ROW][C]Extrapolation Forecasts of Exponential Smoothing[/C][/ROW]
[ROW][C]t[/C][C]Forecast[/C][C]95% Lower Bound[/C][C]95% Upper Bound[/C][/ROW]
[ROW][C]15[/C][C]7686.9192037357[/C][C]6666.17929987813[/C][C]8707.65910759328[/C][/ROW]
[ROW][C]16[/C][C]7686.9192037357[/C][C]6243.43041664911[/C][C]9130.4079908223[/C][/ROW]
[ROW][C]17[/C][C]7686.9192037357[/C][C]5919.03634405232[/C][C]9454.80206341908[/C][/ROW]
[ROW][C]18[/C][C]7686.9192037357[/C][C]5645.55697897503[/C][C]9728.28142849637[/C][/ROW]
[ROW][C]19[/C][C]7686.9192037357[/C][C]5404.61561748838[/C][C]9969.22278998302[/C][/ROW]
[ROW][C]20[/C][C]7686.9192037357[/C][C]5186.78728983297[/C][C]10187.0511176384[/C][/ROW]
[ROW][C]21[/C][C]7686.9192037357[/C][C]4986.47303429768[/C][C]10387.3653731737[/C][/ROW]
[ROW][C]22[/C][C]7686.9192037357[/C][C]4800.02477526243[/C][C]10573.813632209[/C][/ROW]
[ROW][C]23[/C][C]7686.9192037357[/C][C]4624.90852964137[/C][C]10748.92987783[/C][/ROW]
[ROW][C]24[/C][C]7686.9192037357[/C][C]4459.27930817964[/C][C]10914.5590992918[/C][/ROW]
[ROW][C]25[/C][C]7686.9192037357[/C][C]4301.74428617196[/C][C]11072.0941212994[/C][/ROW]
[ROW][C]26[/C][C]7686.9192037357[/C][C]4151.22137309176[/C][C]11222.6170343796[/C][/ROW]
[/TABLE]
Source: https://freestatistics.org/blog/index.php?pk=299684&T=3

Globally Unique Identifier (entire table): ba.freestatistics.org/blog/index.php?pk=299684&T=3

As an alternative you can also use a QR Code:  

The GUIDs for individual cells are displayed in the table below:

Extrapolation Forecasts of Exponential Smoothing
tForecast95% Lower Bound95% Upper Bound
157686.91920373576666.179299878138707.65910759328
167686.91920373576243.430416649119130.4079908223
177686.91920373575919.036344052329454.80206341908
187686.91920373575645.556978975039728.28142849637
197686.91920373575404.615617488389969.22278998302
207686.91920373575186.7872898329710187.0511176384
217686.91920373574986.4730342976810387.3653731737
227686.91920373574800.0247752624310573.813632209
237686.91920373574624.9085296413710748.92987783
247686.91920373574459.2793081796410914.5590992918
257686.91920373574301.7442861719611072.0941212994
267686.91920373574151.2213730917611222.6170343796


Parameters (Session):
par1 = 12 ; par2 = 12 ; par3 = BFGS ;
Parameters (R input):
par1 = 12 ; par2 = Single ; par3 = additive ; par4 = 12 ;
R code (references can be found in the software module):
par1 <- as.numeric(par1)
par4 <- as.numeric(par4)
if (par2 == 'Single') K <- 1
if (par2 == 'Double') K <- 2
if (par2 == 'Triple') K <- par1
nx <- length(x)
nxmK <- nx - K
x <- ts(x, frequency = par1)
if (par2 == 'Single') fit <- HoltWinters(x, gamma=F, beta=F)
if (par2 == 'Double') fit <- HoltWinters(x, gamma=F)
if (par2 == 'Triple') fit <- HoltWinters(x, seasonal=par3)
fit
myresid <- x - fit$fitted[,'xhat']
bitmap(file='test1.png')
op <- par(mfrow=c(2,1))
plot(fit,ylab='Observed (black) / Fitted (red)',main='Interpolation Fit of Exponential Smoothing')
plot(myresid,ylab='Residuals',main='Interpolation Prediction Errors')
par(op)
dev.off()
bitmap(file='test2.png')
p <- predict(fit, par4, prediction.interval=TRUE)
np <- length(p[,1])
plot(fit,p,ylab='Observed (black) / Fitted (red)',main='Extrapolation Fit of Exponential Smoothing')
dev.off()
bitmap(file='test3.png')
op <- par(mfrow = c(2,2))
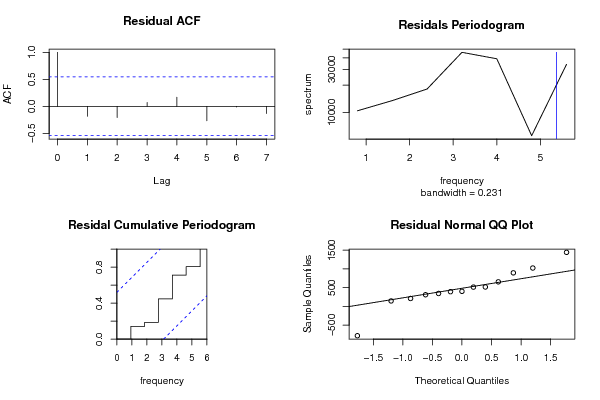
acf(as.numeric(myresid),lag.max = nx/2,main='Residual ACF')
spectrum(myresid,main='Residals Periodogram')
cpgram(myresid,main='Residal Cumulative Periodogram')
qqnorm(myresid,main='Residual Normal QQ Plot')
qqline(myresid)
par(op)
dev.off()
load(file='createtable')
a<-table.start()
a<-table.row.start(a)
a<-table.element(a,'Estimated Parameters of Exponential Smoothing',2,TRUE)
a<-table.row.end(a)
a<-table.row.start(a)
a<-table.element(a,'Parameter',header=TRUE)
a<-table.element(a,'Value',header=TRUE)
a<-table.row.end(a)
a<-table.row.start(a)
a<-table.element(a,'alpha',header=TRUE)
a<-table.element(a,fit$alpha)
a<-table.row.end(a)
a<-table.row.start(a)
a<-table.element(a,'beta',header=TRUE)
a<-table.element(a,fit$beta)
a<-table.row.end(a)
a<-table.row.start(a)
a<-table.element(a,'gamma',header=TRUE)
a<-table.element(a,fit$gamma)
a<-table.row.end(a)
a<-table.end(a)
table.save(a,file='mytable.tab')
a<-table.start()
a<-table.row.start(a)
a<-table.element(a,'Interpolation Forecasts of Exponential Smoothing',4,TRUE)
a<-table.row.end(a)
a<-table.row.start(a)
a<-table.element(a,'t',header=TRUE)
a<-table.element(a,'Observed',header=TRUE)
a<-table.element(a,'Fitted',header=TRUE)
a<-table.element(a,'Residuals',header=TRUE)
a<-table.row.end(a)
for (i in 1:nxmK) {
a<-table.row.start(a)
a<-table.element(a,i+K,header=TRUE)
a<-table.element(a,x[i+K])
a<-table.element(a,fit$fitted[i,'xhat'])
a<-table.element(a,myresid[i])
a<-table.row.end(a)
}
a<-table.end(a)
table.save(a,file='mytable1.tab')
a<-table.start()
a<-table.row.start(a)
a<-table.element(a,'Extrapolation Forecasts of Exponential Smoothing',4,TRUE)
a<-table.row.end(a)
a<-table.row.start(a)
a<-table.element(a,'t',header=TRUE)
a<-table.element(a,'Forecast',header=TRUE)
a<-table.element(a,'95% Lower Bound',header=TRUE)
a<-table.element(a,'95% Upper Bound',header=TRUE)
a<-table.row.end(a)
for (i in 1:np) {
a<-table.row.start(a)
a<-table.element(a,nx+i,header=TRUE)
a<-table.element(a,p[i,'fit'])
a<-table.element(a,p[i,'lwr'])
a<-table.element(a,p[i,'upr'])
a<-table.row.end(a)
}
a<-table.end(a)
table.save(a,file='mytable2.tab')