Free Statistics
of Irreproducible Research!
Description of Statistical Computation | ||||||||||||||||||||||||||||||||||||||||||||||||
|---|---|---|---|---|---|---|---|---|---|---|---|---|---|---|---|---|---|---|---|---|---|---|---|---|---|---|---|---|---|---|---|---|---|---|---|---|---|---|---|---|---|---|---|---|---|---|---|---|
| Author's title | ||||||||||||||||||||||||||||||||||||||||||||||||
| Author | *The author of this computation has been verified* | |||||||||||||||||||||||||||||||||||||||||||||||
| R Software Module | rwasp_fitdistrnorm.wasp | |||||||||||||||||||||||||||||||||||||||||||||||
| Title produced by software | ML Fitting and QQ Plot- Normal Distribution | |||||||||||||||||||||||||||||||||||||||||||||||
| Date of computation | Thu, 15 Dec 2016 10:27:42 +0100 | |||||||||||||||||||||||||||||||||||||||||||||||
| Cite this page as follows | Statistical Computations at FreeStatistics.org, Office for Research Development and Education, URL https://freestatistics.org/blog/index.php?v=date/2016/Dec/15/t1481794115ib056nidz2e61vk.htm/, Retrieved Fri, 03 May 2024 07:01:27 +0000 | |||||||||||||||||||||||||||||||||||||||||||||||
| Statistical Computations at FreeStatistics.org, Office for Research Development and Education, URL https://freestatistics.org/blog/index.php?pk=299788, Retrieved Fri, 03 May 2024 07:01:27 +0000 | ||||||||||||||||||||||||||||||||||||||||||||||||
| QR Codes: | ||||||||||||||||||||||||||||||||||||||||||||||||
|
| ||||||||||||||||||||||||||||||||||||||||||||||||
| Original text written by user: | ||||||||||||||||||||||||||||||||||||||||||||||||
| IsPrivate? | No (this computation is public) | |||||||||||||||||||||||||||||||||||||||||||||||
| User-defined keywords | N1910 | |||||||||||||||||||||||||||||||||||||||||||||||
| Estimated Impact | 128 | |||||||||||||||||||||||||||||||||||||||||||||||
Tree of Dependent Computations | ||||||||||||||||||||||||||||||||||||||||||||||||
| Family? (F = Feedback message, R = changed R code, M = changed R Module, P = changed Parameters, D = changed Data) | ||||||||||||||||||||||||||||||||||||||||||||||||
| - [ML Fitting and QQ Plot- Normal Distribution] [Normal distribution] [2016-12-15 09:27:42] [9a9519454d094169f95f881e5b6f16f7] [Current] - R [ML Fitting and QQ Plot- Normal Distribution] [Normal distribution ] [2016-12-15 09:28:47] [061bcad4f8cbfaa4a6cadfe6faec1e5a] - RMP [Exponential Smoothing] [Exponential smoot...] [2016-12-15 09:34:17] [061bcad4f8cbfaa4a6cadfe6faec1e5a] - RMPD [Cronbach Alpha] [Cronbach alpha] [2016-12-15 10:08:25] [061bcad4f8cbfaa4a6cadfe6faec1e5a] - RMPD [Cronbach Alpha] [Cronbach alpha IVHB] [2016-12-15 10:11:04] [061bcad4f8cbfaa4a6cadfe6faec1e5a] - RMPD [Cronbach Alpha] [Cronbach alpha be...] [2016-12-15 10:21:45] [061bcad4f8cbfaa4a6cadfe6faec1e5a] - RMPD [Cronbach Alpha] [Cronbach alpha IV...] [2016-12-15 10:28:47] [061bcad4f8cbfaa4a6cadfe6faec1e5a] - RMPD [Chi-Squared Test, McNemar Test, and Fisher Exact Test] [Chisquared simula...] [2016-12-15 10:38:18] [061bcad4f8cbfaa4a6cadfe6faec1e5a] - RMPD [Univariate Data Series] [Plot] [2016-12-21 12:13:06] [061bcad4f8cbfaa4a6cadfe6faec1e5a] - RMPD [Variance Reduction Matrix] [VRM] [2016-12-21 12:16:18] [061bcad4f8cbfaa4a6cadfe6faec1e5a] - RMPD [(Partial) Autocorrelation Function] [Partial autocorre...] [2016-12-21 12:17:37] [061bcad4f8cbfaa4a6cadfe6faec1e5a] - RMPD [Spectral Analysis] [Spectral analysis] [2016-12-21 12:19:52] [061bcad4f8cbfaa4a6cadfe6faec1e5a] - RMPD [Standard Deviation-Mean Plot] [Standard deviatio...] [2016-12-21 12:20:52] [061bcad4f8cbfaa4a6cadfe6faec1e5a] - RMPD [Exponential Smoothing] [Exponential smoot...] [2016-12-21 12:22:23] [061bcad4f8cbfaa4a6cadfe6faec1e5a] - RMPD [ARIMA Backward Selection] [Backward selectio...] [2016-12-21 12:25:13] [061bcad4f8cbfaa4a6cadfe6faec1e5a] - RMPD [ARIMA Backward Selection] [Arima backwards p...] [2016-12-21 12:27:09] [061bcad4f8cbfaa4a6cadfe6faec1e5a] - RMPD [ARIMA Forecasting] [ARIMA forecasting ] [2016-12-21 12:29:45] [061bcad4f8cbfaa4a6cadfe6faec1e5a] - RMPD [Univariate Data Series] [Plot] [2016-12-21 12:32:58] [061bcad4f8cbfaa4a6cadfe6faec1e5a] - RMPD [Variance Reduction Matrix] [VRm] [2016-12-21 12:34:04] [061bcad4f8cbfaa4a6cadfe6faec1e5a] - RMPD [(Partial) Autocorrelation Function] [Partial autocorre...] [2016-12-21 12:35:07] [061bcad4f8cbfaa4a6cadfe6faec1e5a] - RMPD [Spectral Analysis] [Spectral analysis] [2016-12-21 12:36:32] [061bcad4f8cbfaa4a6cadfe6faec1e5a] - RMPD [Standard Deviation-Mean Plot] [Standard deviatio...] [2016-12-21 12:37:50] [061bcad4f8cbfaa4a6cadfe6faec1e5a] - RMPD [Exponential Smoothing] [Exponential smoot...] [2016-12-21 12:40:01] [061bcad4f8cbfaa4a6cadfe6faec1e5a] - RMPD [(Partial) Autocorrelation Function] [Partial autocorre...] [2016-12-21 13:06:54] [061bcad4f8cbfaa4a6cadfe6faec1e5a] - RMPD [Spectral Analysis] [Spectral analysis] [2016-12-21 13:20:15] [061bcad4f8cbfaa4a6cadfe6faec1e5a] - RMPD [Chi-Squared Test, McNemar Test, and Fisher Exact Test] [a] [2017-01-22 21:09:42] [29aab2222b4b721088e78b64014cd237] - RMPD [Standard Deviation-Mean Plot] [sd mean plot] [2016-12-21 13:22:01] [061bcad4f8cbfaa4a6cadfe6faec1e5a] - RMPD [Exponential Smoothing] [Exponential smoot...] [2016-12-21 13:36:48] [061bcad4f8cbfaa4a6cadfe6faec1e5a] - RMPD [ARIMA Backward Selection] [Arima backwards] [2016-12-21 13:45:55] [061bcad4f8cbfaa4a6cadfe6faec1e5a] - RMPD [ARIMA Forecasting] [ARIMA forecast] [2016-12-21 13:49:45] [061bcad4f8cbfaa4a6cadfe6faec1e5a] - RMPD [Chi-Squared Test, McNemar Test, and Fisher Exact Test] [Chisquared pearson] [2016-12-15 10:42:04] [061bcad4f8cbfaa4a6cadfe6faec1e5a] - PD [ML Fitting and QQ Plot- Normal Distribution] [Normal distributi...] [2016-12-15 10:44:15] [061bcad4f8cbfaa4a6cadfe6faec1e5a] - R PD [ML Fitting and QQ Plot- Normal Distribution] [Normal distributi...] [2016-12-15 10:50:17] [061bcad4f8cbfaa4a6cadfe6faec1e5a] - RMPD [Notched Boxplots] [Notched bloxpot TVCD] [2016-12-15 10:55:31] [061bcad4f8cbfaa4a6cadfe6faec1e5a] - RMPD [Notched Boxplots] [IVHB notched blox...] [2016-12-15 10:59:30] [061bcad4f8cbfaa4a6cadfe6faec1e5a] - RMPD [Pearson Correlation] [Pearson correlati...] [2016-12-15 11:04:10] [061bcad4f8cbfaa4a6cadfe6faec1e5a] - RMPD [Spearman Rank Correlation] [Rang Correlatie] [2016-12-15 11:09:55] [061bcad4f8cbfaa4a6cadfe6faec1e5a] - RMPD [Multiple Regression] [Multiple regressi...] [2016-12-15 11:24:47] [061bcad4f8cbfaa4a6cadfe6faec1e5a] - R P [Multiple Regression] [] [2016-12-17 09:32:30] [32b17a345b130fdf5cc88718ed94a974] | ||||||||||||||||||||||||||||||||||||||||||||||||
| Feedback Forum | ||||||||||||||||||||||||||||||||||||||||||||||||
Post a new message | ||||||||||||||||||||||||||||||||||||||||||||||||
Dataset | ||||||||||||||||||||||||||||||||||||||||||||||||
| Dataseries X: | ||||||||||||||||||||||||||||||||||||||||||||||||
4738.4 4687.2 5930.8 5532 5429.8 6107.4 5960.8 5541.8 5362.2 5237 4827 4781.6 4983.2 4718.4 5523.8 5286.6 5389 5810.4 5057.4 5604.4 5285 5215.2 4625.4 4270.4 4685.4 4233.8 5278.4 4978.8 5333.4 5451 5224 5790.2 5079.4 4705.8 4139.6 3720.8 4594 4638.8 4969.4 4764.4 5010.8 5267.8 5312.2 5723.2 4579.6 5015.2 4282.4 3834.2 4523.4 3884.2 3897.8 4845.6 4929 4955.4 5198.4 5122.2 4643.2 4789.8 3950.8 3824.4 4511.8 4262.4 4616.6 5139.6 4972.8 5222 5242 4979.8 4691.8 4821.6 4123.6 4027.4 4365.2 4333.6 4930 5053 5031.4 5342 5191.4 4852.2 4675.6 4689.2 3809.4 4054.2 4409.6 4210.2 4566.4 4907 5021.8 5215.2 4933.6 5197.8 4734.6 4681.8 4172 4037.8 4462.6 4282.6 4962.4 4969.2 5214.6 5416.8 4764.2 5326.2 4545.4 4797.2 4259 4117 4469.2 4203.2 5033.8 4883 5361.6 5044.6 5005.6 5382 4565.4 4825 4290.2 3933.6 4177.6 3949.4 4492.6 4894.2 5224.4 5071 | ||||||||||||||||||||||||||||||||||||||||||||||||
Tables (Output of Computation) | ||||||||||||||||||||||||||||||||||||||||||||||||
| ||||||||||||||||||||||||||||||||||||||||||||||||
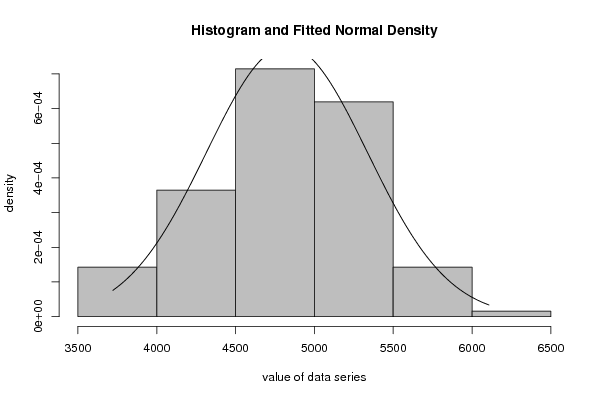
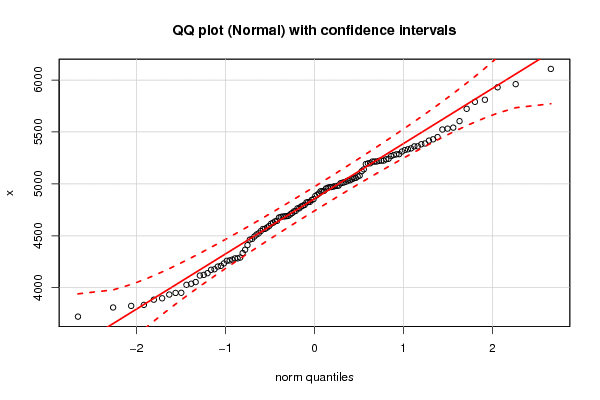
Figures (Output of Computation) | ||||||||||||||||||||||||||||||||||||||||||||||||
Input Parameters & R Code | ||||||||||||||||||||||||||||||||||||||||||||||||
| Parameters (Session): | ||||||||||||||||||||||||||||||||||||||||||||||||
| par1 = 8 ; par2 = 0 ; | ||||||||||||||||||||||||||||||||||||||||||||||||
| Parameters (R input): | ||||||||||||||||||||||||||||||||||||||||||||||||
| par1 = 8 ; par2 = 0 ; | ||||||||||||||||||||||||||||||||||||||||||||||||
| R code (references can be found in the software module): | ||||||||||||||||||||||||||||||||||||||||||||||||
library(MASS) | ||||||||||||||||||||||||||||||||||||||||||||||||