Free Statistics

of Irreproducible Research!

Author's title

Author*The author of this computation has been verified*
R Software Modulerwasp_structuraltimeseries.wasp
Title produced by softwareStructural Time Series Models
Date of computationThu, 15 Dec 2016 11:32:41 +0100
Cite this page as followsStatistical Computations at FreeStatistics.org, Office for Research Development and Education, URL https://freestatistics.org/blog/index.php?v=date/2016/Dec/15/t1481798282vmv23v8oeygx993.htm/, Retrieved Fri, 03 May 2024 04:47:38 +0000
Statistical Computations at FreeStatistics.org, Office for Research Development and Education, URL https://freestatistics.org/blog/index.php?pk=299833, Retrieved Fri, 03 May 2024 04:47:38 +0000
QR Codes:

Original text written by user:sezonaliteit= 6
IsPrivate?No (this computation is public)
User-defined keywordsf1competitie forecast
Estimated Impact61
Family? (F = Feedback message, R = changed R code, M = changed R Module, P = changed Parameters, D = changed Data)
-       [Structural Time Series Models] [Structural time s...] [2016-12-15 10:32:41] [d92250bd36540c2281a4ec15b45df1dd] [Current]
Feedback Forum

Post a new message
Dataseries X:
649
655
618
640
707
730
768
753
773
797
810
794
809
828
828
849
865
879
908
961


Summary of computational transaction
Raw Input view raw input (R code)
Raw Outputview raw output of R engine
Computing time2 seconds
R ServerBig Analytics Cloud Computing Center

\begin{tabular}{lllllllll}
\hline
Summary of computational transaction \tabularnewline
Raw Input view raw input (R code)  \tabularnewline
Raw Outputview raw output of R engine  \tabularnewline
Computing time2 seconds \tabularnewline
R ServerBig Analytics Cloud Computing Center \tabularnewline
\hline
\end{tabular}
%Source: https://freestatistics.org/blog/index.php?pk=299833&T=0

[TABLE]
[ROW]
Summary of computational transaction[/C][/ROW] [ROW]Raw Input[/C] view raw input (R code) [/C][/ROW] [ROW]Raw Output[/C]view raw output of R engine [/C][/ROW] [ROW]Computing time[/C]2 seconds[/C][/ROW] [ROW]R Server[/C]Big Analytics Cloud Computing Center[/C][/ROW] [/TABLE] Source: https://freestatistics.org/blog/index.php?pk=299833&T=0

Globally Unique Identifier (entire table): ba.freestatistics.org/blog/index.php?pk=299833&T=0

As an alternative you can also use a QR Code:  

The GUIDs for individual cells are displayed in the table below:

Summary of computational transaction
Raw Input view raw input (R code)
Raw Outputview raw output of R engine
Computing time2 seconds
R ServerBig Analytics Cloud Computing Center


Structural Time Series Model -- Interpolation
tObservedLevelSlopeSeasonalStand. Residuals
1649649000
2655654.2833100987290.7784015626454890.7166899012711550.105858158189042
3618617.622917766764-3.72861025762020.377082233236494-1.59612887514542
4640639.4279487441050.3113912263642970.5720512558951551.06349317095524
5707706.01507129198712.51563676713450.9849287080127062.71376640905092
6730728.96314226391714.61234255050431.036857736083110.422184287573887
7768764.97238258870918.40023015095893.027617411291460.978876137877045
8753754.99639472937212.1469525247837-1.99639472937185-0.956646314383218
9773775.00342911134413.8836613241592-2.003429111343860.312015067269806
10797799.01046397034216.1464474489434-2.010463970341710.401287333077716
11810812.00876867767915.4378818017855-2.00876867767916-0.124688746222713
12794795.9956600029668.32957861658269-1.99566000296563-1.24510112603353
13809799.8292936801937.340701780701399.17070631980666-0.1896388373682
14828829.17686682359412.260065649539-1.176866823593980.796228606658865
15828829.1602716215149.47059414104052-1.16027162151416-0.485116119787703
16849850.17232739137212.0935223127112-1.172327391371580.456212467708119
17865866.17548298561112.9821813835438-1.17548298561090.154578801104826
18879880.17611813983513.2137088558698-1.176118139835120.0402751884459123
19908901.19885241928914.96512708849876.80114758071070.322370844594718
20961961.3814062318825.0968566853155-0.381406231880061.68134555298897

\begin{tabular}{lllllllll}
\hline
Structural Time Series Model -- Interpolation \tabularnewline
t & Observed & Level & Slope & Seasonal & Stand. Residuals \tabularnewline
1 & 649 & 649 & 0 & 0 & 0 \tabularnewline
2 & 655 & 654.283310098729 & 0.778401562645489 & 0.716689901271155 & 0.105858158189042 \tabularnewline
3 & 618 & 617.622917766764 & -3.7286102576202 & 0.377082233236494 & -1.59612887514542 \tabularnewline
4 & 640 & 639.427948744105 & 0.311391226364297 & 0.572051255895155 & 1.06349317095524 \tabularnewline
5 & 707 & 706.015071291987 & 12.5156367671345 & 0.984928708012706 & 2.71376640905092 \tabularnewline
6 & 730 & 728.963142263917 & 14.6123425505043 & 1.03685773608311 & 0.422184287573887 \tabularnewline
7 & 768 & 764.972382588709 & 18.4002301509589 & 3.02761741129146 & 0.978876137877045 \tabularnewline
8 & 753 & 754.996394729372 & 12.1469525247837 & -1.99639472937185 & -0.956646314383218 \tabularnewline
9 & 773 & 775.003429111344 & 13.8836613241592 & -2.00342911134386 & 0.312015067269806 \tabularnewline
10 & 797 & 799.010463970342 & 16.1464474489434 & -2.01046397034171 & 0.401287333077716 \tabularnewline
11 & 810 & 812.008768677679 & 15.4378818017855 & -2.00876867767916 & -0.124688746222713 \tabularnewline
12 & 794 & 795.995660002966 & 8.32957861658269 & -1.99566000296563 & -1.24510112603353 \tabularnewline
13 & 809 & 799.829293680193 & 7.34070178070139 & 9.17070631980666 & -0.1896388373682 \tabularnewline
14 & 828 & 829.176866823594 & 12.260065649539 & -1.17686682359398 & 0.796228606658865 \tabularnewline
15 & 828 & 829.160271621514 & 9.47059414104052 & -1.16027162151416 & -0.485116119787703 \tabularnewline
16 & 849 & 850.172327391372 & 12.0935223127112 & -1.17232739137158 & 0.456212467708119 \tabularnewline
17 & 865 & 866.175482985611 & 12.9821813835438 & -1.1754829856109 & 0.154578801104826 \tabularnewline
18 & 879 & 880.176118139835 & 13.2137088558698 & -1.17611813983512 & 0.0402751884459123 \tabularnewline
19 & 908 & 901.198852419289 & 14.9651270884987 & 6.8011475807107 & 0.322370844594718 \tabularnewline
20 & 961 & 961.38140623188 & 25.0968566853155 & -0.38140623188006 & 1.68134555298897 \tabularnewline
\hline
\end{tabular}
%Source: https://freestatistics.org/blog/index.php?pk=299833&T=1

[TABLE]
[ROW][C]Structural Time Series Model -- Interpolation[/C][/ROW]
[ROW][C]t[/C][C]Observed[/C][C]Level[/C][C]Slope[/C][C]Seasonal[/C][C]Stand. Residuals[/C][/ROW]
[ROW][C]1[/C][C]649[/C][C]649[/C][C]0[/C][C]0[/C][C]0[/C][/ROW]
[ROW][C]2[/C][C]655[/C][C]654.283310098729[/C][C]0.778401562645489[/C][C]0.716689901271155[/C][C]0.105858158189042[/C][/ROW]
[ROW][C]3[/C][C]618[/C][C]617.622917766764[/C][C]-3.7286102576202[/C][C]0.377082233236494[/C][C]-1.59612887514542[/C][/ROW]
[ROW][C]4[/C][C]640[/C][C]639.427948744105[/C][C]0.311391226364297[/C][C]0.572051255895155[/C][C]1.06349317095524[/C][/ROW]
[ROW][C]5[/C][C]707[/C][C]706.015071291987[/C][C]12.5156367671345[/C][C]0.984928708012706[/C][C]2.71376640905092[/C][/ROW]
[ROW][C]6[/C][C]730[/C][C]728.963142263917[/C][C]14.6123425505043[/C][C]1.03685773608311[/C][C]0.422184287573887[/C][/ROW]
[ROW][C]7[/C][C]768[/C][C]764.972382588709[/C][C]18.4002301509589[/C][C]3.02761741129146[/C][C]0.978876137877045[/C][/ROW]
[ROW][C]8[/C][C]753[/C][C]754.996394729372[/C][C]12.1469525247837[/C][C]-1.99639472937185[/C][C]-0.956646314383218[/C][/ROW]
[ROW][C]9[/C][C]773[/C][C]775.003429111344[/C][C]13.8836613241592[/C][C]-2.00342911134386[/C][C]0.312015067269806[/C][/ROW]
[ROW][C]10[/C][C]797[/C][C]799.010463970342[/C][C]16.1464474489434[/C][C]-2.01046397034171[/C][C]0.401287333077716[/C][/ROW]
[ROW][C]11[/C][C]810[/C][C]812.008768677679[/C][C]15.4378818017855[/C][C]-2.00876867767916[/C][C]-0.124688746222713[/C][/ROW]
[ROW][C]12[/C][C]794[/C][C]795.995660002966[/C][C]8.32957861658269[/C][C]-1.99566000296563[/C][C]-1.24510112603353[/C][/ROW]
[ROW][C]13[/C][C]809[/C][C]799.829293680193[/C][C]7.34070178070139[/C][C]9.17070631980666[/C][C]-0.1896388373682[/C][/ROW]
[ROW][C]14[/C][C]828[/C][C]829.176866823594[/C][C]12.260065649539[/C][C]-1.17686682359398[/C][C]0.796228606658865[/C][/ROW]
[ROW][C]15[/C][C]828[/C][C]829.160271621514[/C][C]9.47059414104052[/C][C]-1.16027162151416[/C][C]-0.485116119787703[/C][/ROW]
[ROW][C]16[/C][C]849[/C][C]850.172327391372[/C][C]12.0935223127112[/C][C]-1.17232739137158[/C][C]0.456212467708119[/C][/ROW]
[ROW][C]17[/C][C]865[/C][C]866.175482985611[/C][C]12.9821813835438[/C][C]-1.1754829856109[/C][C]0.154578801104826[/C][/ROW]
[ROW][C]18[/C][C]879[/C][C]880.176118139835[/C][C]13.2137088558698[/C][C]-1.17611813983512[/C][C]0.0402751884459123[/C][/ROW]
[ROW][C]19[/C][C]908[/C][C]901.198852419289[/C][C]14.9651270884987[/C][C]6.8011475807107[/C][C]0.322370844594718[/C][/ROW]
[ROW][C]20[/C][C]961[/C][C]961.38140623188[/C][C]25.0968566853155[/C][C]-0.38140623188006[/C][C]1.68134555298897[/C][/ROW]
[/TABLE]
Source: https://freestatistics.org/blog/index.php?pk=299833&T=1

Globally Unique Identifier (entire table): ba.freestatistics.org/blog/index.php?pk=299833&T=1

As an alternative you can also use a QR Code:  

The GUIDs for individual cells are displayed in the table below:

Structural Time Series Model -- Interpolation
tObservedLevelSlopeSeasonalStand. Residuals
1649649000
2655654.2833100987290.7784015626454890.7166899012711550.105858158189042
3618617.622917766764-3.72861025762020.377082233236494-1.59612887514542
4640639.4279487441050.3113912263642970.5720512558951551.06349317095524
5707706.01507129198712.51563676713450.9849287080127062.71376640905092
6730728.96314226391714.61234255050431.036857736083110.422184287573887
7768764.97238258870918.40023015095893.027617411291460.978876137877045
8753754.99639472937212.1469525247837-1.99639472937185-0.956646314383218
9773775.00342911134413.8836613241592-2.003429111343860.312015067269806
10797799.01046397034216.1464474489434-2.010463970341710.401287333077716
11810812.00876867767915.4378818017855-2.00876867767916-0.124688746222713
12794795.9956600029668.32957861658269-1.99566000296563-1.24510112603353
13809799.8292936801937.340701780701399.17070631980666-0.1896388373682
14828829.17686682359412.260065649539-1.176866823593980.796228606658865
15828829.1602716215149.47059414104052-1.16027162151416-0.485116119787703
16849850.17232739137212.0935223127112-1.172327391371580.456212467708119
17865866.17548298561112.9821813835438-1.17548298561090.154578801104826
18879880.17611813983513.2137088558698-1.176118139835120.0402751884459123
19908901.19885241928914.96512708849876.80114758071070.322370844594718
20961961.3814062318825.0968566853155-0.381406231880061.68134555298897


Structural Time Series Model -- Extrapolation
tObservedLevelSeasonal
1962.578590074243976.547911558482-13.9693214842394
2991.649516857002999.166992664758-7.51747580775557
31029.879462350571021.786073771038.09338857953399
41042.601797001511044.40515487731-1.8033578758016
51075.149833024051067.024235983598.12559704046878
61096.714486637661089.643317089867.07116954779383
71098.29307671191112.26239819614-13.9693214842394
81127.364003494661134.88147930241-7.51747580775557
91165.593948988221157.500560408698.09338857953399
101178.316283639161180.11964151496-1.8033578758016
111210.864319661711202.738722621248.12559704046878
121232.428973275311225.357803727527.07116954779383

\begin{tabular}{lllllllll}
\hline
Structural Time Series Model -- Extrapolation \tabularnewline
t & Observed & Level & Seasonal \tabularnewline
1 & 962.578590074243 & 976.547911558482 & -13.9693214842394 \tabularnewline
2 & 991.649516857002 & 999.166992664758 & -7.51747580775557 \tabularnewline
3 & 1029.87946235057 & 1021.78607377103 & 8.09338857953399 \tabularnewline
4 & 1042.60179700151 & 1044.40515487731 & -1.8033578758016 \tabularnewline
5 & 1075.14983302405 & 1067.02423598359 & 8.12559704046878 \tabularnewline
6 & 1096.71448663766 & 1089.64331708986 & 7.07116954779383 \tabularnewline
7 & 1098.2930767119 & 1112.26239819614 & -13.9693214842394 \tabularnewline
8 & 1127.36400349466 & 1134.88147930241 & -7.51747580775557 \tabularnewline
9 & 1165.59394898822 & 1157.50056040869 & 8.09338857953399 \tabularnewline
10 & 1178.31628363916 & 1180.11964151496 & -1.8033578758016 \tabularnewline
11 & 1210.86431966171 & 1202.73872262124 & 8.12559704046878 \tabularnewline
12 & 1232.42897327531 & 1225.35780372752 & 7.07116954779383 \tabularnewline
\hline
\end{tabular}
%Source: https://freestatistics.org/blog/index.php?pk=299833&T=2

[TABLE]
[ROW][C]Structural Time Series Model -- Extrapolation[/C][/ROW]
[ROW][C]t[/C][C]Observed[/C][C]Level[/C][C]Seasonal[/C][/ROW]
[ROW][C]1[/C][C]962.578590074243[/C][C]976.547911558482[/C][C]-13.9693214842394[/C][/ROW]
[ROW][C]2[/C][C]991.649516857002[/C][C]999.166992664758[/C][C]-7.51747580775557[/C][/ROW]
[ROW][C]3[/C][C]1029.87946235057[/C][C]1021.78607377103[/C][C]8.09338857953399[/C][/ROW]
[ROW][C]4[/C][C]1042.60179700151[/C][C]1044.40515487731[/C][C]-1.8033578758016[/C][/ROW]
[ROW][C]5[/C][C]1075.14983302405[/C][C]1067.02423598359[/C][C]8.12559704046878[/C][/ROW]
[ROW][C]6[/C][C]1096.71448663766[/C][C]1089.64331708986[/C][C]7.07116954779383[/C][/ROW]
[ROW][C]7[/C][C]1098.2930767119[/C][C]1112.26239819614[/C][C]-13.9693214842394[/C][/ROW]
[ROW][C]8[/C][C]1127.36400349466[/C][C]1134.88147930241[/C][C]-7.51747580775557[/C][/ROW]
[ROW][C]9[/C][C]1165.59394898822[/C][C]1157.50056040869[/C][C]8.09338857953399[/C][/ROW]
[ROW][C]10[/C][C]1178.31628363916[/C][C]1180.11964151496[/C][C]-1.8033578758016[/C][/ROW]
[ROW][C]11[/C][C]1210.86431966171[/C][C]1202.73872262124[/C][C]8.12559704046878[/C][/ROW]
[ROW][C]12[/C][C]1232.42897327531[/C][C]1225.35780372752[/C][C]7.07116954779383[/C][/ROW]
[/TABLE]
Source: https://freestatistics.org/blog/index.php?pk=299833&T=2

Globally Unique Identifier (entire table): ba.freestatistics.org/blog/index.php?pk=299833&T=2

As an alternative you can also use a QR Code:  

The GUIDs for individual cells are displayed in the table below:

Structural Time Series Model -- Extrapolation
tObservedLevelSeasonal
1962.578590074243976.547911558482-13.9693214842394
2991.649516857002999.166992664758-7.51747580775557
31029.879462350571021.786073771038.09338857953399
41042.601797001511044.40515487731-1.8033578758016
51075.149833024051067.024235983598.12559704046878
61096.714486637661089.643317089867.07116954779383
71098.29307671191112.26239819614-13.9693214842394
81127.364003494661134.88147930241-7.51747580775557
91165.593948988221157.500560408698.09338857953399
101178.316283639161180.11964151496-1.8033578758016
111210.864319661711202.738722621248.12559704046878
121232.428973275311225.357803727527.07116954779383


Parameters (Session):
par4 = 12 ;
Parameters (R input):
par1 = 6 ; par2 = 12 ; par3 = BFGS ;
R code (references can be found in the software module):
require('stsm')
require('stsm.class')
require('KFKSDS')
par1 <- as.numeric(par1)
par2 <- as.numeric(par2)
nx <- length(x)
x <- ts(x,frequency=par1)
m <- StructTS(x,type='BSM')
print(m$coef)
print(m$fitted)
print(m$resid)
mylevel <- as.numeric(m$fitted[,'level'])
myslope <- as.numeric(m$fitted[,'slope'])
myseas <- as.numeric(m$fitted[,'sea'])
myresid <- as.numeric(m$resid)
myfit <- mylevel+myseas
mm <- stsm.model(model = 'BSM', y = x, transPars = 'StructTS')
fit2 <- stsmFit(mm, stsm.method = 'maxlik.td.optim', method = par3, KF.args = list(P0cov = TRUE))
(fit2.comps <- tsSmooth(fit2, P0cov = FALSE)$states)
m2 <- set.pars(mm, pmax(fit2$par, .Machine$double.eps))
(ss <- char2numeric(m2))
(pred <- predict(ss, x, n.ahead = par2))
mylagmax <- nx/2
bitmap(file='test2.png')
op <- par(mfrow = c(2,2))
acf(as.numeric(x),lag.max = mylagmax,main='Observed')
acf(mylevel,na.action=na.pass,lag.max = mylagmax,main='Level')
acf(myseas,na.action=na.pass,lag.max = mylagmax,main='Seasonal')
acf(myresid,na.action=na.pass,lag.max = mylagmax,main='Standardized Residals')
par(op)
dev.off()
bitmap(file='test3.png')
op <- par(mfrow = c(2,2))
spectrum(as.numeric(x),main='Observed')
spectrum(mylevel,main='Level')
spectrum(myseas,main='Seasonal')
spectrum(myresid,main='Standardized Residals')
par(op)
dev.off()
bitmap(file='test4.png')
op <- par(mfrow = c(2,2))
cpgram(as.numeric(x),main='Observed')
cpgram(mylevel,main='Level')
cpgram(myseas,main='Seasonal')
cpgram(myresid,main='Standardized Residals')
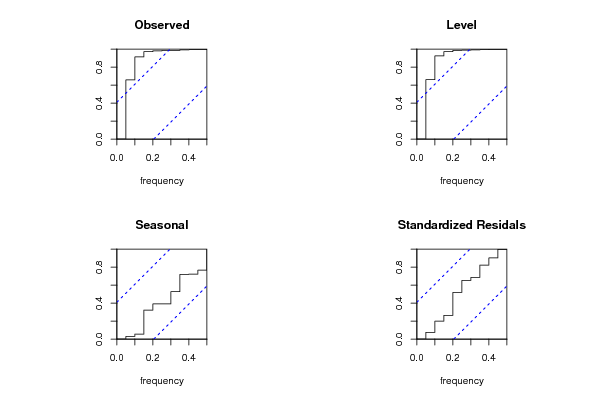
par(op)
dev.off()
bitmap(file='test1.png')
plot(as.numeric(m$resid),main='Standardized Residuals',ylab='Residuals',xlab='time',type='b')
grid()
dev.off()
bitmap(file='test5.png')
op <- par(mfrow = c(2,2))
hist(m$resid,main='Residual Histogram')
plot(density(m$resid),main='Residual Kernel Density')
qqnorm(m$resid,main='Residual Normal QQ Plot')
qqline(m$resid)
plot(m$resid^2, myfit^2,main='Sq.Resid vs. Sq.Fit',xlab='Squared residuals',ylab='Squared Fit')
par(op)
dev.off()
bitmap(file='test6.png')
par(mfrow = c(3,1), mar = c(3,3,3,3))
plot(cbind(x, pred$pred), type = 'n', plot.type = 'single', ylab = '')
lines(x)
polygon(c(time(pred$pred), rev(time(pred$pred))), c(pred$pred + 2 * pred$se, rev(pred$pred)), col = 'gray85', border = NA)
polygon(c(time(pred$pred), rev(time(pred$pred))), c(pred$pred - 2 * pred$se, rev(pred$pred)), col = ' gray85', border = NA)
lines(pred$pred, col = 'blue', lwd = 1.5)
mtext(text = 'forecasts of the observed series', side = 3, adj = 0)
plot(cbind(x, pred$a[,1]), type = 'n', plot.type = 'single', ylab = '')
lines(x)
polygon(c(time(pred$a[,1]), rev(time(pred$a[,1]))), c(pred$a[,1] + 2 * sqrt(pred$P[,1]), rev(pred$a[,1])), col = 'gray85', border = NA)
polygon(c(time(pred$a[,1]), rev(time(pred$a[,1]))), c(pred$a[,1] - 2 * sqrt(pred$P[,1]), rev(pred$a[,1])), col = ' gray85', border = NA)
lines(pred$a[,1], col = 'blue', lwd = 1.5)
mtext(text = 'forecasts of the level component', side = 3, adj = 0)
plot(cbind(fit2.comps[,3], pred$a[,3]), type = 'n', plot.type = 'single', ylab = '')
lines(fit2.comps[,3])
polygon(c(time(pred$a[,3]), rev(time(pred$a[,3]))), c(pred$a[,3] + 2 * sqrt(pred$P[,3]), rev(pred$a[,3])), col = 'gray85', border = NA)
polygon(c(time(pred$a[,3]), rev(time(pred$a[,3]))), c(pred$a[,3] - 2 * sqrt(pred$P[,3]), rev(pred$a[,3])), col = ' gray85', border = NA)
lines(pred$a[,3], col = 'blue', lwd = 1.5)
mtext(text = 'forecasts of the seasonal component', side = 3, adj = 0)
dev.off()
load(file='createtable')
a<-table.start()
a<-table.row.start(a)
a<-table.element(a,'Structural Time Series Model -- Interpolation',6,TRUE)
a<-table.row.end(a)
a<-table.row.start(a)
a<-table.element(a,'t',header=TRUE)
a<-table.element(a,'Observed',header=TRUE)
a<-table.element(a,'Level',header=TRUE)
a<-table.element(a,'Slope',header=TRUE)
a<-table.element(a,'Seasonal',header=TRUE)
a<-table.element(a,'Stand. Residuals',header=TRUE)
a<-table.row.end(a)
for (i in 1:nx) {
a<-table.row.start(a)
a<-table.element(a,i,header=TRUE)
a<-table.element(a,x[i])
a<-table.element(a,mylevel[i])
a<-table.element(a,myslope[i])
a<-table.element(a,myseas[i])
a<-table.element(a,myresid[i])
a<-table.row.end(a)
}
a<-table.end(a)
table.save(a,file='mytable.tab')
a<-table.start()
a<-table.row.start(a)
a<-table.element(a,'Structural Time Series Model -- Extrapolation',4,TRUE)
a<-table.row.end(a)
a<-table.row.start(a)
a<-table.element(a,'t',header=TRUE)
a<-table.element(a,'Observed',header=TRUE)
a<-table.element(a,'Level',header=TRUE)
a<-table.element(a,'Seasonal',header=TRUE)
a<-table.row.end(a)
for (i in 1:par2) {
a<-table.row.start(a)
a<-table.element(a,i,header=TRUE)
a<-table.element(a,pred$pred[i])
a<-table.element(a,pred$a[i,1])
a<-table.element(a,pred$a[i,3])
a<-table.row.end(a)
}
a<-table.end(a)
table.save(a,file='mytable1.tab')