Free Statistics

of Irreproducible Research!

Author's title

Author*The author of this computation has been verified*
R Software Modulerwasp_smp.wasp
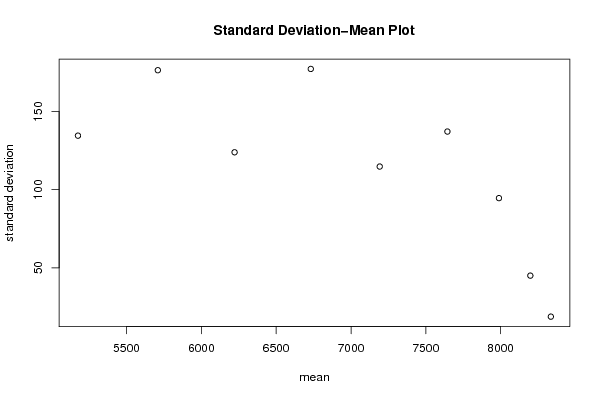
Title produced by softwareStandard Deviation-Mean Plot
Date of computationThu, 15 Dec 2016 16:49:25 +0100
Cite this page as followsStatistical Computations at FreeStatistics.org, Office for Research Development and Education, URL https://freestatistics.org/blog/index.php?v=date/2016/Dec/15/t1481817947vzc888t9nv6e0um.htm/, Retrieved Fri, 03 May 2024 13:52:23 +0000
Statistical Computations at FreeStatistics.org, Office for Research Development and Education, URL https://freestatistics.org/blog/index.php?pk=299927, Retrieved Fri, 03 May 2024 13:52:23 +0000
QR Codes:

Original text written by user:
IsPrivate?No (this computation is public)
User-defined keywords
Estimated Impact65
Family? (F = Feedback message, R = changed R code, M = changed R Module, P = changed Parameters, D = changed Data)
-     [Notched Boxplots] [NOTCHED BOXPLOT 2] [2016-12-15 13:40:33] [cc27e22d0f988231a683c07437a6fc03]
- RM D    [Standard Deviation-Mean Plot] [Standard deviatio...] [2016-12-15 15:49:25] [7735a6b2a5b1338702c07df744ef5a34] [Current]
Feedback Forum

Post a new message
Dataseries X:
4956
5014.8
5053
5092.2
5126
5160
5188.8
5219.4
5255.6
5297
5349.8
5392.4
5429.8
5483.2
5540
5594.4
5650.2
5694
5741.8
5773.6
5816.8
5869.2
5927
5989.2
6038.8
6080.6
6111
6122.6
6154.4
6207
6231.2
6268.4
6309
6342.6
6376
6423.2
6465.2
6499.8
6552.2
6613.6
6658.6
6699.4
6763.4
6814.8
6869.4
6907.6
6936
6994.6
7043.2
7056.2
7068
7106.6
7141.2
7168.2
7184.6
7229.2
7273.4
7320.6
7350
7362.6
7411.2
7465.4
7510.2
7558.8
7605.4
7642.8
7681.6
7705
7729.8
7768.8
7810.4
7840.8
7855.4
7863.6
7904.4
7922.8
7929.4
7968
8018.6
8032.8
8052.6
8075.8
8106.4
8134.6
8140.6
8140
8152.2
8167.2
8166.6
8185
8203.8
8233.6
8251.6
8252.2
8235.6
8251.4
8293.8
8329.8
8342.4
8351.4
8347.8
8349.4
8337
8326
8313
8327.4
8346.4
8360.8
8374.6
8406
8406.2
8381.4
8379.8
8367.4
8372
8393.4


Summary of computational transaction
Raw Input view raw input (R code)
Raw Outputview raw output of R engine
Computing time1 seconds
R ServerBig Analytics Cloud Computing Center

\begin{tabular}{lllllllll}
\hline
Summary of computational transaction \tabularnewline
Raw Input view raw input (R code)  \tabularnewline
Raw Outputview raw output of R engine  \tabularnewline
Computing time1 seconds \tabularnewline
R ServerBig Analytics Cloud Computing Center \tabularnewline
\hline
\end{tabular}
%Source: https://freestatistics.org/blog/index.php?pk=299927&T=0

[TABLE]
[ROW]
Summary of computational transaction[/C][/ROW] [ROW]Raw Input[/C] view raw input (R code) [/C][/ROW] [ROW]Raw Output[/C]view raw output of R engine [/C][/ROW] [ROW]Computing time[/C]1 seconds[/C][/ROW] [ROW]R Server[/C]Big Analytics Cloud Computing Center[/C][/ROW] [/TABLE] Source: https://freestatistics.org/blog/index.php?pk=299927&T=0

Globally Unique Identifier (entire table): ba.freestatistics.org/blog/index.php?pk=299927&T=0

As an alternative you can also use a QR Code:  

The GUIDs for individual cells are displayed in the table below:

Summary of computational transaction
Raw Input view raw input (R code)
Raw Outputview raw output of R engine
Computing time1 seconds
R ServerBig Analytics Cloud Computing Center


Standard Deviation-Mean Plot
SectionMeanStandard DeviationRange
15175.41666666667134.620259405575436.4
25709.1176.554055590503559.4
36222.06666666667123.987047221828384.4
46731.21666666667177.359244233706529.400000000001
57191.98333333333114.839887221164319.400000000001
67644.18333333333137.257858416084429.6
77988.794.6100705767915279.200000000001
88198.3166666666744.9603023552867112.200000000001
98335.4333333333318.682774435454267

\begin{tabular}{lllllllll}
\hline
Standard Deviation-Mean Plot \tabularnewline
Section & Mean & Standard Deviation & Range \tabularnewline
1 & 5175.41666666667 & 134.620259405575 & 436.4 \tabularnewline
2 & 5709.1 & 176.554055590503 & 559.4 \tabularnewline
3 & 6222.06666666667 & 123.987047221828 & 384.4 \tabularnewline
4 & 6731.21666666667 & 177.359244233706 & 529.400000000001 \tabularnewline
5 & 7191.98333333333 & 114.839887221164 & 319.400000000001 \tabularnewline
6 & 7644.18333333333 & 137.257858416084 & 429.6 \tabularnewline
7 & 7988.7 & 94.6100705767915 & 279.200000000001 \tabularnewline
8 & 8198.31666666667 & 44.9603023552867 & 112.200000000001 \tabularnewline
9 & 8335.43333333333 & 18.6827744354542 & 67 \tabularnewline
\hline
\end{tabular}
%Source: https://freestatistics.org/blog/index.php?pk=299927&T=1

[TABLE]
[ROW][C]Standard Deviation-Mean Plot[/C][/ROW]
[ROW][C]Section[/C][C]Mean[/C][C]Standard Deviation[/C][C]Range[/C][/ROW]
[ROW][C]1[/C][C]5175.41666666667[/C][C]134.620259405575[/C][C]436.4[/C][/ROW]
[ROW][C]2[/C][C]5709.1[/C][C]176.554055590503[/C][C]559.4[/C][/ROW]
[ROW][C]3[/C][C]6222.06666666667[/C][C]123.987047221828[/C][C]384.4[/C][/ROW]
[ROW][C]4[/C][C]6731.21666666667[/C][C]177.359244233706[/C][C]529.400000000001[/C][/ROW]
[ROW][C]5[/C][C]7191.98333333333[/C][C]114.839887221164[/C][C]319.400000000001[/C][/ROW]
[ROW][C]6[/C][C]7644.18333333333[/C][C]137.257858416084[/C][C]429.6[/C][/ROW]
[ROW][C]7[/C][C]7988.7[/C][C]94.6100705767915[/C][C]279.200000000001[/C][/ROW]
[ROW][C]8[/C][C]8198.31666666667[/C][C]44.9603023552867[/C][C]112.200000000001[/C][/ROW]
[ROW][C]9[/C][C]8335.43333333333[/C][C]18.6827744354542[/C][C]67[/C][/ROW]
[/TABLE]
Source: https://freestatistics.org/blog/index.php?pk=299927&T=1

Globally Unique Identifier (entire table): ba.freestatistics.org/blog/index.php?pk=299927&T=1

As an alternative you can also use a QR Code:  

The GUIDs for individual cells are displayed in the table below:

Standard Deviation-Mean Plot
SectionMeanStandard DeviationRange
15175.41666666667134.620259405575436.4
25709.1176.554055590503559.4
36222.06666666667123.987047221828384.4
46731.21666666667177.359244233706529.400000000001
57191.98333333333114.839887221164319.400000000001
67644.18333333333137.257858416084429.6
77988.794.6100705767915279.200000000001
88198.3166666666744.9603023552867112.200000000001
98335.4333333333318.682774435454267


Regression: S.E.(k) = alpha + beta * Mean(k)
alpha356.725141299038
beta-0.0346167534114136
S.D.0.0122609897531261
T-STAT-2.82332455278233
p-value0.0256506169361002

\begin{tabular}{lllllllll}
\hline
Regression: S.E.(k) = alpha + beta * Mean(k) \tabularnewline
alpha & 356.725141299038 \tabularnewline
beta & -0.0346167534114136 \tabularnewline
S.D. & 0.0122609897531261 \tabularnewline
T-STAT & -2.82332455278233 \tabularnewline
p-value & 0.0256506169361002 \tabularnewline
\hline
\end{tabular}
%Source: https://freestatistics.org/blog/index.php?pk=299927&T=2

[TABLE]
[ROW][C]Regression: S.E.(k) = alpha + beta * Mean(k)[/C][/ROW]
[ROW][C]alpha[/C][C]356.725141299038[/C][/ROW]
[ROW][C]beta[/C][C]-0.0346167534114136[/C][/ROW]
[ROW][C]S.D.[/C][C]0.0122609897531261[/C][/ROW]
[ROW][C]T-STAT[/C][C]-2.82332455278233[/C][/ROW]
[ROW][C]p-value[/C][C]0.0256506169361002[/C][/ROW]
[/TABLE]
Source: https://freestatistics.org/blog/index.php?pk=299927&T=2

Globally Unique Identifier (entire table): ba.freestatistics.org/blog/index.php?pk=299927&T=2

As an alternative you can also use a QR Code:  

The GUIDs for individual cells are displayed in the table below:

Regression: S.E.(k) = alpha + beta * Mean(k)
alpha356.725141299038
beta-0.0346167534114136
S.D.0.0122609897531261
T-STAT-2.82332455278233
p-value0.0256506169361002


Regression: ln S.E.(k) = alpha + beta * ln Mean(k)
alpha29.7722227043788
beta-2.85084118810229
S.D.1.2449999226175
T-STAT-2.2898324219239
p-value0.0558213133806506
Lambda3.85084118810229

\begin{tabular}{lllllllll}
\hline
Regression: ln S.E.(k) = alpha + beta * ln Mean(k) \tabularnewline
alpha & 29.7722227043788 \tabularnewline
beta & -2.85084118810229 \tabularnewline
S.D. & 1.2449999226175 \tabularnewline
T-STAT & -2.2898324219239 \tabularnewline
p-value & 0.0558213133806506 \tabularnewline
Lambda & 3.85084118810229 \tabularnewline
\hline
\end{tabular}
%Source: https://freestatistics.org/blog/index.php?pk=299927&T=3

[TABLE]
[ROW][C]Regression: ln S.E.(k) = alpha + beta * ln Mean(k)[/C][/ROW]
[ROW][C]alpha[/C][C]29.7722227043788[/C][/ROW]
[ROW][C]beta[/C][C]-2.85084118810229[/C][/ROW]
[ROW][C]S.D.[/C][C]1.2449999226175[/C][/ROW]
[ROW][C]T-STAT[/C][C]-2.2898324219239[/C][/ROW]
[ROW][C]p-value[/C][C]0.0558213133806506[/C][/ROW]
[ROW][C]Lambda[/C][C]3.85084118810229[/C][/ROW]
[/TABLE]
Source: https://freestatistics.org/blog/index.php?pk=299927&T=3

Globally Unique Identifier (entire table): ba.freestatistics.org/blog/index.php?pk=299927&T=3

As an alternative you can also use a QR Code:  

The GUIDs for individual cells are displayed in the table below:

Regression: ln S.E.(k) = alpha + beta * ln Mean(k)
alpha29.7722227043788
beta-2.85084118810229
S.D.1.2449999226175
T-STAT-2.2898324219239
p-value0.0558213133806506
Lambda3.85084118810229


Parameters (Session):
Parameters (R input):
par1 = 12 ;
R code (references can be found in the software module):
par1 <- as.numeric(par1)
(n <- length(x))
(np <- floor(n / par1))
arr <- array(NA,dim=c(par1,np))
j <- 0
k <- 1
for (i in 1:(np*par1))
{
j = j + 1
arr[j,k] <- x[i]
if (j == par1) {
j = 0
k=k+1
}
}
arr
arr.mean <- array(NA,dim=np)
arr.sd <- array(NA,dim=np)
arr.range <- array(NA,dim=np)
for (j in 1:np)
{
arr.mean[j] <- mean(arr[,j],na.rm=TRUE)
arr.sd[j] <- sd(arr[,j],na.rm=TRUE)
arr.range[j] <- max(arr[,j],na.rm=TRUE) - min(arr[,j],na.rm=TRUE)
}
arr.mean
arr.sd
arr.range
(lm1 <- lm(arr.sd~arr.mean))
(lnlm1 <- lm(log(arr.sd)~log(arr.mean)))
(lm2 <- lm(arr.range~arr.mean))
bitmap(file='test1.png')
plot(arr.mean,arr.sd,main='Standard Deviation-Mean Plot',xlab='mean',ylab='standard deviation')
dev.off()
bitmap(file='test2.png')
plot(arr.mean,arr.range,main='Range-Mean Plot',xlab='mean',ylab='range')
dev.off()
load(file='createtable')
a<-table.start()
a<-table.row.start(a)
a<-table.element(a,'Standard Deviation-Mean Plot',4,TRUE)
a<-table.row.end(a)
a<-table.row.start(a)
a<-table.element(a,'Section',header=TRUE)
a<-table.element(a,'Mean',header=TRUE)
a<-table.element(a,'Standard Deviation',header=TRUE)
a<-table.element(a,'Range',header=TRUE)
a<-table.row.end(a)
for (j in 1:np) {
a<-table.row.start(a)
a<-table.element(a,j,header=TRUE)
a<-table.element(a,arr.mean[j])
a<-table.element(a,arr.sd[j] )
a<-table.element(a,arr.range[j] )
a<-table.row.end(a)
}
a<-table.end(a)
table.save(a,file='mytable.tab')
a<-table.start()
a<-table.row.start(a)
a<-table.element(a,'Regression: S.E.(k) = alpha + beta * Mean(k)',2,TRUE)
a<-table.row.end(a)
a<-table.row.start(a)
a<-table.element(a,'alpha',header=TRUE)
a<-table.element(a,lm1$coefficients[[1]])
a<-table.row.end(a)
a<-table.row.start(a)
a<-table.element(a,'beta',header=TRUE)
a<-table.element(a,lm1$coefficients[[2]])
a<-table.row.end(a)
a<-table.row.start(a)
a<-table.element(a,'S.D.',header=TRUE)
a<-table.element(a,summary(lm1)$coefficients[2,2])
a<-table.row.end(a)
a<-table.row.start(a)
a<-table.element(a,'T-STAT',header=TRUE)
a<-table.element(a,summary(lm1)$coefficients[2,3])
a<-table.row.end(a)
a<-table.row.start(a)
a<-table.element(a,'p-value',header=TRUE)
a<-table.element(a,summary(lm1)$coefficients[2,4])
a<-table.row.end(a)
a<-table.end(a)
table.save(a,file='mytable1.tab')
a<-table.start()
a<-table.row.start(a)
a<-table.element(a,'Regression: ln S.E.(k) = alpha + beta * ln Mean(k)',2,TRUE)
a<-table.row.end(a)
a<-table.row.start(a)
a<-table.element(a,'alpha',header=TRUE)
a<-table.element(a,lnlm1$coefficients[[1]])
a<-table.row.end(a)
a<-table.row.start(a)
a<-table.element(a,'beta',header=TRUE)
a<-table.element(a,lnlm1$coefficients[[2]])
a<-table.row.end(a)
a<-table.row.start(a)
a<-table.element(a,'S.D.',header=TRUE)
a<-table.element(a,summary(lnlm1)$coefficients[2,2])
a<-table.row.end(a)
a<-table.row.start(a)
a<-table.element(a,'T-STAT',header=TRUE)
a<-table.element(a,summary(lnlm1)$coefficients[2,3])
a<-table.row.end(a)
a<-table.row.start(a)
a<-table.element(a,'p-value',header=TRUE)
a<-table.element(a,summary(lnlm1)$coefficients[2,4])
a<-table.row.end(a)
a<-table.row.start(a)
a<-table.element(a,'Lambda',header=TRUE)
a<-table.element(a,1-lnlm1$coefficients[[2]])
a<-table.row.end(a)
a<-table.end(a)
table.save(a,file='mytable2.tab')