Free Statistics

of Irreproducible Research!

Author's title

Author*The author of this computation has been verified*
R Software Modulerwasp_arimabackwardselection.wasp
Title produced by softwareARIMA Backward Selection
Date of computationThu, 15 Dec 2016 21:22:10 +0100
Cite this page as followsStatistical Computations at FreeStatistics.org, Office for Research Development and Education, URL https://freestatistics.org/blog/index.php?v=date/2016/Dec/15/t1481833455b3pch1grqveuqny.htm/, Retrieved Fri, 03 May 2024 11:55:36 +0000
Statistical Computations at FreeStatistics.org, Office for Research Development and Education, URL https://freestatistics.org/blog/index.php?pk=299996, Retrieved Fri, 03 May 2024 11:55:36 +0000
QR Codes:

Original text written by user:
IsPrivate?No (this computation is public)
User-defined keywords
Estimated Impact52
Family? (F = Feedback message, R = changed R code, M = changed R Module, P = changed Parameters, D = changed Data)
-       [ARIMA Backward Selection] [] [2016-12-15 20:22:10] [219800a2f11ddd28e3280d87dbde8c8d] [Current]
Feedback Forum

Post a new message
Dataseries X:
4778
4838
4899
4935
4995
5032
5083
5104
5127
5180
5193
5210
5251
5275
5309
5339
5363
5402
5410
5408
5441
5438
5474
5521
5561
5632
5666
5699
5748
5833
5892
5965
6040
6077
6126
6199
6209
6252
6338
6411
6520
6611
6703
6799
6874
6950
7066
7245
7302
7310
7336
7436
7468
7430
7430
7460
7481
7568
7537
7501
7576
7582
7618
7690
7723
7789
7831
7837
7838
7848
7856
7874
7864
7847
7834
7805
7754
7738
7792
7798
7821
7875
7886
7947
7959
7988
8023
8066
8052
8108
8110
8166
8222
8204
8225
8264
8275
8337
8407
8427
8497
8592
8622
8679
8714
8781
8891
8977
9110
9273
9378
9437
9527
9547
9642
9761


Summary of computational transaction
Raw Input view raw input (R code)
Raw Outputview raw output of R engine
Computing time2 seconds
R ServerBig Analytics Cloud Computing Center

\begin{tabular}{lllllllll}
\hline
Summary of computational transaction \tabularnewline
Raw Input view raw input (R code)  \tabularnewline
Raw Outputview raw output of R engine  \tabularnewline
Computing time2 seconds \tabularnewline
R ServerBig Analytics Cloud Computing Center \tabularnewline
\hline
\end{tabular}
%Source: https://freestatistics.org/blog/index.php?pk=299996&T=0

[TABLE]
[ROW]
Summary of computational transaction[/C][/ROW] [ROW]Raw Input[/C] view raw input (R code) [/C][/ROW] [ROW]Raw Output[/C]view raw output of R engine [/C][/ROW] [ROW]Computing time[/C]2 seconds[/C][/ROW] [ROW]R Server[/C]Big Analytics Cloud Computing Center[/C][/ROW] [/TABLE] Source: https://freestatistics.org/blog/index.php?pk=299996&T=0

Globally Unique Identifier (entire table): ba.freestatistics.org/blog/index.php?pk=299996&T=0

As an alternative you can also use a QR Code:  

The GUIDs for individual cells are displayed in the table below:

Summary of computational transaction
Raw Input view raw input (R code)
Raw Outputview raw output of R engine
Computing time2 seconds
R ServerBig Analytics Cloud Computing Center


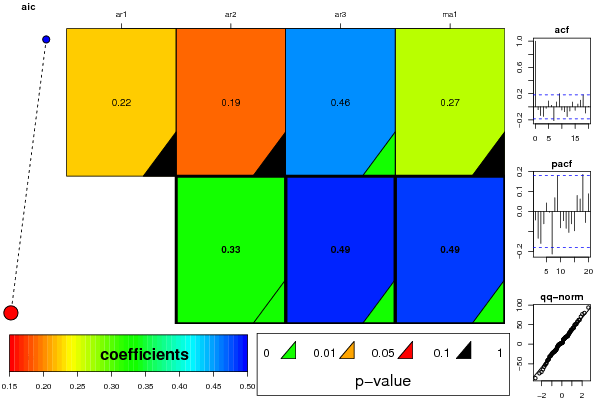
ARIMA Parameter Estimation and Backward Selection
Iterationar1ar2ar3ma1
Estimates ( 1 )0.22190.19090.45590.2676
(p-val)(0.4062 )(0.2931 )(0 )(0.3876 )
Estimates ( 2 )00.32590.49220.4858
(p-val)(NA )(2e-04 )(0 )(0 )
Estimates ( 3 )NANANANA
(p-val)(NA )(NA )(NA )(NA )
Estimates ( 4 )NANANANA
(p-val)(NA )(NA )(NA )(NA )
Estimates ( 5 )NANANANA
(p-val)(NA )(NA )(NA )(NA )
Estimates ( 6 )NANANANA
(p-val)(NA )(NA )(NA )(NA )
Estimates ( 7 )NANANANA
(p-val)(NA )(NA )(NA )(NA )

\begin{tabular}{lllllllll}
\hline
ARIMA Parameter Estimation and Backward Selection \tabularnewline
Iteration & ar1 & ar2 & ar3 & ma1 \tabularnewline
Estimates ( 1 ) & 0.2219 & 0.1909 & 0.4559 & 0.2676 \tabularnewline
(p-val) & (0.4062 ) & (0.2931 ) & (0 ) & (0.3876 ) \tabularnewline
Estimates ( 2 ) & 0 & 0.3259 & 0.4922 & 0.4858 \tabularnewline
(p-val) & (NA ) & (2e-04 ) & (0 ) & (0 ) \tabularnewline
Estimates ( 3 ) & NA & NA & NA & NA \tabularnewline
(p-val) & (NA ) & (NA ) & (NA ) & (NA ) \tabularnewline
Estimates ( 4 ) & NA & NA & NA & NA \tabularnewline
(p-val) & (NA ) & (NA ) & (NA ) & (NA ) \tabularnewline
Estimates ( 5 ) & NA & NA & NA & NA \tabularnewline
(p-val) & (NA ) & (NA ) & (NA ) & (NA ) \tabularnewline
Estimates ( 6 ) & NA & NA & NA & NA \tabularnewline
(p-val) & (NA ) & (NA ) & (NA ) & (NA ) \tabularnewline
Estimates ( 7 ) & NA & NA & NA & NA \tabularnewline
(p-val) & (NA ) & (NA ) & (NA ) & (NA ) \tabularnewline
\hline
\end{tabular}
%Source: https://freestatistics.org/blog/index.php?pk=299996&T=1

[TABLE]
[ROW][C]ARIMA Parameter Estimation and Backward Selection[/C][/ROW]
[ROW][C]Iteration[/C][C]ar1[/C][C]ar2[/C][C]ar3[/C][C]ma1[/C][/ROW]
[ROW][C]Estimates ( 1 )[/C][C]0.2219[/C][C]0.1909[/C][C]0.4559[/C][C]0.2676[/C][/ROW]
[ROW][C](p-val)[/C][C](0.4062 )[/C][C](0.2931 )[/C][C](0 )[/C][C](0.3876 )[/C][/ROW]
[ROW][C]Estimates ( 2 )[/C][C]0[/C][C]0.3259[/C][C]0.4922[/C][C]0.4858[/C][/ROW]
[ROW][C](p-val)[/C][C](NA )[/C][C](2e-04 )[/C][C](0 )[/C][C](0 )[/C][/ROW]
[ROW][C]Estimates ( 3 )[/C][C]NA[/C][C]NA[/C][C]NA[/C][C]NA[/C][/ROW]
[ROW][C](p-val)[/C][C](NA )[/C][C](NA )[/C][C](NA )[/C][C](NA )[/C][/ROW]
[ROW][C]Estimates ( 4 )[/C][C]NA[/C][C]NA[/C][C]NA[/C][C]NA[/C][/ROW]
[ROW][C](p-val)[/C][C](NA )[/C][C](NA )[/C][C](NA )[/C][C](NA )[/C][/ROW]
[ROW][C]Estimates ( 5 )[/C][C]NA[/C][C]NA[/C][C]NA[/C][C]NA[/C][/ROW]
[ROW][C](p-val)[/C][C](NA )[/C][C](NA )[/C][C](NA )[/C][C](NA )[/C][/ROW]
[ROW][C]Estimates ( 6 )[/C][C]NA[/C][C]NA[/C][C]NA[/C][C]NA[/C][/ROW]
[ROW][C](p-val)[/C][C](NA )[/C][C](NA )[/C][C](NA )[/C][C](NA )[/C][/ROW]
[ROW][C]Estimates ( 7 )[/C][C]NA[/C][C]NA[/C][C]NA[/C][C]NA[/C][/ROW]
[ROW][C](p-val)[/C][C](NA )[/C][C](NA )[/C][C](NA )[/C][C](NA )[/C][/ROW]
[/TABLE]
Source: https://freestatistics.org/blog/index.php?pk=299996&T=1

Globally Unique Identifier (entire table): ba.freestatistics.org/blog/index.php?pk=299996&T=1

As an alternative you can also use a QR Code:  

The GUIDs for individual cells are displayed in the table below:

ARIMA Parameter Estimation and Backward Selection
Iterationar1ar2ar3ma1
Estimates ( 1 )0.22190.19090.45590.2676
(p-val)(0.4062 )(0.2931 )(0 )(0.3876 )
Estimates ( 2 )00.32590.49220.4858
(p-val)(NA )(2e-04 )(0 )(0 )
Estimates ( 3 )NANANANA
(p-val)(NA )(NA )(NA )(NA )
Estimates ( 4 )NANANANA
(p-val)(NA )(NA )(NA )(NA )
Estimates ( 5 )NANANANA
(p-val)(NA )(NA )(NA )(NA )
Estimates ( 6 )NANANANA
(p-val)(NA )(NA )(NA )(NA )
Estimates ( 7 )NANANANA
(p-val)(NA )(NA )(NA )(NA )


Estimated ARIMA Residuals
Value
4.77799208371942
32.954089314259
12.4830488193953
-13.7995268048031
16.2925161981768
-15.3273504225423
19.0210702727253
-29.8262493719092
-0.284473836829521
20.7105300803447
-18.2688121194561
-1.59977100680317
11.0091695857124
2.78283380477854
12.3523827818369
-4.12515394876208
1.01348097432765
12.1744112635688
-22.1719845746084
-16.2295556003082
18.4777921627801
-18.5337416195653
36.2379113861316
14.8411447317194
20.0944130957359
31.3615354701205
-19.212553059383
-1.19458990716885
3.13463880866766
51.4856548510124
1.96122985613238
20.8161300768415
3.2130588914315
-21.3388894021873
-1.10081957262082
21.1620879438033
-38.0859911535817
14.6966114188226
37.3323407503631
31.1577375773231
48.4420122130041
0.703574166657745
17.5271654301205
3.82594588535721
-6.38007284201012
0.792040638149956
40.835607688151
93.6277583019055
-64.5700742201316
-74.4282697641402
-48.3536440990565
79.651403326211
-20.1155243535868
-70.6611191409984
-24.3616009808902
29.1810074932992
23.8596721500089
70.2294477358009
-86.7855902700076
-32.0798320122176
57.8236259662917
-5.11169012777918
38.1347147723518
18.466609205313
2.47235976947377
27.8583577652598
-19.2278444635658
-25.820193759233
-31.5314211320001
-2.08005209301336
3.41059725220475
12.9473307907028
-23.5453890177723
-15.5639515433759
-11.3609072776662
-15.2710026814148
-30.2456355639051
14.8737865040903
76.5278343308873
-0.153825215361394
18.6977042007793
18.1269628911014
-12.9604975441689
41.2329973496571
-39.2906855940819
20.1909379538301
-6.94096397596513
26.0826743966609
-50.4245535668424
48.4335725196825
-40.3205808260009
62.0386354020047
1.05834375801805
-42.3124429396485
0.0950566113660898
12.2169548236525
3.27408703979927
41.6642304103116
25.2110092166331
-19.1304092016253
29.0509746095631
35.9584043296
-23.184882024585
6.49719584749073
-28.4289833312341
42.2808123131072
51.148721666752
19.1552936862718
57.2448157941726
51.5979835935414
-9.57779757656499
-53.4920608177144
-3.14100351605521
-58.2688945567625
62.0731020969906
36.4558960192208

\begin{tabular}{lllllllll}
\hline
Estimated ARIMA Residuals \tabularnewline
Value \tabularnewline
4.77799208371942 \tabularnewline
32.954089314259 \tabularnewline
12.4830488193953 \tabularnewline
-13.7995268048031 \tabularnewline
16.2925161981768 \tabularnewline
-15.3273504225423 \tabularnewline
19.0210702727253 \tabularnewline
-29.8262493719092 \tabularnewline
-0.284473836829521 \tabularnewline
20.7105300803447 \tabularnewline
-18.2688121194561 \tabularnewline
-1.59977100680317 \tabularnewline
11.0091695857124 \tabularnewline
2.78283380477854 \tabularnewline
12.3523827818369 \tabularnewline
-4.12515394876208 \tabularnewline
1.01348097432765 \tabularnewline
12.1744112635688 \tabularnewline
-22.1719845746084 \tabularnewline
-16.2295556003082 \tabularnewline
18.4777921627801 \tabularnewline
-18.5337416195653 \tabularnewline
36.2379113861316 \tabularnewline
14.8411447317194 \tabularnewline
20.0944130957359 \tabularnewline
31.3615354701205 \tabularnewline
-19.212553059383 \tabularnewline
-1.19458990716885 \tabularnewline
3.13463880866766 \tabularnewline
51.4856548510124 \tabularnewline
1.96122985613238 \tabularnewline
20.8161300768415 \tabularnewline
3.2130588914315 \tabularnewline
-21.3388894021873 \tabularnewline
-1.10081957262082 \tabularnewline
21.1620879438033 \tabularnewline
-38.0859911535817 \tabularnewline
14.6966114188226 \tabularnewline
37.3323407503631 \tabularnewline
31.1577375773231 \tabularnewline
48.4420122130041 \tabularnewline
0.703574166657745 \tabularnewline
17.5271654301205 \tabularnewline
3.82594588535721 \tabularnewline
-6.38007284201012 \tabularnewline
0.792040638149956 \tabularnewline
40.835607688151 \tabularnewline
93.6277583019055 \tabularnewline
-64.5700742201316 \tabularnewline
-74.4282697641402 \tabularnewline
-48.3536440990565 \tabularnewline
79.651403326211 \tabularnewline
-20.1155243535868 \tabularnewline
-70.6611191409984 \tabularnewline
-24.3616009808902 \tabularnewline
29.1810074932992 \tabularnewline
23.8596721500089 \tabularnewline
70.2294477358009 \tabularnewline
-86.7855902700076 \tabularnewline
-32.0798320122176 \tabularnewline
57.8236259662917 \tabularnewline
-5.11169012777918 \tabularnewline
38.1347147723518 \tabularnewline
18.466609205313 \tabularnewline
2.47235976947377 \tabularnewline
27.8583577652598 \tabularnewline
-19.2278444635658 \tabularnewline
-25.820193759233 \tabularnewline
-31.5314211320001 \tabularnewline
-2.08005209301336 \tabularnewline
3.41059725220475 \tabularnewline
12.9473307907028 \tabularnewline
-23.5453890177723 \tabularnewline
-15.5639515433759 \tabularnewline
-11.3609072776662 \tabularnewline
-15.2710026814148 \tabularnewline
-30.2456355639051 \tabularnewline
14.8737865040903 \tabularnewline
76.5278343308873 \tabularnewline
-0.153825215361394 \tabularnewline
18.6977042007793 \tabularnewline
18.1269628911014 \tabularnewline
-12.9604975441689 \tabularnewline
41.2329973496571 \tabularnewline
-39.2906855940819 \tabularnewline
20.1909379538301 \tabularnewline
-6.94096397596513 \tabularnewline
26.0826743966609 \tabularnewline
-50.4245535668424 \tabularnewline
48.4335725196825 \tabularnewline
-40.3205808260009 \tabularnewline
62.0386354020047 \tabularnewline
1.05834375801805 \tabularnewline
-42.3124429396485 \tabularnewline
0.0950566113660898 \tabularnewline
12.2169548236525 \tabularnewline
3.27408703979927 \tabularnewline
41.6642304103116 \tabularnewline
25.2110092166331 \tabularnewline
-19.1304092016253 \tabularnewline
29.0509746095631 \tabularnewline
35.9584043296 \tabularnewline
-23.184882024585 \tabularnewline
6.49719584749073 \tabularnewline
-28.4289833312341 \tabularnewline
42.2808123131072 \tabularnewline
51.148721666752 \tabularnewline
19.1552936862718 \tabularnewline
57.2448157941726 \tabularnewline
51.5979835935414 \tabularnewline
-9.57779757656499 \tabularnewline
-53.4920608177144 \tabularnewline
-3.14100351605521 \tabularnewline
-58.2688945567625 \tabularnewline
62.0731020969906 \tabularnewline
36.4558960192208 \tabularnewline
\hline
\end{tabular}
%Source: https://freestatistics.org/blog/index.php?pk=299996&T=2

[TABLE]
[ROW][C]Estimated ARIMA Residuals[/C][/ROW]
[ROW][C]Value[/C][/ROW]
[ROW][C]4.77799208371942[/C][/ROW]
[ROW][C]32.954089314259[/C][/ROW]
[ROW][C]12.4830488193953[/C][/ROW]
[ROW][C]-13.7995268048031[/C][/ROW]
[ROW][C]16.2925161981768[/C][/ROW]
[ROW][C]-15.3273504225423[/C][/ROW]
[ROW][C]19.0210702727253[/C][/ROW]
[ROW][C]-29.8262493719092[/C][/ROW]
[ROW][C]-0.284473836829521[/C][/ROW]
[ROW][C]20.7105300803447[/C][/ROW]
[ROW][C]-18.2688121194561[/C][/ROW]
[ROW][C]-1.59977100680317[/C][/ROW]
[ROW][C]11.0091695857124[/C][/ROW]
[ROW][C]2.78283380477854[/C][/ROW]
[ROW][C]12.3523827818369[/C][/ROW]
[ROW][C]-4.12515394876208[/C][/ROW]
[ROW][C]1.01348097432765[/C][/ROW]
[ROW][C]12.1744112635688[/C][/ROW]
[ROW][C]-22.1719845746084[/C][/ROW]
[ROW][C]-16.2295556003082[/C][/ROW]
[ROW][C]18.4777921627801[/C][/ROW]
[ROW][C]-18.5337416195653[/C][/ROW]
[ROW][C]36.2379113861316[/C][/ROW]
[ROW][C]14.8411447317194[/C][/ROW]
[ROW][C]20.0944130957359[/C][/ROW]
[ROW][C]31.3615354701205[/C][/ROW]
[ROW][C]-19.212553059383[/C][/ROW]
[ROW][C]-1.19458990716885[/C][/ROW]
[ROW][C]3.13463880866766[/C][/ROW]
[ROW][C]51.4856548510124[/C][/ROW]
[ROW][C]1.96122985613238[/C][/ROW]
[ROW][C]20.8161300768415[/C][/ROW]
[ROW][C]3.2130588914315[/C][/ROW]
[ROW][C]-21.3388894021873[/C][/ROW]
[ROW][C]-1.10081957262082[/C][/ROW]
[ROW][C]21.1620879438033[/C][/ROW]
[ROW][C]-38.0859911535817[/C][/ROW]
[ROW][C]14.6966114188226[/C][/ROW]
[ROW][C]37.3323407503631[/C][/ROW]
[ROW][C]31.1577375773231[/C][/ROW]
[ROW][C]48.4420122130041[/C][/ROW]
[ROW][C]0.703574166657745[/C][/ROW]
[ROW][C]17.5271654301205[/C][/ROW]
[ROW][C]3.82594588535721[/C][/ROW]
[ROW][C]-6.38007284201012[/C][/ROW]
[ROW][C]0.792040638149956[/C][/ROW]
[ROW][C]40.835607688151[/C][/ROW]
[ROW][C]93.6277583019055[/C][/ROW]
[ROW][C]-64.5700742201316[/C][/ROW]
[ROW][C]-74.4282697641402[/C][/ROW]
[ROW][C]-48.3536440990565[/C][/ROW]
[ROW][C]79.651403326211[/C][/ROW]
[ROW][C]-20.1155243535868[/C][/ROW]
[ROW][C]-70.6611191409984[/C][/ROW]
[ROW][C]-24.3616009808902[/C][/ROW]
[ROW][C]29.1810074932992[/C][/ROW]
[ROW][C]23.8596721500089[/C][/ROW]
[ROW][C]70.2294477358009[/C][/ROW]
[ROW][C]-86.7855902700076[/C][/ROW]
[ROW][C]-32.0798320122176[/C][/ROW]
[ROW][C]57.8236259662917[/C][/ROW]
[ROW][C]-5.11169012777918[/C][/ROW]
[ROW][C]38.1347147723518[/C][/ROW]
[ROW][C]18.466609205313[/C][/ROW]
[ROW][C]2.47235976947377[/C][/ROW]
[ROW][C]27.8583577652598[/C][/ROW]
[ROW][C]-19.2278444635658[/C][/ROW]
[ROW][C]-25.820193759233[/C][/ROW]
[ROW][C]-31.5314211320001[/C][/ROW]
[ROW][C]-2.08005209301336[/C][/ROW]
[ROW][C]3.41059725220475[/C][/ROW]
[ROW][C]12.9473307907028[/C][/ROW]
[ROW][C]-23.5453890177723[/C][/ROW]
[ROW][C]-15.5639515433759[/C][/ROW]
[ROW][C]-11.3609072776662[/C][/ROW]
[ROW][C]-15.2710026814148[/C][/ROW]
[ROW][C]-30.2456355639051[/C][/ROW]
[ROW][C]14.8737865040903[/C][/ROW]
[ROW][C]76.5278343308873[/C][/ROW]
[ROW][C]-0.153825215361394[/C][/ROW]
[ROW][C]18.6977042007793[/C][/ROW]
[ROW][C]18.1269628911014[/C][/ROW]
[ROW][C]-12.9604975441689[/C][/ROW]
[ROW][C]41.2329973496571[/C][/ROW]
[ROW][C]-39.2906855940819[/C][/ROW]
[ROW][C]20.1909379538301[/C][/ROW]
[ROW][C]-6.94096397596513[/C][/ROW]
[ROW][C]26.0826743966609[/C][/ROW]
[ROW][C]-50.4245535668424[/C][/ROW]
[ROW][C]48.4335725196825[/C][/ROW]
[ROW][C]-40.3205808260009[/C][/ROW]
[ROW][C]62.0386354020047[/C][/ROW]
[ROW][C]1.05834375801805[/C][/ROW]
[ROW][C]-42.3124429396485[/C][/ROW]
[ROW][C]0.0950566113660898[/C][/ROW]
[ROW][C]12.2169548236525[/C][/ROW]
[ROW][C]3.27408703979927[/C][/ROW]
[ROW][C]41.6642304103116[/C][/ROW]
[ROW][C]25.2110092166331[/C][/ROW]
[ROW][C]-19.1304092016253[/C][/ROW]
[ROW][C]29.0509746095631[/C][/ROW]
[ROW][C]35.9584043296[/C][/ROW]
[ROW][C]-23.184882024585[/C][/ROW]
[ROW][C]6.49719584749073[/C][/ROW]
[ROW][C]-28.4289833312341[/C][/ROW]
[ROW][C]42.2808123131072[/C][/ROW]
[ROW][C]51.148721666752[/C][/ROW]
[ROW][C]19.1552936862718[/C][/ROW]
[ROW][C]57.2448157941726[/C][/ROW]
[ROW][C]51.5979835935414[/C][/ROW]
[ROW][C]-9.57779757656499[/C][/ROW]
[ROW][C]-53.4920608177144[/C][/ROW]
[ROW][C]-3.14100351605521[/C][/ROW]
[ROW][C]-58.2688945567625[/C][/ROW]
[ROW][C]62.0731020969906[/C][/ROW]
[ROW][C]36.4558960192208[/C][/ROW]
[/TABLE]
Source: https://freestatistics.org/blog/index.php?pk=299996&T=2

Globally Unique Identifier (entire table): ba.freestatistics.org/blog/index.php?pk=299996&T=2

As an alternative you can also use a QR Code:  

The GUIDs for individual cells are displayed in the table below:

Estimated ARIMA Residuals
Value
4.77799208371942
32.954089314259
12.4830488193953
-13.7995268048031
16.2925161981768
-15.3273504225423
19.0210702727253
-29.8262493719092
-0.284473836829521
20.7105300803447
-18.2688121194561
-1.59977100680317
11.0091695857124
2.78283380477854
12.3523827818369
-4.12515394876208
1.01348097432765
12.1744112635688
-22.1719845746084
-16.2295556003082
18.4777921627801
-18.5337416195653
36.2379113861316
14.8411447317194
20.0944130957359
31.3615354701205
-19.212553059383
-1.19458990716885
3.13463880866766
51.4856548510124
1.96122985613238
20.8161300768415
3.2130588914315
-21.3388894021873
-1.10081957262082
21.1620879438033
-38.0859911535817
14.6966114188226
37.3323407503631
31.1577375773231
48.4420122130041
0.703574166657745
17.5271654301205
3.82594588535721
-6.38007284201012
0.792040638149956
40.835607688151
93.6277583019055
-64.5700742201316
-74.4282697641402
-48.3536440990565
79.651403326211
-20.1155243535868
-70.6611191409984
-24.3616009808902
29.1810074932992
23.8596721500089
70.2294477358009
-86.7855902700076
-32.0798320122176
57.8236259662917
-5.11169012777918
38.1347147723518
18.466609205313
2.47235976947377
27.8583577652598
-19.2278444635658
-25.820193759233
-31.5314211320001
-2.08005209301336
3.41059725220475
12.9473307907028
-23.5453890177723
-15.5639515433759
-11.3609072776662
-15.2710026814148
-30.2456355639051
14.8737865040903
76.5278343308873
-0.153825215361394
18.6977042007793
18.1269628911014
-12.9604975441689
41.2329973496571
-39.2906855940819
20.1909379538301
-6.94096397596513
26.0826743966609
-50.4245535668424
48.4335725196825
-40.3205808260009
62.0386354020047
1.05834375801805
-42.3124429396485
0.0950566113660898
12.2169548236525
3.27408703979927
41.6642304103116
25.2110092166331
-19.1304092016253
29.0509746095631
35.9584043296
-23.184882024585
6.49719584749073
-28.4289833312341
42.2808123131072
51.148721666752
19.1552936862718
57.2448157941726
51.5979835935414
-9.57779757656499
-53.4920608177144
-3.14100351605521
-58.2688945567625
62.0731020969906
36.4558960192208


Parameters (Session):
par1 = FALSE ; par2 = 1 ; par3 = 1 ; par4 = 0 ; par5 = 12 ; par6 = 3 ; par7 = 1 ; par8 = 0 ; par9 = 0 ;
Parameters (R input):
par1 = FALSE ; par2 = 1 ; par3 = 1 ; par4 = 0 ; par5 = 12 ; par6 = 3 ; par7 = 1 ; par8 = 0 ; par9 = 0 ;
R code (references can be found in the software module):
par9 <- '0'
par8 <- '0'
par7 <- '0'
par6 <- '3'
par5 <- '12'
par4 <- '0'
par3 <- '1'
par2 <- '1'
par1 <- 'FALSE'
library(lattice)
if (par1 == 'TRUE') par1 <- TRUE
if (par1 == 'FALSE') par1 <- FALSE
par2 <- as.numeric(par2) #Box-Cox lambda transformation parameter
par3 <- as.numeric(par3) #degree of non-seasonal differencing
par4 <- as.numeric(par4) #degree of seasonal differencing
par5 <- as.numeric(par5) #seasonal period
par6 <- as.numeric(par6) #degree (p) of the non-seasonal AR(p) polynomial
par7 <- as.numeric(par7) #degree (q) of the non-seasonal MA(q) polynomial
par8 <- as.numeric(par8) #degree (P) of the seasonal AR(P) polynomial
par9 <- as.numeric(par9) #degree (Q) of the seasonal MA(Q) polynomial
armaGR <- function(arima.out, names, n){
try1 <- arima.out$coef
try2 <- sqrt(diag(arima.out$var.coef))
try.data.frame <- data.frame(matrix(NA,ncol=4,nrow=length(names)))
dimnames(try.data.frame) <- list(names,c('coef','std','tstat','pv'))
try.data.frame[,1] <- try1
for(i in 1:length(try2)) try.data.frame[which(rownames(try.data.frame)==names(try2)[i]),2] <- try2[i]
try.data.frame[,3] <- try.data.frame[,1] / try.data.frame[,2]
try.data.frame[,4] <- round((1-pt(abs(try.data.frame[,3]),df=n-(length(try2)+1)))*2,5)
vector <- rep(NA,length(names))
vector[is.na(try.data.frame[,4])] <- 0
maxi <- which.max(try.data.frame[,4])
continue <- max(try.data.frame[,4],na.rm=TRUE) > .05
vector[maxi] <- 0
list(summary=try.data.frame,next.vector=vector,continue=continue)
}
arimaSelect <- function(series, order=c(13,0,0), seasonal=list(order=c(2,0,0),period=12), include.mean=F){
nrc <- order[1]+order[3]+seasonal$order[1]+seasonal$order[3]
coeff <- matrix(NA, nrow=nrc*2, ncol=nrc)
pval <- matrix(NA, nrow=nrc*2, ncol=nrc)
mylist <- rep(list(NULL), nrc)
names <- NULL
if(order[1] > 0) names <- paste('ar',1:order[1],sep='')
if(order[3] > 0) names <- c( names , paste('ma',1:order[3],sep='') )
if(seasonal$order[1] > 0) names <- c(names, paste('sar',1:seasonal$order[1],sep=''))
if(seasonal$order[3] > 0) names <- c(names, paste('sma',1:seasonal$order[3],sep=''))
arima.out <- arima(series, order=order, seasonal=seasonal, include.mean=include.mean, method='ML')
mylist[[1]] <- arima.out
last.arma <- armaGR(arima.out, names, length(series))
mystop <- FALSE
i <- 1
coeff[i,] <- last.arma[[1]][,1]
pval [i,] <- last.arma[[1]][,4]
i <- 2
aic <- arima.out$aic
while(!mystop){
mylist[[i]] <- arima.out
arima.out <- arima(series, order=order, seasonal=seasonal, include.mean=include.mean, method='ML', fixed=last.arma$next.vector)
aic <- c(aic, arima.out$aic)
last.arma <- armaGR(arima.out, names, length(series))
mystop <- !last.arma$continue
coeff[i,] <- last.arma[[1]][,1]
pval [i,] <- last.arma[[1]][,4]
i <- i+1
}
list(coeff, pval, mylist, aic=aic)
}
arimaSelectplot <- function(arimaSelect.out,noms,choix){
noms <- names(arimaSelect.out[[3]][[1]]$coef)
coeff <- arimaSelect.out[[1]]
k <- min(which(is.na(coeff[,1])))-1
coeff <- coeff[1:k,]
pval <- arimaSelect.out[[2]][1:k,]
aic <- arimaSelect.out$aic[1:k]
coeff[coeff==0] <- NA
n <- ncol(coeff)
if(missing(choix)) choix <- k
layout(matrix(c(1,1,1,2,
3,3,3,2,
3,3,3,4,
5,6,7,7),nr=4),
widths=c(10,35,45,15),
heights=c(30,30,15,15))
couleurs <- rainbow(75)[1:50]#(50)
ticks <- pretty(coeff)
par(mar=c(1,1,3,1))
plot(aic,k:1-.5,type='o',pch=21,bg='blue',cex=2,axes=F,lty=2,xpd=NA)
points(aic[choix],k-choix+.5,pch=21,cex=4,bg=2,xpd=NA)
title('aic',line=2)
par(mar=c(3,0,0,0))
plot(0,axes=F,xlab='',ylab='',xlim=range(ticks),ylim=c(.1,1))
rect(xleft = min(ticks) + (0:49)/50*(max(ticks)-min(ticks)),
xright = min(ticks) + (1:50)/50*(max(ticks)-min(ticks)),
ytop = rep(1,50),
ybottom= rep(0,50),col=couleurs,border=NA)
axis(1,ticks)
rect(xleft=min(ticks),xright=max(ticks),ytop=1,ybottom=0)
text(mean(coeff,na.rm=T),.5,'coefficients',cex=2,font=2)
par(mar=c(1,1,3,1))
image(1:n,1:k,t(coeff[k:1,]),axes=F,col=couleurs,zlim=range(ticks))
for(i in 1:n) for(j in 1:k) if(!is.na(coeff[j,i])) {
if(pval[j,i]<.01) symb = 'green'
else if( (pval[j,i]<.05) & (pval[j,i]>=.01)) symb = 'orange'
else if( (pval[j,i]<.1) & (pval[j,i]>=.05)) symb = 'red'
else symb = 'black'
polygon(c(i+.5 ,i+.2 ,i+.5 ,i+.5),
c(k-j+0.5,k-j+0.5,k-j+0.8,k-j+0.5),
col=symb)
if(j==choix) {
rect(xleft=i-.5,
xright=i+.5,
ybottom=k-j+1.5,
ytop=k-j+.5,
lwd=4)
text(i,
k-j+1,
round(coeff[j,i],2),
cex=1.2,
font=2)
}
else{
rect(xleft=i-.5,xright=i+.5,ybottom=k-j+1.5,ytop=k-j+.5)
text(i,k-j+1,round(coeff[j,i],2),cex=1.2,font=1)
}
}
axis(3,1:n,noms)
par(mar=c(0.5,0,0,0.5))
plot(0,axes=F,xlab='',ylab='',type='n',xlim=c(0,8),ylim=c(-.2,.8))
cols <- c('green','orange','red','black')
niv <- c('0','0.01','0.05','0.1')
for(i in 0:3){
polygon(c(1+2*i ,1+2*i ,1+2*i-.5 ,1+2*i),
c(.4 ,.7 , .4 , .4),
col=cols[i+1])
text(2*i,0.5,niv[i+1],cex=1.5)
}
text(8,.5,1,cex=1.5)
text(4,0,'p-value',cex=2)
box()
residus <- arimaSelect.out[[3]][[choix]]$res
par(mar=c(1,2,4,1))
acf(residus,main='')
title('acf',line=.5)
par(mar=c(1,2,4,1))
pacf(residus,main='')
title('pacf',line=.5)
par(mar=c(2,2,4,1))
qqnorm(residus,main='')
title('qq-norm',line=.5)
qqline(residus)
residus
}
if (par2 == 0) x <- log(x)
if (par2 != 0) x <- x^par2
(selection <- arimaSelect(x, order=c(par6,par3,par7), seasonal=list(order=c(par8,par4,par9), period=par5)))
bitmap(file='test1.png')
resid <- arimaSelectplot(selection)
dev.off()
resid
bitmap(file='test2.png')
acf(resid,length(resid)/2, main='Residual Autocorrelation Function')
dev.off()
bitmap(file='test3.png')
pacf(resid,length(resid)/2, main='Residual Partial Autocorrelation Function')
dev.off()
bitmap(file='test4.png')
cpgram(resid, main='Residual Cumulative Periodogram')
dev.off()
bitmap(file='test5.png')
hist(resid, main='Residual Histogram', xlab='values of Residuals')
dev.off()
bitmap(file='test6.png')
densityplot(~resid,col='black',main='Residual Density Plot', xlab='values of Residuals')
dev.off()
bitmap(file='test7.png')
qqnorm(resid, main='Residual Normal Q-Q Plot')
qqline(resid)
dev.off()
ncols <- length(selection[[1]][1,])
nrows <- length(selection[[2]][,1])-1
load(file='createtable')
a<-table.start()
a<-table.row.start(a)
a<-table.element(a,'ARIMA Parameter Estimation and Backward Selection', ncols+1,TRUE)
a<-table.row.end(a)
a<-table.row.start(a)
a<-table.element(a,'Iteration', header=TRUE)
for (i in 1:ncols) {
a<-table.element(a,names(selection[[3]][[1]]$coef)[i],header=TRUE)
}
a<-table.row.end(a)
for (j in 1:nrows) {
a<-table.row.start(a)
mydum <- 'Estimates ('
mydum <- paste(mydum,j)
mydum <- paste(mydum,')')
a<-table.element(a,mydum, header=TRUE)
for (i in 1:ncols) {
a<-table.element(a,round(selection[[1]][j,i],4))
}
a<-table.row.end(a)
a<-table.row.start(a)
a<-table.element(a,'(p-val)', header=TRUE)
for (i in 1:ncols) {
mydum <- '('
mydum <- paste(mydum,round(selection[[2]][j,i],4),sep='')
mydum <- paste(mydum,')')
a<-table.element(a,mydum)
}
a<-table.row.end(a)
}
a<-table.end(a)
table.save(a,file='mytable.tab')
a<-table.start()
a<-table.row.start(a)
a<-table.element(a,'Estimated ARIMA Residuals', 1,TRUE)
a<-table.row.end(a)
a<-table.row.start(a)
a<-table.element(a,'Value', 1,TRUE)
a<-table.row.end(a)
for (i in (par4*par5+par3):length(resid)) {
a<-table.row.start(a)
a<-table.element(a,resid[i])
a<-table.row.end(a)
}
a<-table.end(a)
table.save(a,file='mytable1.tab')