Free Statistics

of Irreproducible Research!

Author's title

Author*The author of this computation has been verified*
R Software Modulerwasp_smp.wasp
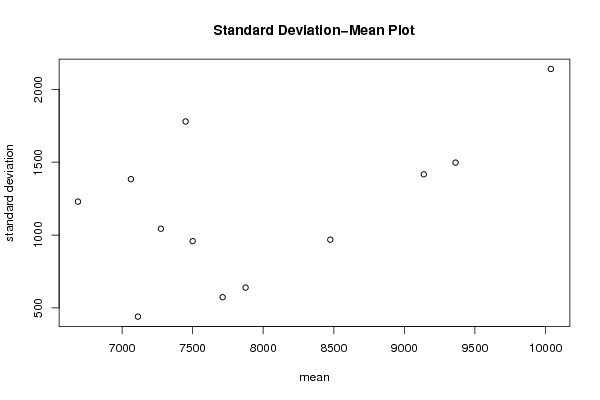
Title produced by softwareStandard Deviation-Mean Plot
Date of computationThu, 15 Dec 2016 23:26:09 +0100
Cite this page as followsStatistical Computations at FreeStatistics.org, Office for Research Development and Education, URL https://freestatistics.org/blog/index.php?v=date/2016/Dec/15/t148184086620wtqufbqsbtr4e.htm/, Retrieved Fri, 03 May 2024 05:55:27 +0000
Statistical Computations at FreeStatistics.org, Office for Research Development and Education, URL https://freestatistics.org/blog/index.php?pk=300037, Retrieved Fri, 03 May 2024 05:55:27 +0000
QR Codes:

Original text written by user:
IsPrivate?No (this computation is public)
User-defined keywords
Estimated Impact58
Family? (F = Feedback message, R = changed R code, M = changed R Module, P = changed Parameters, D = changed Data)
-       [Standard Deviation-Mean Plot] [lambda ] [2016-12-15 22:26:09] [f07fac15bca656f595926f3a45d3c842] [Current]
Feedback Forum

Post a new message
Dataseries X:
8450
7050
7700
7650
6900
6600
7400
7550
7450
8850
6100
5850
6800
7800
4950
7200
7450
6200
8450
7900
6600
7900
6200
8400
7600
5200
7450
9550
7800
7650
9750
8700
7150
10550
10150
12300
7850
8450
10000
11150
7750
11100
8650
9050
7200
8600
7500
8200
10050
9900
9500


Summary of computational transaction
Raw Input view raw input (R code)
Raw Outputview raw output of R engine
Computing time1 seconds
R ServerBig Analytics Cloud Computing Center

\begin{tabular}{lllllllll}
\hline
Summary of computational transaction \tabularnewline
Raw Input view raw input (R code)  \tabularnewline
Raw Outputview raw output of R engine  \tabularnewline
Computing time1 seconds \tabularnewline
R ServerBig Analytics Cloud Computing Center \tabularnewline
\hline
\end{tabular}
%Source: https://freestatistics.org/blog/index.php?pk=300037&T=0

[TABLE]
[ROW]
Summary of computational transaction[/C][/ROW] [ROW]Raw Input[/C] view raw input (R code) [/C][/ROW] [ROW]Raw Output[/C]view raw output of R engine [/C][/ROW] [ROW]Computing time[/C]1 seconds[/C][/ROW] [ROW]R Server[/C]Big Analytics Cloud Computing Center[/C][/ROW] [/TABLE] Source: https://freestatistics.org/blog/index.php?pk=300037&T=0

Globally Unique Identifier (entire table): ba.freestatistics.org/blog/index.php?pk=300037&T=0

As an alternative you can also use a QR Code:  

The GUIDs for individual cells are displayed in the table below:

Summary of computational transaction
Raw Input view raw input (R code)
Raw Outputview raw output of R engine
Computing time1 seconds
R ServerBig Analytics Cloud Computing Center


Standard Deviation-Mean Plot
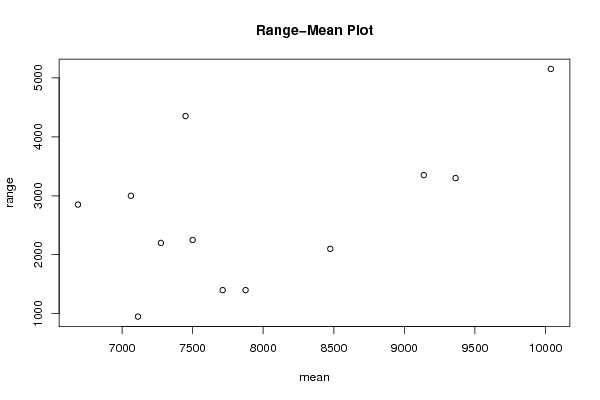
SectionMeanStandard DeviationRange
17712.5573.5488935856591400
27112.5440.407008724127950
37062.51383.458829648843000
46687.51229.074855328192850
57500958.2971007643372250
672751043.631480296882200
774501779.044687465724350
88475968.2458365518542100
910037.52139.460601802865150
109362.51496.871737992273300
119137.51416.789210386173350
127875639.6613687465161400

\begin{tabular}{lllllllll}
\hline
Standard Deviation-Mean Plot \tabularnewline
Section & Mean & Standard Deviation & Range \tabularnewline
1 & 7712.5 & 573.548893585659 & 1400 \tabularnewline
2 & 7112.5 & 440.407008724127 & 950 \tabularnewline
3 & 7062.5 & 1383.45882964884 & 3000 \tabularnewline
4 & 6687.5 & 1229.07485532819 & 2850 \tabularnewline
5 & 7500 & 958.297100764337 & 2250 \tabularnewline
6 & 7275 & 1043.63148029688 & 2200 \tabularnewline
7 & 7450 & 1779.04468746572 & 4350 \tabularnewline
8 & 8475 & 968.245836551854 & 2100 \tabularnewline
9 & 10037.5 & 2139.46060180286 & 5150 \tabularnewline
10 & 9362.5 & 1496.87173799227 & 3300 \tabularnewline
11 & 9137.5 & 1416.78921038617 & 3350 \tabularnewline
12 & 7875 & 639.661368746516 & 1400 \tabularnewline
\hline
\end{tabular}
%Source: https://freestatistics.org/blog/index.php?pk=300037&T=1

[TABLE]
[ROW][C]Standard Deviation-Mean Plot[/C][/ROW]
[ROW][C]Section[/C][C]Mean[/C][C]Standard Deviation[/C][C]Range[/C][/ROW]
[ROW][C]1[/C][C]7712.5[/C][C]573.548893585659[/C][C]1400[/C][/ROW]
[ROW][C]2[/C][C]7112.5[/C][C]440.407008724127[/C][C]950[/C][/ROW]
[ROW][C]3[/C][C]7062.5[/C][C]1383.45882964884[/C][C]3000[/C][/ROW]
[ROW][C]4[/C][C]6687.5[/C][C]1229.07485532819[/C][C]2850[/C][/ROW]
[ROW][C]5[/C][C]7500[/C][C]958.297100764337[/C][C]2250[/C][/ROW]
[ROW][C]6[/C][C]7275[/C][C]1043.63148029688[/C][C]2200[/C][/ROW]
[ROW][C]7[/C][C]7450[/C][C]1779.04468746572[/C][C]4350[/C][/ROW]
[ROW][C]8[/C][C]8475[/C][C]968.245836551854[/C][C]2100[/C][/ROW]
[ROW][C]9[/C][C]10037.5[/C][C]2139.46060180286[/C][C]5150[/C][/ROW]
[ROW][C]10[/C][C]9362.5[/C][C]1496.87173799227[/C][C]3300[/C][/ROW]
[ROW][C]11[/C][C]9137.5[/C][C]1416.78921038617[/C][C]3350[/C][/ROW]
[ROW][C]12[/C][C]7875[/C][C]639.661368746516[/C][C]1400[/C][/ROW]
[/TABLE]
Source: https://freestatistics.org/blog/index.php?pk=300037&T=1

Globally Unique Identifier (entire table): ba.freestatistics.org/blog/index.php?pk=300037&T=1

As an alternative you can also use a QR Code:  

The GUIDs for individual cells are displayed in the table below:

Standard Deviation-Mean Plot
SectionMeanStandard DeviationRange
17712.5573.5488935856591400
27112.5440.407008724127950
37062.51383.458829648843000
46687.51229.074855328192850
57500958.2971007643372250
672751043.631480296882200
774501779.044687465724350
88475968.2458365518542100
910037.52139.460601802865150
109362.51496.871737992273300
119137.51416.789210386173350
127875639.6613687465161400


Regression: S.E.(k) = alpha + beta * Mean(k)
alpha-857.53072217425
beta0.254566795844645
S.D.0.129133094169634
T-STAT1.97135209592543
p-value0.0769713174403301

\begin{tabular}{lllllllll}
\hline
Regression: S.E.(k) = alpha + beta * Mean(k) \tabularnewline
alpha & -857.53072217425 \tabularnewline
beta & 0.254566795844645 \tabularnewline
S.D. & 0.129133094169634 \tabularnewline
T-STAT & 1.97135209592543 \tabularnewline
p-value & 0.0769713174403301 \tabularnewline
\hline
\end{tabular}
%Source: https://freestatistics.org/blog/index.php?pk=300037&T=2

[TABLE]
[ROW][C]Regression: S.E.(k) = alpha + beta * Mean(k)[/C][/ROW]
[ROW][C]alpha[/C][C]-857.53072217425[/C][/ROW]
[ROW][C]beta[/C][C]0.254566795844645[/C][/ROW]
[ROW][C]S.D.[/C][C]0.129133094169634[/C][/ROW]
[ROW][C]T-STAT[/C][C]1.97135209592543[/C][/ROW]
[ROW][C]p-value[/C][C]0.0769713174403301[/C][/ROW]
[/TABLE]
Source: https://freestatistics.org/blog/index.php?pk=300037&T=2

Globally Unique Identifier (entire table): ba.freestatistics.org/blog/index.php?pk=300037&T=2

As an alternative you can also use a QR Code:  

The GUIDs for individual cells are displayed in the table below:

Regression: S.E.(k) = alpha + beta * Mean(k)
alpha-857.53072217425
beta0.254566795844645
S.D.0.129133094169634
T-STAT1.97135209592543
p-value0.0769713174403301


Regression: ln S.E.(k) = alpha + beta * ln Mean(k)
alpha-7.86471692370818
beta1.65279975420516
S.D.1.06140471924458
T-STAT1.55718146361879
p-value0.150483716397582
Lambda-0.652799754205164

\begin{tabular}{lllllllll}
\hline
Regression: ln S.E.(k) = alpha + beta * ln Mean(k) \tabularnewline
alpha & -7.86471692370818 \tabularnewline
beta & 1.65279975420516 \tabularnewline
S.D. & 1.06140471924458 \tabularnewline
T-STAT & 1.55718146361879 \tabularnewline
p-value & 0.150483716397582 \tabularnewline
Lambda & -0.652799754205164 \tabularnewline
\hline
\end{tabular}
%Source: https://freestatistics.org/blog/index.php?pk=300037&T=3

[TABLE]
[ROW][C]Regression: ln S.E.(k) = alpha + beta * ln Mean(k)[/C][/ROW]
[ROW][C]alpha[/C][C]-7.86471692370818[/C][/ROW]
[ROW][C]beta[/C][C]1.65279975420516[/C][/ROW]
[ROW][C]S.D.[/C][C]1.06140471924458[/C][/ROW]
[ROW][C]T-STAT[/C][C]1.55718146361879[/C][/ROW]
[ROW][C]p-value[/C][C]0.150483716397582[/C][/ROW]
[ROW][C]Lambda[/C][C]-0.652799754205164[/C][/ROW]
[/TABLE]
Source: https://freestatistics.org/blog/index.php?pk=300037&T=3

Globally Unique Identifier (entire table): ba.freestatistics.org/blog/index.php?pk=300037&T=3

As an alternative you can also use a QR Code:  

The GUIDs for individual cells are displayed in the table below:

Regression: ln S.E.(k) = alpha + beta * ln Mean(k)
alpha-7.86471692370818
beta1.65279975420516
S.D.1.06140471924458
T-STAT1.55718146361879
p-value0.150483716397582
Lambda-0.652799754205164


Parameters (Session):
par1 = 12 ;
Parameters (R input):
par1 = 4 ;
R code (references can be found in the software module):
par1 <- as.numeric(par1)
(n <- length(x))
(np <- floor(n / par1))
arr <- array(NA,dim=c(par1,np))
j <- 0
k <- 1
for (i in 1:(np*par1))
{
j = j + 1
arr[j,k] <- x[i]
if (j == par1) {
j = 0
k=k+1
}
}
arr
arr.mean <- array(NA,dim=np)
arr.sd <- array(NA,dim=np)
arr.range <- array(NA,dim=np)
for (j in 1:np)
{
arr.mean[j] <- mean(arr[,j],na.rm=TRUE)
arr.sd[j] <- sd(arr[,j],na.rm=TRUE)
arr.range[j] <- max(arr[,j],na.rm=TRUE) - min(arr[,j],na.rm=TRUE)
}
arr.mean
arr.sd
arr.range
(lm1 <- lm(arr.sd~arr.mean))
(lnlm1 <- lm(log(arr.sd)~log(arr.mean)))
(lm2 <- lm(arr.range~arr.mean))
bitmap(file='test1.png')
plot(arr.mean,arr.sd,main='Standard Deviation-Mean Plot',xlab='mean',ylab='standard deviation')
dev.off()
bitmap(file='test2.png')
plot(arr.mean,arr.range,main='Range-Mean Plot',xlab='mean',ylab='range')
dev.off()
load(file='createtable')
a<-table.start()
a<-table.row.start(a)
a<-table.element(a,'Standard Deviation-Mean Plot',4,TRUE)
a<-table.row.end(a)
a<-table.row.start(a)
a<-table.element(a,'Section',header=TRUE)
a<-table.element(a,'Mean',header=TRUE)
a<-table.element(a,'Standard Deviation',header=TRUE)
a<-table.element(a,'Range',header=TRUE)
a<-table.row.end(a)
for (j in 1:np) {
a<-table.row.start(a)
a<-table.element(a,j,header=TRUE)
a<-table.element(a,arr.mean[j])
a<-table.element(a,arr.sd[j] )
a<-table.element(a,arr.range[j] )
a<-table.row.end(a)
}
a<-table.end(a)
table.save(a,file='mytable.tab')
a<-table.start()
a<-table.row.start(a)
a<-table.element(a,'Regression: S.E.(k) = alpha + beta * Mean(k)',2,TRUE)
a<-table.row.end(a)
a<-table.row.start(a)
a<-table.element(a,'alpha',header=TRUE)
a<-table.element(a,lm1$coefficients[[1]])
a<-table.row.end(a)
a<-table.row.start(a)
a<-table.element(a,'beta',header=TRUE)
a<-table.element(a,lm1$coefficients[[2]])
a<-table.row.end(a)
a<-table.row.start(a)
a<-table.element(a,'S.D.',header=TRUE)
a<-table.element(a,summary(lm1)$coefficients[2,2])
a<-table.row.end(a)
a<-table.row.start(a)
a<-table.element(a,'T-STAT',header=TRUE)
a<-table.element(a,summary(lm1)$coefficients[2,3])
a<-table.row.end(a)
a<-table.row.start(a)
a<-table.element(a,'p-value',header=TRUE)
a<-table.element(a,summary(lm1)$coefficients[2,4])
a<-table.row.end(a)
a<-table.end(a)
table.save(a,file='mytable1.tab')
a<-table.start()
a<-table.row.start(a)
a<-table.element(a,'Regression: ln S.E.(k) = alpha + beta * ln Mean(k)',2,TRUE)
a<-table.row.end(a)
a<-table.row.start(a)
a<-table.element(a,'alpha',header=TRUE)
a<-table.element(a,lnlm1$coefficients[[1]])
a<-table.row.end(a)
a<-table.row.start(a)
a<-table.element(a,'beta',header=TRUE)
a<-table.element(a,lnlm1$coefficients[[2]])
a<-table.row.end(a)
a<-table.row.start(a)
a<-table.element(a,'S.D.',header=TRUE)
a<-table.element(a,summary(lnlm1)$coefficients[2,2])
a<-table.row.end(a)
a<-table.row.start(a)
a<-table.element(a,'T-STAT',header=TRUE)
a<-table.element(a,summary(lnlm1)$coefficients[2,3])
a<-table.row.end(a)
a<-table.row.start(a)
a<-table.element(a,'p-value',header=TRUE)
a<-table.element(a,summary(lnlm1)$coefficients[2,4])
a<-table.row.end(a)
a<-table.row.start(a)
a<-table.element(a,'Lambda',header=TRUE)
a<-table.element(a,1-lnlm1$coefficients[[2]])
a<-table.row.end(a)
a<-table.end(a)
table.save(a,file='mytable2.tab')