Free Statistics

of Irreproducible Research!

Author's title

Author*The author of this computation has been verified*
R Software Modulerwasp_exponentialsmoothing.wasp
Title produced by softwareExponential Smoothing
Date of computationFri, 16 Dec 2016 09:23:51 +0100
Cite this page as followsStatistical Computations at FreeStatistics.org, Office for Research Development and Education, URL https://freestatistics.org/blog/index.php?v=date/2016/Dec/16/t14818766376niud20ly7fc9ha.htm/, Retrieved Thu, 02 May 2024 15:19:37 +0000
Statistical Computations at FreeStatistics.org, Office for Research Development and Education, URL https://freestatistics.org/blog/index.php?pk=300106, Retrieved Thu, 02 May 2024 15:19:37 +0000
QR Codes:

Original text written by user:
IsPrivate?No (this computation is public)
User-defined keywords
Estimated Impact79
Family? (F = Feedback message, R = changed R code, M = changed R Module, P = changed Parameters, D = changed Data)
-       [Exponential Smoothing] [] [2016-12-16 08:23:51] [94ac3c9a028ddd47e8862e80eac9f626] [Current]
Feedback Forum

Post a new message
Dataseries X:
3830.8
3732.6
3733.5
3808.5
3860.5
3844.4
3864.5
3803.1
3756.1
3771.1
3754.4
3759.6
3783.5
3886.5
3944.4
4012.1
4089.5
4144
4166.4
4194.2
4221.8
4254.8
4309
4333.5
4390.5
4387.7
4412.6
4427.1
4460
4515.3
4559.3
4625.5
4655.3
4704.8
4734.5
4779.7
4817.6
4839
4839
4856.7
4890.8
4902.7
4882.6
4833.8
4796.7


Summary of computational transaction
Raw Input view raw input (R code)
Raw Outputview raw output of R engine
Computing time1 seconds
R ServerBig Analytics Cloud Computing Center

\begin{tabular}{lllllllll}
\hline
Summary of computational transaction \tabularnewline
Raw Input view raw input (R code)  \tabularnewline
Raw Outputview raw output of R engine  \tabularnewline
Computing time1 seconds \tabularnewline
R ServerBig Analytics Cloud Computing Center \tabularnewline
\hline
\end{tabular}
%Source: https://freestatistics.org/blog/index.php?pk=300106&T=0

[TABLE]
[ROW]
Summary of computational transaction[/C][/ROW] [ROW]Raw Input[/C] view raw input (R code) [/C][/ROW] [ROW]Raw Output[/C]view raw output of R engine [/C][/ROW] [ROW]Computing time[/C]1 seconds[/C][/ROW] [ROW]R Server[/C]Big Analytics Cloud Computing Center[/C][/ROW] [/TABLE] Source: https://freestatistics.org/blog/index.php?pk=300106&T=0

Globally Unique Identifier (entire table): ba.freestatistics.org/blog/index.php?pk=300106&T=0

As an alternative you can also use a QR Code:  

The GUIDs for individual cells are displayed in the table below:

Summary of computational transaction
Raw Input view raw input (R code)
Raw Outputview raw output of R engine
Computing time1 seconds
R ServerBig Analytics Cloud Computing Center


Estimated Parameters of Exponential Smoothing
ParameterValue
alpha1
beta0.81586331743818
gammaFALSE

\begin{tabular}{lllllllll}
\hline
Estimated Parameters of Exponential Smoothing \tabularnewline
Parameter & Value \tabularnewline
alpha & 1 \tabularnewline
beta & 0.81586331743818 \tabularnewline
gamma & FALSE \tabularnewline
\hline
\end{tabular}
%Source: https://freestatistics.org/blog/index.php?pk=300106&T=1

[TABLE]
[ROW][C]Estimated Parameters of Exponential Smoothing[/C][/ROW]
[ROW][C]Parameter[/C][C]Value[/C][/ROW]
[ROW][C]alpha[/C][C]1[/C][/ROW]
[ROW][C]beta[/C][C]0.81586331743818[/C][/ROW]
[ROW][C]gamma[/C][C]FALSE[/C][/ROW]
[/TABLE]
Source: https://freestatistics.org/blog/index.php?pk=300106&T=1

Globally Unique Identifier (entire table): ba.freestatistics.org/blog/index.php?pk=300106&T=1

As an alternative you can also use a QR Code:  

The GUIDs for individual cells are displayed in the table below:

Estimated Parameters of Exponential Smoothing
ParameterValue
alpha1
beta0.81586331743818
gammaFALSE


Interpolation Forecasts of Exponential Smoothing
tObservedFittedResiduals
33733.53634.499.1000000000004
43808.53716.1520547581292.3479452418765
53860.53866.49535572176-5.99535572176046
63844.43913.60396491338-69.2039649133831
73864.53841.0429885192823.4570114807248
83803.13880.28070372312-77.1807037231247
93756.13755.911798741360.188201258637037
103771.13709.0653452445862.0346547554195
113754.43774.67714446947-20.277144469469
123759.63741.4337661144418.1662338855649
133783.53761.4549299576722.0450700423303
143886.53803.3406939355683.1593060644377
153944.43974.18732125715-29.7873212571512
164012.14007.78493851874.31506148130484
174089.54079.0054388937810.494561106218
1841444164.96756633296-20.967566332959
194166.44202.36089810595-35.9608981059464
204194.24195.42172047917-1.22172047917229
214221.84222.22496355605-0.424963556052717
224254.84249.478251379425.32174862057855
2343094286.8200708635822.1799291364214
244333.54359.11586142936-25.6158614293627
254390.54362.7168197445727.7831802554338
264387.74442.38409735675-54.6840973567478
274412.64394.9693482761617.6306517238418
284427.14434.25355028017-7.15355028016984
2944604442.9172310171317.0827689828702
304515.34489.7544355905225.5455644094764
314559.34565.89612451547-6.59612451547036
324625.54604.5145884860420.9854115139569
334655.34687.83581594163-32.5358159416255
344704.84691.0910372119313.7089627880669
354734.54751.77567707084-17.275677070842
364779.74767.3810858648312.3189141351659
374817.64822.63163601839-5.03163601838605
3848394856.42650876429-17.4265087642852
3948394863.60885951249-24.6088595124893
404856.74843.5313937522613.1686062477402
414890.84871.9751765315818.8248234684224
424902.74921.43365945671-18.7336594567132
434882.64918.0495539046-35.4495539046011
444833.84869.02756325429-35.2275632542905
454796.74791.486686632385.21331336761796

\begin{tabular}{lllllllll}
\hline
Interpolation Forecasts of Exponential Smoothing \tabularnewline
t & Observed & Fitted & Residuals \tabularnewline
3 & 3733.5 & 3634.4 & 99.1000000000004 \tabularnewline
4 & 3808.5 & 3716.15205475812 & 92.3479452418765 \tabularnewline
5 & 3860.5 & 3866.49535572176 & -5.99535572176046 \tabularnewline
6 & 3844.4 & 3913.60396491338 & -69.2039649133831 \tabularnewline
7 & 3864.5 & 3841.04298851928 & 23.4570114807248 \tabularnewline
8 & 3803.1 & 3880.28070372312 & -77.1807037231247 \tabularnewline
9 & 3756.1 & 3755.91179874136 & 0.188201258637037 \tabularnewline
10 & 3771.1 & 3709.06534524458 & 62.0346547554195 \tabularnewline
11 & 3754.4 & 3774.67714446947 & -20.277144469469 \tabularnewline
12 & 3759.6 & 3741.43376611444 & 18.1662338855649 \tabularnewline
13 & 3783.5 & 3761.45492995767 & 22.0450700423303 \tabularnewline
14 & 3886.5 & 3803.34069393556 & 83.1593060644377 \tabularnewline
15 & 3944.4 & 3974.18732125715 & -29.7873212571512 \tabularnewline
16 & 4012.1 & 4007.7849385187 & 4.31506148130484 \tabularnewline
17 & 4089.5 & 4079.00543889378 & 10.494561106218 \tabularnewline
18 & 4144 & 4164.96756633296 & -20.967566332959 \tabularnewline
19 & 4166.4 & 4202.36089810595 & -35.9608981059464 \tabularnewline
20 & 4194.2 & 4195.42172047917 & -1.22172047917229 \tabularnewline
21 & 4221.8 & 4222.22496355605 & -0.424963556052717 \tabularnewline
22 & 4254.8 & 4249.47825137942 & 5.32174862057855 \tabularnewline
23 & 4309 & 4286.82007086358 & 22.1799291364214 \tabularnewline
24 & 4333.5 & 4359.11586142936 & -25.6158614293627 \tabularnewline
25 & 4390.5 & 4362.71681974457 & 27.7831802554338 \tabularnewline
26 & 4387.7 & 4442.38409735675 & -54.6840973567478 \tabularnewline
27 & 4412.6 & 4394.96934827616 & 17.6306517238418 \tabularnewline
28 & 4427.1 & 4434.25355028017 & -7.15355028016984 \tabularnewline
29 & 4460 & 4442.91723101713 & 17.0827689828702 \tabularnewline
30 & 4515.3 & 4489.75443559052 & 25.5455644094764 \tabularnewline
31 & 4559.3 & 4565.89612451547 & -6.59612451547036 \tabularnewline
32 & 4625.5 & 4604.51458848604 & 20.9854115139569 \tabularnewline
33 & 4655.3 & 4687.83581594163 & -32.5358159416255 \tabularnewline
34 & 4704.8 & 4691.09103721193 & 13.7089627880669 \tabularnewline
35 & 4734.5 & 4751.77567707084 & -17.275677070842 \tabularnewline
36 & 4779.7 & 4767.38108586483 & 12.3189141351659 \tabularnewline
37 & 4817.6 & 4822.63163601839 & -5.03163601838605 \tabularnewline
38 & 4839 & 4856.42650876429 & -17.4265087642852 \tabularnewline
39 & 4839 & 4863.60885951249 & -24.6088595124893 \tabularnewline
40 & 4856.7 & 4843.53139375226 & 13.1686062477402 \tabularnewline
41 & 4890.8 & 4871.97517653158 & 18.8248234684224 \tabularnewline
42 & 4902.7 & 4921.43365945671 & -18.7336594567132 \tabularnewline
43 & 4882.6 & 4918.0495539046 & -35.4495539046011 \tabularnewline
44 & 4833.8 & 4869.02756325429 & -35.2275632542905 \tabularnewline
45 & 4796.7 & 4791.48668663238 & 5.21331336761796 \tabularnewline
\hline
\end{tabular}
%Source: https://freestatistics.org/blog/index.php?pk=300106&T=2

[TABLE]
[ROW][C]Interpolation Forecasts of Exponential Smoothing[/C][/ROW]
[ROW][C]t[/C][C]Observed[/C][C]Fitted[/C][C]Residuals[/C][/ROW]
[ROW][C]3[/C][C]3733.5[/C][C]3634.4[/C][C]99.1000000000004[/C][/ROW]
[ROW][C]4[/C][C]3808.5[/C][C]3716.15205475812[/C][C]92.3479452418765[/C][/ROW]
[ROW][C]5[/C][C]3860.5[/C][C]3866.49535572176[/C][C]-5.99535572176046[/C][/ROW]
[ROW][C]6[/C][C]3844.4[/C][C]3913.60396491338[/C][C]-69.2039649133831[/C][/ROW]
[ROW][C]7[/C][C]3864.5[/C][C]3841.04298851928[/C][C]23.4570114807248[/C][/ROW]
[ROW][C]8[/C][C]3803.1[/C][C]3880.28070372312[/C][C]-77.1807037231247[/C][/ROW]
[ROW][C]9[/C][C]3756.1[/C][C]3755.91179874136[/C][C]0.188201258637037[/C][/ROW]
[ROW][C]10[/C][C]3771.1[/C][C]3709.06534524458[/C][C]62.0346547554195[/C][/ROW]
[ROW][C]11[/C][C]3754.4[/C][C]3774.67714446947[/C][C]-20.277144469469[/C][/ROW]
[ROW][C]12[/C][C]3759.6[/C][C]3741.43376611444[/C][C]18.1662338855649[/C][/ROW]
[ROW][C]13[/C][C]3783.5[/C][C]3761.45492995767[/C][C]22.0450700423303[/C][/ROW]
[ROW][C]14[/C][C]3886.5[/C][C]3803.34069393556[/C][C]83.1593060644377[/C][/ROW]
[ROW][C]15[/C][C]3944.4[/C][C]3974.18732125715[/C][C]-29.7873212571512[/C][/ROW]
[ROW][C]16[/C][C]4012.1[/C][C]4007.7849385187[/C][C]4.31506148130484[/C][/ROW]
[ROW][C]17[/C][C]4089.5[/C][C]4079.00543889378[/C][C]10.494561106218[/C][/ROW]
[ROW][C]18[/C][C]4144[/C][C]4164.96756633296[/C][C]-20.967566332959[/C][/ROW]
[ROW][C]19[/C][C]4166.4[/C][C]4202.36089810595[/C][C]-35.9608981059464[/C][/ROW]
[ROW][C]20[/C][C]4194.2[/C][C]4195.42172047917[/C][C]-1.22172047917229[/C][/ROW]
[ROW][C]21[/C][C]4221.8[/C][C]4222.22496355605[/C][C]-0.424963556052717[/C][/ROW]
[ROW][C]22[/C][C]4254.8[/C][C]4249.47825137942[/C][C]5.32174862057855[/C][/ROW]
[ROW][C]23[/C][C]4309[/C][C]4286.82007086358[/C][C]22.1799291364214[/C][/ROW]
[ROW][C]24[/C][C]4333.5[/C][C]4359.11586142936[/C][C]-25.6158614293627[/C][/ROW]
[ROW][C]25[/C][C]4390.5[/C][C]4362.71681974457[/C][C]27.7831802554338[/C][/ROW]
[ROW][C]26[/C][C]4387.7[/C][C]4442.38409735675[/C][C]-54.6840973567478[/C][/ROW]
[ROW][C]27[/C][C]4412.6[/C][C]4394.96934827616[/C][C]17.6306517238418[/C][/ROW]
[ROW][C]28[/C][C]4427.1[/C][C]4434.25355028017[/C][C]-7.15355028016984[/C][/ROW]
[ROW][C]29[/C][C]4460[/C][C]4442.91723101713[/C][C]17.0827689828702[/C][/ROW]
[ROW][C]30[/C][C]4515.3[/C][C]4489.75443559052[/C][C]25.5455644094764[/C][/ROW]
[ROW][C]31[/C][C]4559.3[/C][C]4565.89612451547[/C][C]-6.59612451547036[/C][/ROW]
[ROW][C]32[/C][C]4625.5[/C][C]4604.51458848604[/C][C]20.9854115139569[/C][/ROW]
[ROW][C]33[/C][C]4655.3[/C][C]4687.83581594163[/C][C]-32.5358159416255[/C][/ROW]
[ROW][C]34[/C][C]4704.8[/C][C]4691.09103721193[/C][C]13.7089627880669[/C][/ROW]
[ROW][C]35[/C][C]4734.5[/C][C]4751.77567707084[/C][C]-17.275677070842[/C][/ROW]
[ROW][C]36[/C][C]4779.7[/C][C]4767.38108586483[/C][C]12.3189141351659[/C][/ROW]
[ROW][C]37[/C][C]4817.6[/C][C]4822.63163601839[/C][C]-5.03163601838605[/C][/ROW]
[ROW][C]38[/C][C]4839[/C][C]4856.42650876429[/C][C]-17.4265087642852[/C][/ROW]
[ROW][C]39[/C][C]4839[/C][C]4863.60885951249[/C][C]-24.6088595124893[/C][/ROW]
[ROW][C]40[/C][C]4856.7[/C][C]4843.53139375226[/C][C]13.1686062477402[/C][/ROW]
[ROW][C]41[/C][C]4890.8[/C][C]4871.97517653158[/C][C]18.8248234684224[/C][/ROW]
[ROW][C]42[/C][C]4902.7[/C][C]4921.43365945671[/C][C]-18.7336594567132[/C][/ROW]
[ROW][C]43[/C][C]4882.6[/C][C]4918.0495539046[/C][C]-35.4495539046011[/C][/ROW]
[ROW][C]44[/C][C]4833.8[/C][C]4869.02756325429[/C][C]-35.2275632542905[/C][/ROW]
[ROW][C]45[/C][C]4796.7[/C][C]4791.48668663238[/C][C]5.21331336761796[/C][/ROW]
[/TABLE]
Source: https://freestatistics.org/blog/index.php?pk=300106&T=2

Globally Unique Identifier (entire table): ba.freestatistics.org/blog/index.php?pk=300106&T=2

As an alternative you can also use a QR Code:  

The GUIDs for individual cells are displayed in the table below:

Interpolation Forecasts of Exponential Smoothing
tObservedFittedResiduals
33733.53634.499.1000000000004
43808.53716.1520547581292.3479452418765
53860.53866.49535572176-5.99535572176046
63844.43913.60396491338-69.2039649133831
73864.53841.0429885192823.4570114807248
83803.13880.28070372312-77.1807037231247
93756.13755.911798741360.188201258637037
103771.13709.0653452445862.0346547554195
113754.43774.67714446947-20.277144469469
123759.63741.4337661144418.1662338855649
133783.53761.4549299576722.0450700423303
143886.53803.3406939355683.1593060644377
153944.43974.18732125715-29.7873212571512
164012.14007.78493851874.31506148130484
174089.54079.0054388937810.494561106218
1841444164.96756633296-20.967566332959
194166.44202.36089810595-35.9608981059464
204194.24195.42172047917-1.22172047917229
214221.84222.22496355605-0.424963556052717
224254.84249.478251379425.32174862057855
2343094286.8200708635822.1799291364214
244333.54359.11586142936-25.6158614293627
254390.54362.7168197445727.7831802554338
264387.74442.38409735675-54.6840973567478
274412.64394.9693482761617.6306517238418
284427.14434.25355028017-7.15355028016984
2944604442.9172310171317.0827689828702
304515.34489.7544355905225.5455644094764
314559.34565.89612451547-6.59612451547036
324625.54604.5145884860420.9854115139569
334655.34687.83581594163-32.5358159416255
344704.84691.0910372119313.7089627880669
354734.54751.77567707084-17.275677070842
364779.74767.3810858648312.3189141351659
374817.64822.63163601839-5.03163601838605
3848394856.42650876429-17.4265087642852
3948394863.60885951249-24.6088595124893
404856.74843.5313937522613.1686062477402
414890.84871.9751765315818.8248234684224
424902.74921.43365945671-18.7336594567132
434882.64918.0495539046-35.4495539046011
444833.84869.02756325429-35.2275632542905
454796.74791.486686632385.21331336761796


Extrapolation Forecasts of Exponential Smoothing
tForecast95% Lower Bound95% Upper Bound
464758.640037771334686.397980406374830.88209513629
474720.580075542664570.821757651524870.33839343381
484682.520113313994440.500113763744924.54011286425
494644.460151085324297.177762425914991.74253974474
504606.400188856664142.213320175355070.58705753796
514568.340226627993976.635386071225160.04506718475
524530.280264399323801.247803718755259.31272507989
534492.220302170653616.698547086495367.74205725481
544454.160339941983423.523436641965484.797243242
554416.100377713313222.174776770315610.02597865631
564378.040415484643013.040836927245743.03999404205
574339.980453255972796.459570185475883.50133632648

\begin{tabular}{lllllllll}
\hline
Extrapolation Forecasts of Exponential Smoothing \tabularnewline
t & Forecast & 95% Lower Bound & 95% Upper Bound \tabularnewline
46 & 4758.64003777133 & 4686.39798040637 & 4830.88209513629 \tabularnewline
47 & 4720.58007554266 & 4570.82175765152 & 4870.33839343381 \tabularnewline
48 & 4682.52011331399 & 4440.50011376374 & 4924.54011286425 \tabularnewline
49 & 4644.46015108532 & 4297.17776242591 & 4991.74253974474 \tabularnewline
50 & 4606.40018885666 & 4142.21332017535 & 5070.58705753796 \tabularnewline
51 & 4568.34022662799 & 3976.63538607122 & 5160.04506718475 \tabularnewline
52 & 4530.28026439932 & 3801.24780371875 & 5259.31272507989 \tabularnewline
53 & 4492.22030217065 & 3616.69854708649 & 5367.74205725481 \tabularnewline
54 & 4454.16033994198 & 3423.52343664196 & 5484.797243242 \tabularnewline
55 & 4416.10037771331 & 3222.17477677031 & 5610.02597865631 \tabularnewline
56 & 4378.04041548464 & 3013.04083692724 & 5743.03999404205 \tabularnewline
57 & 4339.98045325597 & 2796.45957018547 & 5883.50133632648 \tabularnewline
\hline
\end{tabular}
%Source: https://freestatistics.org/blog/index.php?pk=300106&T=3

[TABLE]
[ROW][C]Extrapolation Forecasts of Exponential Smoothing[/C][/ROW]
[ROW][C]t[/C][C]Forecast[/C][C]95% Lower Bound[/C][C]95% Upper Bound[/C][/ROW]
[ROW][C]46[/C][C]4758.64003777133[/C][C]4686.39798040637[/C][C]4830.88209513629[/C][/ROW]
[ROW][C]47[/C][C]4720.58007554266[/C][C]4570.82175765152[/C][C]4870.33839343381[/C][/ROW]
[ROW][C]48[/C][C]4682.52011331399[/C][C]4440.50011376374[/C][C]4924.54011286425[/C][/ROW]
[ROW][C]49[/C][C]4644.46015108532[/C][C]4297.17776242591[/C][C]4991.74253974474[/C][/ROW]
[ROW][C]50[/C][C]4606.40018885666[/C][C]4142.21332017535[/C][C]5070.58705753796[/C][/ROW]
[ROW][C]51[/C][C]4568.34022662799[/C][C]3976.63538607122[/C][C]5160.04506718475[/C][/ROW]
[ROW][C]52[/C][C]4530.28026439932[/C][C]3801.24780371875[/C][C]5259.31272507989[/C][/ROW]
[ROW][C]53[/C][C]4492.22030217065[/C][C]3616.69854708649[/C][C]5367.74205725481[/C][/ROW]
[ROW][C]54[/C][C]4454.16033994198[/C][C]3423.52343664196[/C][C]5484.797243242[/C][/ROW]
[ROW][C]55[/C][C]4416.10037771331[/C][C]3222.17477677031[/C][C]5610.02597865631[/C][/ROW]
[ROW][C]56[/C][C]4378.04041548464[/C][C]3013.04083692724[/C][C]5743.03999404205[/C][/ROW]
[ROW][C]57[/C][C]4339.98045325597[/C][C]2796.45957018547[/C][C]5883.50133632648[/C][/ROW]
[/TABLE]
Source: https://freestatistics.org/blog/index.php?pk=300106&T=3

Globally Unique Identifier (entire table): ba.freestatistics.org/blog/index.php?pk=300106&T=3

As an alternative you can also use a QR Code:  

The GUIDs for individual cells are displayed in the table below:

Extrapolation Forecasts of Exponential Smoothing
tForecast95% Lower Bound95% Upper Bound
464758.640037771334686.397980406374830.88209513629
474720.580075542664570.821757651524870.33839343381
484682.520113313994440.500113763744924.54011286425
494644.460151085324297.177762425914991.74253974474
504606.400188856664142.213320175355070.58705753796
514568.340226627993976.635386071225160.04506718475
524530.280264399323801.247803718755259.31272507989
534492.220302170653616.698547086495367.74205725481
544454.160339941983423.523436641965484.797243242
554416.100377713313222.174776770315610.02597865631
564378.040415484643013.040836927245743.03999404205
574339.980453255972796.459570185475883.50133632648


Parameters (Session):
par1 = 1 ; par2 = Double ; par3 = additive ; par4 = 12 ;
Parameters (R input):
par1 = 1 ; par2 = Double ; par3 = additive ; par4 = 12 ;
R code (references can be found in the software module):
par1 <- as.numeric(par1)
par4 <- as.numeric(par4)
if (par2 == 'Single') K <- 1
if (par2 == 'Double') K <- 2
if (par2 == 'Triple') K <- par1
nx <- length(x)
nxmK <- nx - K
x <- ts(x, frequency = par1)
if (par2 == 'Single') fit <- HoltWinters(x, gamma=F, beta=F)
if (par2 == 'Double') fit <- HoltWinters(x, gamma=F)
if (par2 == 'Triple') fit <- HoltWinters(x, seasonal=par3)
fit
myresid <- x - fit$fitted[,'xhat']
bitmap(file='test1.png')
op <- par(mfrow=c(2,1))
plot(fit,ylab='Observed (black) / Fitted (red)',main='Interpolation Fit of Exponential Smoothing')
plot(myresid,ylab='Residuals',main='Interpolation Prediction Errors')
par(op)
dev.off()
bitmap(file='test2.png')
p <- predict(fit, par4, prediction.interval=TRUE)
np <- length(p[,1])
plot(fit,p,ylab='Observed (black) / Fitted (red)',main='Extrapolation Fit of Exponential Smoothing')
dev.off()
bitmap(file='test3.png')
op <- par(mfrow = c(2,2))
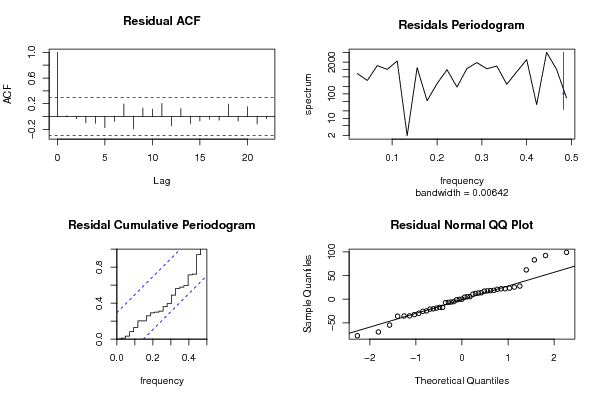
acf(as.numeric(myresid),lag.max = nx/2,main='Residual ACF')
spectrum(myresid,main='Residals Periodogram')
cpgram(myresid,main='Residal Cumulative Periodogram')
qqnorm(myresid,main='Residual Normal QQ Plot')
qqline(myresid)
par(op)
dev.off()
load(file='createtable')
a<-table.start()
a<-table.row.start(a)
a<-table.element(a,'Estimated Parameters of Exponential Smoothing',2,TRUE)
a<-table.row.end(a)
a<-table.row.start(a)
a<-table.element(a,'Parameter',header=TRUE)
a<-table.element(a,'Value',header=TRUE)
a<-table.row.end(a)
a<-table.row.start(a)
a<-table.element(a,'alpha',header=TRUE)
a<-table.element(a,fit$alpha)
a<-table.row.end(a)
a<-table.row.start(a)
a<-table.element(a,'beta',header=TRUE)
a<-table.element(a,fit$beta)
a<-table.row.end(a)
a<-table.row.start(a)
a<-table.element(a,'gamma',header=TRUE)
a<-table.element(a,fit$gamma)
a<-table.row.end(a)
a<-table.end(a)
table.save(a,file='mytable.tab')
a<-table.start()
a<-table.row.start(a)
a<-table.element(a,'Interpolation Forecasts of Exponential Smoothing',4,TRUE)
a<-table.row.end(a)
a<-table.row.start(a)
a<-table.element(a,'t',header=TRUE)
a<-table.element(a,'Observed',header=TRUE)
a<-table.element(a,'Fitted',header=TRUE)
a<-table.element(a,'Residuals',header=TRUE)
a<-table.row.end(a)
for (i in 1:nxmK) {
a<-table.row.start(a)
a<-table.element(a,i+K,header=TRUE)
a<-table.element(a,x[i+K])
a<-table.element(a,fit$fitted[i,'xhat'])
a<-table.element(a,myresid[i])
a<-table.row.end(a)
}
a<-table.end(a)
table.save(a,file='mytable1.tab')
a<-table.start()
a<-table.row.start(a)
a<-table.element(a,'Extrapolation Forecasts of Exponential Smoothing',4,TRUE)
a<-table.row.end(a)
a<-table.row.start(a)
a<-table.element(a,'t',header=TRUE)
a<-table.element(a,'Forecast',header=TRUE)
a<-table.element(a,'95% Lower Bound',header=TRUE)
a<-table.element(a,'95% Upper Bound',header=TRUE)
a<-table.row.end(a)
for (i in 1:np) {
a<-table.row.start(a)
a<-table.element(a,nx+i,header=TRUE)
a<-table.element(a,p[i,'fit'])
a<-table.element(a,p[i,'lwr'])
a<-table.element(a,p[i,'upr'])
a<-table.row.end(a)
}
a<-table.end(a)
table.save(a,file='mytable2.tab')