Free Statistics

of Irreproducible Research!

Author's title

Author*The author of this computation has been verified*
R Software Modulerwasp_exponentialsmoothing.wasp
Title produced by softwareExponential Smoothing
Date of computationFri, 16 Dec 2016 09:21:17 +0100
Cite this page as followsStatistical Computations at FreeStatistics.org, Office for Research Development and Education, URL https://freestatistics.org/blog/index.php?v=date/2016/Dec/16/t1481876677vhvga6cmzqr7zvl.htm/, Retrieved Fri, 03 May 2024 00:21:28 +0000
Statistical Computations at FreeStatistics.org, Office for Research Development and Education, URL https://freestatistics.org/blog/index.php?pk=300107, Retrieved Fri, 03 May 2024 00:21:28 +0000
QR Codes:

Original text written by user:
IsPrivate?No (this computation is public)
User-defined keywordsDouble, s maakt niet uit ,additive, voorspelling kies je
Estimated Impact79
Family? (F = Feedback message, R = changed R code, M = changed R Module, P = changed Parameters, D = changed Data)
-       [Exponential Smoothing] [Exponential smoot...] [2016-12-16 08:21:17] [673dd365cbcfe0c4e35658a2fe545652] [Current]
Feedback Forum

Post a new message
Dataseries X:
3106.78
3235.94
2998.12
2896.3
2952
3060.24
2988.32
2889
2881.82
2969.22
3026.2
3146.08
3032.48
2719.74
2785.18
2797.28
2783.7
2822.84
2835.8
2823.22
2879.14
3003.5
2910.7
2895.54
2982.36
3087.2
3195.28
3272.72
3390.6
3676.12
4052.18
4431.2
4554.96
4279.7
4391.86
4482.82
4530.68
4580.66
4623.5
4720.14
4811.82
4980.18
5174.28
5181.24


Summary of computational transaction
Raw Input view raw input (R code)
Raw Outputview raw output of R engine
Computing time2 seconds
R ServerBig Analytics Cloud Computing Center

\begin{tabular}{lllllllll}
\hline
Summary of computational transaction \tabularnewline
Raw Input view raw input (R code)  \tabularnewline
Raw Outputview raw output of R engine  \tabularnewline
Computing time2 seconds \tabularnewline
R ServerBig Analytics Cloud Computing Center \tabularnewline
\hline
\end{tabular}
%Source: https://freestatistics.org/blog/index.php?pk=300107&T=0

[TABLE]
[ROW]
Summary of computational transaction[/C][/ROW] [ROW]Raw Input[/C] view raw input (R code) [/C][/ROW] [ROW]Raw Output[/C]view raw output of R engine [/C][/ROW] [ROW]Computing time[/C]2 seconds[/C][/ROW] [ROW]R Server[/C]Big Analytics Cloud Computing Center[/C][/ROW] [/TABLE] Source: https://freestatistics.org/blog/index.php?pk=300107&T=0

Globally Unique Identifier (entire table): ba.freestatistics.org/blog/index.php?pk=300107&T=0

As an alternative you can also use a QR Code:  

The GUIDs for individual cells are displayed in the table below:

Summary of computational transaction
Raw Input view raw input (R code)
Raw Outputview raw output of R engine
Computing time2 seconds
R ServerBig Analytics Cloud Computing Center


Estimated Parameters of Exponential Smoothing
ParameterValue
alpha1
beta0.209989532977869
gammaFALSE

\begin{tabular}{lllllllll}
\hline
Estimated Parameters of Exponential Smoothing \tabularnewline
Parameter & Value \tabularnewline
alpha & 1 \tabularnewline
beta & 0.209989532977869 \tabularnewline
gamma & FALSE \tabularnewline
\hline
\end{tabular}
%Source: https://freestatistics.org/blog/index.php?pk=300107&T=1

[TABLE]
[ROW][C]Estimated Parameters of Exponential Smoothing[/C][/ROW]
[ROW][C]Parameter[/C][C]Value[/C][/ROW]
[ROW][C]alpha[/C][C]1[/C][/ROW]
[ROW][C]beta[/C][C]0.209989532977869[/C][/ROW]
[ROW][C]gamma[/C][C]FALSE[/C][/ROW]
[/TABLE]
Source: https://freestatistics.org/blog/index.php?pk=300107&T=1

Globally Unique Identifier (entire table): ba.freestatistics.org/blog/index.php?pk=300107&T=1

As an alternative you can also use a QR Code:  

The GUIDs for individual cells are displayed in the table below:

Estimated Parameters of Exponential Smoothing
ParameterValue
alpha1
beta0.209989532977869
gammaFALSE


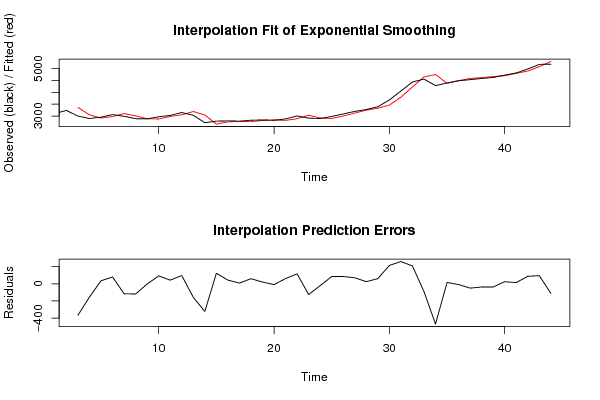
Interpolation Forecasts of Exponential Smoothing
tObservedFittedResiduals
32998.123365.1-366.98
42896.33050.21804118778-153.918041187781
529522916.0768636018935.9231363981089
63060.242979.3203462372380.9196537627695
72988.323104.5526265396-116.232626539605
828893008.22499157576-119.224991575762
92881.822883.86899127548-2.04899127547742
102969.222876.2587245544692.9612754455352
113026.22983.179619370343.0203806297009
123146.083049.1934490072696.8865509927396
133032.483189.41861060206-156.938610602062
142719.743042.86314505554-323.12314505554
152785.182662.27066673099122.909333269014
162797.282753.5203402227743.7596597772326
172783.72774.809410742668.89058925734025
182822.842763.0963414287159.743658571294
192835.82814.7818843904821.0181156095182
202823.222832.1554686714-8.93546867139958
212879.142817.6991137781561.4408862218465
223003.52886.52105678163116.978943218375
232910.73035.4454104363-124.745410436297
242895.542916.45017995765-20.9101799576461
252982.362896.8992610338685.4607389661433
263087.23001.665121697385.5348783026989
273195.283124.466550845470.813449154597
283272.723247.4166339619325.3033660380702
293390.63330.1700759790360.4299240209684
303676.123460.73972750208215.380272497917
314052.183791.48733033657260.692669663433
324431.24222.29006228995208.909937710055
334554.964645.17896254412-90.2189625441151
344279.74749.99392473373-470.293924733729
354391.864375.9771231165615.8828768834364
364482.824491.47236101566-8.65236101566188
374530.684580.61545576683-49.9354557668266
384580.664617.98953273131-37.3295327313144
394623.54660.13072158678-36.6307215867828
404720.144695.2786534681324.8613465318676
414811.824797.1392760155614.6807239844393
424980.184891.9020743888388.2779256111708
435174.285078.7995147601895.4804852398247
445181.245292.94941726419-111.709417264186

\begin{tabular}{lllllllll}
\hline
Interpolation Forecasts of Exponential Smoothing \tabularnewline
t & Observed & Fitted & Residuals \tabularnewline
3 & 2998.12 & 3365.1 & -366.98 \tabularnewline
4 & 2896.3 & 3050.21804118778 & -153.918041187781 \tabularnewline
5 & 2952 & 2916.07686360189 & 35.9231363981089 \tabularnewline
6 & 3060.24 & 2979.32034623723 & 80.9196537627695 \tabularnewline
7 & 2988.32 & 3104.5526265396 & -116.232626539605 \tabularnewline
8 & 2889 & 3008.22499157576 & -119.224991575762 \tabularnewline
9 & 2881.82 & 2883.86899127548 & -2.04899127547742 \tabularnewline
10 & 2969.22 & 2876.25872455446 & 92.9612754455352 \tabularnewline
11 & 3026.2 & 2983.1796193703 & 43.0203806297009 \tabularnewline
12 & 3146.08 & 3049.19344900726 & 96.8865509927396 \tabularnewline
13 & 3032.48 & 3189.41861060206 & -156.938610602062 \tabularnewline
14 & 2719.74 & 3042.86314505554 & -323.12314505554 \tabularnewline
15 & 2785.18 & 2662.27066673099 & 122.909333269014 \tabularnewline
16 & 2797.28 & 2753.52034022277 & 43.7596597772326 \tabularnewline
17 & 2783.7 & 2774.80941074266 & 8.89058925734025 \tabularnewline
18 & 2822.84 & 2763.09634142871 & 59.743658571294 \tabularnewline
19 & 2835.8 & 2814.78188439048 & 21.0181156095182 \tabularnewline
20 & 2823.22 & 2832.1554686714 & -8.93546867139958 \tabularnewline
21 & 2879.14 & 2817.69911377815 & 61.4408862218465 \tabularnewline
22 & 3003.5 & 2886.52105678163 & 116.978943218375 \tabularnewline
23 & 2910.7 & 3035.4454104363 & -124.745410436297 \tabularnewline
24 & 2895.54 & 2916.45017995765 & -20.9101799576461 \tabularnewline
25 & 2982.36 & 2896.89926103386 & 85.4607389661433 \tabularnewline
26 & 3087.2 & 3001.6651216973 & 85.5348783026989 \tabularnewline
27 & 3195.28 & 3124.4665508454 & 70.813449154597 \tabularnewline
28 & 3272.72 & 3247.41663396193 & 25.3033660380702 \tabularnewline
29 & 3390.6 & 3330.17007597903 & 60.4299240209684 \tabularnewline
30 & 3676.12 & 3460.73972750208 & 215.380272497917 \tabularnewline
31 & 4052.18 & 3791.48733033657 & 260.692669663433 \tabularnewline
32 & 4431.2 & 4222.29006228995 & 208.909937710055 \tabularnewline
33 & 4554.96 & 4645.17896254412 & -90.2189625441151 \tabularnewline
34 & 4279.7 & 4749.99392473373 & -470.293924733729 \tabularnewline
35 & 4391.86 & 4375.97712311656 & 15.8828768834364 \tabularnewline
36 & 4482.82 & 4491.47236101566 & -8.65236101566188 \tabularnewline
37 & 4530.68 & 4580.61545576683 & -49.9354557668266 \tabularnewline
38 & 4580.66 & 4617.98953273131 & -37.3295327313144 \tabularnewline
39 & 4623.5 & 4660.13072158678 & -36.6307215867828 \tabularnewline
40 & 4720.14 & 4695.27865346813 & 24.8613465318676 \tabularnewline
41 & 4811.82 & 4797.13927601556 & 14.6807239844393 \tabularnewline
42 & 4980.18 & 4891.90207438883 & 88.2779256111708 \tabularnewline
43 & 5174.28 & 5078.79951476018 & 95.4804852398247 \tabularnewline
44 & 5181.24 & 5292.94941726419 & -111.709417264186 \tabularnewline
\hline
\end{tabular}
%Source: https://freestatistics.org/blog/index.php?pk=300107&T=2

[TABLE]
[ROW][C]Interpolation Forecasts of Exponential Smoothing[/C][/ROW]
[ROW][C]t[/C][C]Observed[/C][C]Fitted[/C][C]Residuals[/C][/ROW]
[ROW][C]3[/C][C]2998.12[/C][C]3365.1[/C][C]-366.98[/C][/ROW]
[ROW][C]4[/C][C]2896.3[/C][C]3050.21804118778[/C][C]-153.918041187781[/C][/ROW]
[ROW][C]5[/C][C]2952[/C][C]2916.07686360189[/C][C]35.9231363981089[/C][/ROW]
[ROW][C]6[/C][C]3060.24[/C][C]2979.32034623723[/C][C]80.9196537627695[/C][/ROW]
[ROW][C]7[/C][C]2988.32[/C][C]3104.5526265396[/C][C]-116.232626539605[/C][/ROW]
[ROW][C]8[/C][C]2889[/C][C]3008.22499157576[/C][C]-119.224991575762[/C][/ROW]
[ROW][C]9[/C][C]2881.82[/C][C]2883.86899127548[/C][C]-2.04899127547742[/C][/ROW]
[ROW][C]10[/C][C]2969.22[/C][C]2876.25872455446[/C][C]92.9612754455352[/C][/ROW]
[ROW][C]11[/C][C]3026.2[/C][C]2983.1796193703[/C][C]43.0203806297009[/C][/ROW]
[ROW][C]12[/C][C]3146.08[/C][C]3049.19344900726[/C][C]96.8865509927396[/C][/ROW]
[ROW][C]13[/C][C]3032.48[/C][C]3189.41861060206[/C][C]-156.938610602062[/C][/ROW]
[ROW][C]14[/C][C]2719.74[/C][C]3042.86314505554[/C][C]-323.12314505554[/C][/ROW]
[ROW][C]15[/C][C]2785.18[/C][C]2662.27066673099[/C][C]122.909333269014[/C][/ROW]
[ROW][C]16[/C][C]2797.28[/C][C]2753.52034022277[/C][C]43.7596597772326[/C][/ROW]
[ROW][C]17[/C][C]2783.7[/C][C]2774.80941074266[/C][C]8.89058925734025[/C][/ROW]
[ROW][C]18[/C][C]2822.84[/C][C]2763.09634142871[/C][C]59.743658571294[/C][/ROW]
[ROW][C]19[/C][C]2835.8[/C][C]2814.78188439048[/C][C]21.0181156095182[/C][/ROW]
[ROW][C]20[/C][C]2823.22[/C][C]2832.1554686714[/C][C]-8.93546867139958[/C][/ROW]
[ROW][C]21[/C][C]2879.14[/C][C]2817.69911377815[/C][C]61.4408862218465[/C][/ROW]
[ROW][C]22[/C][C]3003.5[/C][C]2886.52105678163[/C][C]116.978943218375[/C][/ROW]
[ROW][C]23[/C][C]2910.7[/C][C]3035.4454104363[/C][C]-124.745410436297[/C][/ROW]
[ROW][C]24[/C][C]2895.54[/C][C]2916.45017995765[/C][C]-20.9101799576461[/C][/ROW]
[ROW][C]25[/C][C]2982.36[/C][C]2896.89926103386[/C][C]85.4607389661433[/C][/ROW]
[ROW][C]26[/C][C]3087.2[/C][C]3001.6651216973[/C][C]85.5348783026989[/C][/ROW]
[ROW][C]27[/C][C]3195.28[/C][C]3124.4665508454[/C][C]70.813449154597[/C][/ROW]
[ROW][C]28[/C][C]3272.72[/C][C]3247.41663396193[/C][C]25.3033660380702[/C][/ROW]
[ROW][C]29[/C][C]3390.6[/C][C]3330.17007597903[/C][C]60.4299240209684[/C][/ROW]
[ROW][C]30[/C][C]3676.12[/C][C]3460.73972750208[/C][C]215.380272497917[/C][/ROW]
[ROW][C]31[/C][C]4052.18[/C][C]3791.48733033657[/C][C]260.692669663433[/C][/ROW]
[ROW][C]32[/C][C]4431.2[/C][C]4222.29006228995[/C][C]208.909937710055[/C][/ROW]
[ROW][C]33[/C][C]4554.96[/C][C]4645.17896254412[/C][C]-90.2189625441151[/C][/ROW]
[ROW][C]34[/C][C]4279.7[/C][C]4749.99392473373[/C][C]-470.293924733729[/C][/ROW]
[ROW][C]35[/C][C]4391.86[/C][C]4375.97712311656[/C][C]15.8828768834364[/C][/ROW]
[ROW][C]36[/C][C]4482.82[/C][C]4491.47236101566[/C][C]-8.65236101566188[/C][/ROW]
[ROW][C]37[/C][C]4530.68[/C][C]4580.61545576683[/C][C]-49.9354557668266[/C][/ROW]
[ROW][C]38[/C][C]4580.66[/C][C]4617.98953273131[/C][C]-37.3295327313144[/C][/ROW]
[ROW][C]39[/C][C]4623.5[/C][C]4660.13072158678[/C][C]-36.6307215867828[/C][/ROW]
[ROW][C]40[/C][C]4720.14[/C][C]4695.27865346813[/C][C]24.8613465318676[/C][/ROW]
[ROW][C]41[/C][C]4811.82[/C][C]4797.13927601556[/C][C]14.6807239844393[/C][/ROW]
[ROW][C]42[/C][C]4980.18[/C][C]4891.90207438883[/C][C]88.2779256111708[/C][/ROW]
[ROW][C]43[/C][C]5174.28[/C][C]5078.79951476018[/C][C]95.4804852398247[/C][/ROW]
[ROW][C]44[/C][C]5181.24[/C][C]5292.94941726419[/C][C]-111.709417264186[/C][/ROW]
[/TABLE]
Source: https://freestatistics.org/blog/index.php?pk=300107&T=2

Globally Unique Identifier (entire table): ba.freestatistics.org/blog/index.php?pk=300107&T=2

As an alternative you can also use a QR Code:  

The GUIDs for individual cells are displayed in the table below:

Interpolation Forecasts of Exponential Smoothing
tObservedFittedResiduals
32998.123365.1-366.98
42896.33050.21804118778-153.918041187781
529522916.0768636018935.9231363981089
63060.242979.3203462372380.9196537627695
72988.323104.5526265396-116.232626539605
828893008.22499157576-119.224991575762
92881.822883.86899127548-2.04899127547742
102969.222876.2587245544692.9612754455352
113026.22983.179619370343.0203806297009
123146.083049.1934490072696.8865509927396
133032.483189.41861060206-156.938610602062
142719.743042.86314505554-323.12314505554
152785.182662.27066673099122.909333269014
162797.282753.5203402227743.7596597772326
172783.72774.809410742668.89058925734025
182822.842763.0963414287159.743658571294
192835.82814.7818843904821.0181156095182
202823.222832.1554686714-8.93546867139958
212879.142817.6991137781561.4408862218465
223003.52886.52105678163116.978943218375
232910.73035.4454104363-124.745410436297
242895.542916.45017995765-20.9101799576461
252982.362896.8992610338685.4607389661433
263087.23001.665121697385.5348783026989
273195.283124.466550845470.813449154597
283272.723247.4166339619325.3033660380702
293390.63330.1700759790360.4299240209684
303676.123460.73972750208215.380272497917
314052.183791.48733033657260.692669663433
324431.24222.29006228995208.909937710055
334554.964645.17896254412-90.2189625441151
344279.74749.99392473373-470.293924733729
354391.864375.9771231165615.8828768834364
364482.824491.47236101566-8.65236101566188
374530.684580.61545576683-49.9354557668266
384580.664617.98953273131-37.3295327313144
394623.54660.13072158678-36.6307215867828
404720.144695.2786534681324.8613465318676
414811.824797.1392760155614.6807239844393
424980.184891.9020743888388.2779256111708
435174.285078.7995147601895.4804852398247
445181.245292.94941726419-111.709417264186


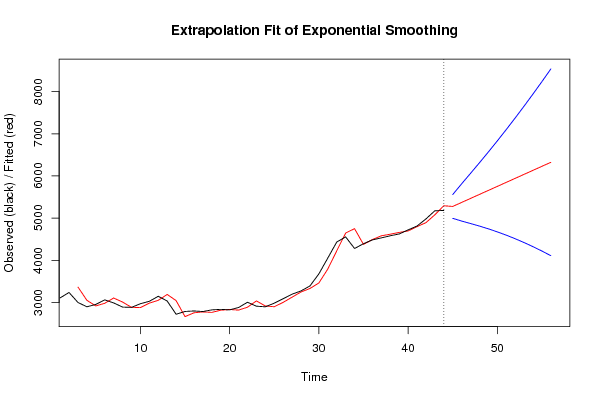
Extrapolation Forecasts of Exponential Smoothing
tForecast95% Lower Bound95% Upper Bound
455276.451608903654995.262092728125557.64112507917
465371.66321780734930.269592569945813.05684304466
475466.874826710954871.681221744676062.06843167723
485562.08643561464810.872823385676313.30004784353
495657.298044518254745.157273568226569.43881546827
505752.50965342194673.498451394846831.52085544895
515847.721262325554595.488010242297099.9545144088
525942.93287122924510.996183099447374.86955935895
536038.144480132844420.027698228597656.26126203709
546133.356089036494322.654870436157944.05730763683
556228.567697940144218.98398719138238.15140868899
566323.779306843794109.137497319638538.42111636795

\begin{tabular}{lllllllll}
\hline
Extrapolation Forecasts of Exponential Smoothing \tabularnewline
t & Forecast & 95% Lower Bound & 95% Upper Bound \tabularnewline
45 & 5276.45160890365 & 4995.26209272812 & 5557.64112507917 \tabularnewline
46 & 5371.6632178073 & 4930.26959256994 & 5813.05684304466 \tabularnewline
47 & 5466.87482671095 & 4871.68122174467 & 6062.06843167723 \tabularnewline
48 & 5562.0864356146 & 4810.87282338567 & 6313.30004784353 \tabularnewline
49 & 5657.29804451825 & 4745.15727356822 & 6569.43881546827 \tabularnewline
50 & 5752.5096534219 & 4673.49845139484 & 6831.52085544895 \tabularnewline
51 & 5847.72126232555 & 4595.48801024229 & 7099.9545144088 \tabularnewline
52 & 5942.9328712292 & 4510.99618309944 & 7374.86955935895 \tabularnewline
53 & 6038.14448013284 & 4420.02769822859 & 7656.26126203709 \tabularnewline
54 & 6133.35608903649 & 4322.65487043615 & 7944.05730763683 \tabularnewline
55 & 6228.56769794014 & 4218.9839871913 & 8238.15140868899 \tabularnewline
56 & 6323.77930684379 & 4109.13749731963 & 8538.42111636795 \tabularnewline
\hline
\end{tabular}
%Source: https://freestatistics.org/blog/index.php?pk=300107&T=3

[TABLE]
[ROW][C]Extrapolation Forecasts of Exponential Smoothing[/C][/ROW]
[ROW][C]t[/C][C]Forecast[/C][C]95% Lower Bound[/C][C]95% Upper Bound[/C][/ROW]
[ROW][C]45[/C][C]5276.45160890365[/C][C]4995.26209272812[/C][C]5557.64112507917[/C][/ROW]
[ROW][C]46[/C][C]5371.6632178073[/C][C]4930.26959256994[/C][C]5813.05684304466[/C][/ROW]
[ROW][C]47[/C][C]5466.87482671095[/C][C]4871.68122174467[/C][C]6062.06843167723[/C][/ROW]
[ROW][C]48[/C][C]5562.0864356146[/C][C]4810.87282338567[/C][C]6313.30004784353[/C][/ROW]
[ROW][C]49[/C][C]5657.29804451825[/C][C]4745.15727356822[/C][C]6569.43881546827[/C][/ROW]
[ROW][C]50[/C][C]5752.5096534219[/C][C]4673.49845139484[/C][C]6831.52085544895[/C][/ROW]
[ROW][C]51[/C][C]5847.72126232555[/C][C]4595.48801024229[/C][C]7099.9545144088[/C][/ROW]
[ROW][C]52[/C][C]5942.9328712292[/C][C]4510.99618309944[/C][C]7374.86955935895[/C][/ROW]
[ROW][C]53[/C][C]6038.14448013284[/C][C]4420.02769822859[/C][C]7656.26126203709[/C][/ROW]
[ROW][C]54[/C][C]6133.35608903649[/C][C]4322.65487043615[/C][C]7944.05730763683[/C][/ROW]
[ROW][C]55[/C][C]6228.56769794014[/C][C]4218.9839871913[/C][C]8238.15140868899[/C][/ROW]
[ROW][C]56[/C][C]6323.77930684379[/C][C]4109.13749731963[/C][C]8538.42111636795[/C][/ROW]
[/TABLE]
Source: https://freestatistics.org/blog/index.php?pk=300107&T=3

Globally Unique Identifier (entire table): ba.freestatistics.org/blog/index.php?pk=300107&T=3

As an alternative you can also use a QR Code:  

The GUIDs for individual cells are displayed in the table below:

Extrapolation Forecasts of Exponential Smoothing
tForecast95% Lower Bound95% Upper Bound
455276.451608903654995.262092728125557.64112507917
465371.66321780734930.269592569945813.05684304466
475466.874826710954871.681221744676062.06843167723
485562.08643561464810.872823385676313.30004784353
495657.298044518254745.157273568226569.43881546827
505752.50965342194673.498451394846831.52085544895
515847.721262325554595.488010242297099.9545144088
525942.93287122924510.996183099447374.86955935895
536038.144480132844420.027698228597656.26126203709
546133.356089036494322.654870436157944.05730763683
556228.567697940144218.98398719138238.15140868899
566323.779306843794109.137497319638538.42111636795


Parameters (Session):
par1 = 1 ; par2 = Double ; par3 = additive ; par4 = 12 ;
Parameters (R input):
par1 = 1 ; par2 = Double ; par3 = additive ; par4 = 12 ;
R code (references can be found in the software module):
par1 <- as.numeric(par1)
par4 <- as.numeric(par4)
if (par2 == 'Single') K <- 1
if (par2 == 'Double') K <- 2
if (par2 == 'Triple') K <- par1
nx <- length(x)
nxmK <- nx - K
x <- ts(x, frequency = par1)
if (par2 == 'Single') fit <- HoltWinters(x, gamma=F, beta=F)
if (par2 == 'Double') fit <- HoltWinters(x, gamma=F)
if (par2 == 'Triple') fit <- HoltWinters(x, seasonal=par3)
fit
myresid <- x - fit$fitted[,'xhat']
bitmap(file='test1.png')
op <- par(mfrow=c(2,1))
plot(fit,ylab='Observed (black) / Fitted (red)',main='Interpolation Fit of Exponential Smoothing')
plot(myresid,ylab='Residuals',main='Interpolation Prediction Errors')
par(op)
dev.off()
bitmap(file='test2.png')
p <- predict(fit, par4, prediction.interval=TRUE)
np <- length(p[,1])
plot(fit,p,ylab='Observed (black) / Fitted (red)',main='Extrapolation Fit of Exponential Smoothing')
dev.off()
bitmap(file='test3.png')
op <- par(mfrow = c(2,2))
acf(as.numeric(myresid),lag.max = nx/2,main='Residual ACF')
spectrum(myresid,main='Residals Periodogram')
cpgram(myresid,main='Residal Cumulative Periodogram')
qqnorm(myresid,main='Residual Normal QQ Plot')
qqline(myresid)
par(op)
dev.off()
load(file='createtable')
a<-table.start()
a<-table.row.start(a)
a<-table.element(a,'Estimated Parameters of Exponential Smoothing',2,TRUE)
a<-table.row.end(a)
a<-table.row.start(a)
a<-table.element(a,'Parameter',header=TRUE)
a<-table.element(a,'Value',header=TRUE)
a<-table.row.end(a)
a<-table.row.start(a)
a<-table.element(a,'alpha',header=TRUE)
a<-table.element(a,fit$alpha)
a<-table.row.end(a)
a<-table.row.start(a)
a<-table.element(a,'beta',header=TRUE)
a<-table.element(a,fit$beta)
a<-table.row.end(a)
a<-table.row.start(a)
a<-table.element(a,'gamma',header=TRUE)
a<-table.element(a,fit$gamma)
a<-table.row.end(a)
a<-table.end(a)
table.save(a,file='mytable.tab')
a<-table.start()
a<-table.row.start(a)
a<-table.element(a,'Interpolation Forecasts of Exponential Smoothing',4,TRUE)
a<-table.row.end(a)
a<-table.row.start(a)
a<-table.element(a,'t',header=TRUE)
a<-table.element(a,'Observed',header=TRUE)
a<-table.element(a,'Fitted',header=TRUE)
a<-table.element(a,'Residuals',header=TRUE)
a<-table.row.end(a)
for (i in 1:nxmK) {
a<-table.row.start(a)
a<-table.element(a,i+K,header=TRUE)
a<-table.element(a,x[i+K])
a<-table.element(a,fit$fitted[i,'xhat'])
a<-table.element(a,myresid[i])
a<-table.row.end(a)
}
a<-table.end(a)
table.save(a,file='mytable1.tab')
a<-table.start()
a<-table.row.start(a)
a<-table.element(a,'Extrapolation Forecasts of Exponential Smoothing',4,TRUE)
a<-table.row.end(a)
a<-table.row.start(a)
a<-table.element(a,'t',header=TRUE)
a<-table.element(a,'Forecast',header=TRUE)
a<-table.element(a,'95% Lower Bound',header=TRUE)
a<-table.element(a,'95% Upper Bound',header=TRUE)
a<-table.row.end(a)
for (i in 1:np) {
a<-table.row.start(a)
a<-table.element(a,nx+i,header=TRUE)
a<-table.element(a,p[i,'fit'])
a<-table.element(a,p[i,'lwr'])
a<-table.element(a,p[i,'upr'])
a<-table.row.end(a)
}
a<-table.end(a)
table.save(a,file='mytable2.tab')