Free Statistics

of Irreproducible Research!

Author's title

Author*The author of this computation has been verified*
R Software Modulerwasp_exponentialsmoothing.wasp
Title produced by softwareExponential Smoothing
Date of computationFri, 16 Dec 2016 12:35:10 +0100
Cite this page as followsStatistical Computations at FreeStatistics.org, Office for Research Development and Education, URL https://freestatistics.org/blog/index.php?v=date/2016/Dec/16/t1481889110fhgvi8jr6d3dy1v.htm/, Retrieved Thu, 02 May 2024 22:01:39 +0000
Statistical Computations at FreeStatistics.org, Office for Research Development and Education, URL https://freestatistics.org/blog/index.php?pk=300193, Retrieved Thu, 02 May 2024 22:01:39 +0000
QR Codes:

Original text written by user:
IsPrivate?No (this computation is public)
User-defined keywords
Estimated Impact59
Family? (F = Feedback message, R = changed R code, M = changed R Module, P = changed Parameters, D = changed Data)
-       [Exponential Smoothing] [] [2016-12-16 11:35:10] [edf5d828a362f128b5245bc1504a7130] [Current]
Feedback Forum

Post a new message
Dataseries X:
3860
4300
6500
4830
2690
3700
4830
3270
2650
4070
5020
3350
2720
3010
5680
1950
2510
2580
4350
2830
1630
2720
4490
2360


Summary of computational transaction
Raw Input view raw input (R code)
Raw Outputview raw output of R engine
Computing time2 seconds
R ServerBig Analytics Cloud Computing Center

\begin{tabular}{lllllllll}
\hline
Summary of computational transaction \tabularnewline
Raw Input view raw input (R code)  \tabularnewline
Raw Outputview raw output of R engine  \tabularnewline
Computing time2 seconds \tabularnewline
R ServerBig Analytics Cloud Computing Center \tabularnewline
\hline
\end{tabular}
%Source: https://freestatistics.org/blog/index.php?pk=300193&T=0

[TABLE]
[ROW]
Summary of computational transaction[/C][/ROW] [ROW]Raw Input[/C] view raw input (R code) [/C][/ROW] [ROW]Raw Output[/C]view raw output of R engine [/C][/ROW] [ROW]Computing time[/C]2 seconds[/C][/ROW] [ROW]R Server[/C]Big Analytics Cloud Computing Center[/C][/ROW] [/TABLE] Source: https://freestatistics.org/blog/index.php?pk=300193&T=0

Globally Unique Identifier (entire table): ba.freestatistics.org/blog/index.php?pk=300193&T=0

As an alternative you can also use a QR Code:  

The GUIDs for individual cells are displayed in the table below:

Summary of computational transaction
Raw Input view raw input (R code)
Raw Outputview raw output of R engine
Computing time2 seconds
R ServerBig Analytics Cloud Computing Center


Estimated Parameters of Exponential Smoothing
ParameterValue
alpha0.272874135228388
beta0.339206185588715
gammaFALSE

\begin{tabular}{lllllllll}
\hline
Estimated Parameters of Exponential Smoothing \tabularnewline
Parameter & Value \tabularnewline
alpha & 0.272874135228388 \tabularnewline
beta & 0.339206185588715 \tabularnewline
gamma & FALSE \tabularnewline
\hline
\end{tabular}
%Source: https://freestatistics.org/blog/index.php?pk=300193&T=1

[TABLE]
[ROW][C]Estimated Parameters of Exponential Smoothing[/C][/ROW]
[ROW][C]Parameter[/C][C]Value[/C][/ROW]
[ROW][C]alpha[/C][C]0.272874135228388[/C][/ROW]
[ROW][C]beta[/C][C]0.339206185588715[/C][/ROW]
[ROW][C]gamma[/C][C]FALSE[/C][/ROW]
[/TABLE]
Source: https://freestatistics.org/blog/index.php?pk=300193&T=1

Globally Unique Identifier (entire table): ba.freestatistics.org/blog/index.php?pk=300193&T=1

As an alternative you can also use a QR Code:  

The GUIDs for individual cells are displayed in the table below:

Estimated Parameters of Exponential Smoothing
ParameterValue
alpha0.272874135228388
beta0.339206185588715
gammaFALSE


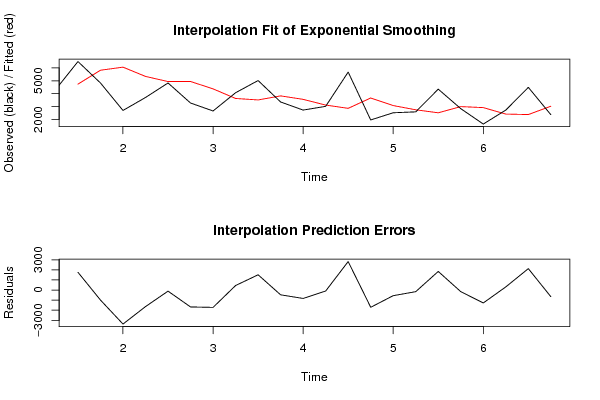
Interpolation Forecasts of Exponential Smoothing
tObservedFittedResiduals
3650047401760
448305823.16512442165-993.165124421652
526906063.1347419664-3373.1347419664
637005341.45285101771-1641.45285101771
748304940.36830672542-110.368306725417
832704946.86137732772-1676.86137732772
926504370.68771987363-1720.68771987363
1040703623.28710869929446.712891300706
1150203508.662075807541511.33792419246
1233503824.43601494788-474.436014947876
1327203554.42952806356-834.429528063561
1430103108.95482936679-98.954829366794
1556802855.012835218822824.98716478118
1619503660.42147576898-1710.42147576898
1725103069.91677688202-559.916776882023
1825802741.52882300961-161.528823009606
1943502506.899433639731843.10056636027
2028302989.88003959755-159.880039597555
2116302911.50045330252-1281.50045330252
2227202408.44322268095311.556777319052
2344902368.927986781372121.07201321863
2423603019.51034270145-659.510342701452

\begin{tabular}{lllllllll}
\hline
Interpolation Forecasts of Exponential Smoothing \tabularnewline
t & Observed & Fitted & Residuals \tabularnewline
3 & 6500 & 4740 & 1760 \tabularnewline
4 & 4830 & 5823.16512442165 & -993.165124421652 \tabularnewline
5 & 2690 & 6063.1347419664 & -3373.1347419664 \tabularnewline
6 & 3700 & 5341.45285101771 & -1641.45285101771 \tabularnewline
7 & 4830 & 4940.36830672542 & -110.368306725417 \tabularnewline
8 & 3270 & 4946.86137732772 & -1676.86137732772 \tabularnewline
9 & 2650 & 4370.68771987363 & -1720.68771987363 \tabularnewline
10 & 4070 & 3623.28710869929 & 446.712891300706 \tabularnewline
11 & 5020 & 3508.66207580754 & 1511.33792419246 \tabularnewline
12 & 3350 & 3824.43601494788 & -474.436014947876 \tabularnewline
13 & 2720 & 3554.42952806356 & -834.429528063561 \tabularnewline
14 & 3010 & 3108.95482936679 & -98.954829366794 \tabularnewline
15 & 5680 & 2855.01283521882 & 2824.98716478118 \tabularnewline
16 & 1950 & 3660.42147576898 & -1710.42147576898 \tabularnewline
17 & 2510 & 3069.91677688202 & -559.916776882023 \tabularnewline
18 & 2580 & 2741.52882300961 & -161.528823009606 \tabularnewline
19 & 4350 & 2506.89943363973 & 1843.10056636027 \tabularnewline
20 & 2830 & 2989.88003959755 & -159.880039597555 \tabularnewline
21 & 1630 & 2911.50045330252 & -1281.50045330252 \tabularnewline
22 & 2720 & 2408.44322268095 & 311.556777319052 \tabularnewline
23 & 4490 & 2368.92798678137 & 2121.07201321863 \tabularnewline
24 & 2360 & 3019.51034270145 & -659.510342701452 \tabularnewline
\hline
\end{tabular}
%Source: https://freestatistics.org/blog/index.php?pk=300193&T=2

[TABLE]
[ROW][C]Interpolation Forecasts of Exponential Smoothing[/C][/ROW]
[ROW][C]t[/C][C]Observed[/C][C]Fitted[/C][C]Residuals[/C][/ROW]
[ROW][C]3[/C][C]6500[/C][C]4740[/C][C]1760[/C][/ROW]
[ROW][C]4[/C][C]4830[/C][C]5823.16512442165[/C][C]-993.165124421652[/C][/ROW]
[ROW][C]5[/C][C]2690[/C][C]6063.1347419664[/C][C]-3373.1347419664[/C][/ROW]
[ROW][C]6[/C][C]3700[/C][C]5341.45285101771[/C][C]-1641.45285101771[/C][/ROW]
[ROW][C]7[/C][C]4830[/C][C]4940.36830672542[/C][C]-110.368306725417[/C][/ROW]
[ROW][C]8[/C][C]3270[/C][C]4946.86137732772[/C][C]-1676.86137732772[/C][/ROW]
[ROW][C]9[/C][C]2650[/C][C]4370.68771987363[/C][C]-1720.68771987363[/C][/ROW]
[ROW][C]10[/C][C]4070[/C][C]3623.28710869929[/C][C]446.712891300706[/C][/ROW]
[ROW][C]11[/C][C]5020[/C][C]3508.66207580754[/C][C]1511.33792419246[/C][/ROW]
[ROW][C]12[/C][C]3350[/C][C]3824.43601494788[/C][C]-474.436014947876[/C][/ROW]
[ROW][C]13[/C][C]2720[/C][C]3554.42952806356[/C][C]-834.429528063561[/C][/ROW]
[ROW][C]14[/C][C]3010[/C][C]3108.95482936679[/C][C]-98.954829366794[/C][/ROW]
[ROW][C]15[/C][C]5680[/C][C]2855.01283521882[/C][C]2824.98716478118[/C][/ROW]
[ROW][C]16[/C][C]1950[/C][C]3660.42147576898[/C][C]-1710.42147576898[/C][/ROW]
[ROW][C]17[/C][C]2510[/C][C]3069.91677688202[/C][C]-559.916776882023[/C][/ROW]
[ROW][C]18[/C][C]2580[/C][C]2741.52882300961[/C][C]-161.528823009606[/C][/ROW]
[ROW][C]19[/C][C]4350[/C][C]2506.89943363973[/C][C]1843.10056636027[/C][/ROW]
[ROW][C]20[/C][C]2830[/C][C]2989.88003959755[/C][C]-159.880039597555[/C][/ROW]
[ROW][C]21[/C][C]1630[/C][C]2911.50045330252[/C][C]-1281.50045330252[/C][/ROW]
[ROW][C]22[/C][C]2720[/C][C]2408.44322268095[/C][C]311.556777319052[/C][/ROW]
[ROW][C]23[/C][C]4490[/C][C]2368.92798678137[/C][C]2121.07201321863[/C][/ROW]
[ROW][C]24[/C][C]2360[/C][C]3019.51034270145[/C][C]-659.510342701452[/C][/ROW]
[/TABLE]
Source: https://freestatistics.org/blog/index.php?pk=300193&T=2

Globally Unique Identifier (entire table): ba.freestatistics.org/blog/index.php?pk=300193&T=2

As an alternative you can also use a QR Code:  

The GUIDs for individual cells are displayed in the table below:

Interpolation Forecasts of Exponential Smoothing
tObservedFittedResiduals
3650047401760
448305823.16512442165-993.165124421652
526906063.1347419664-3373.1347419664
637005341.45285101771-1641.45285101771
748304940.36830672542-110.368306725417
832704946.86137732772-1676.86137732772
926504370.68771987363-1720.68771987363
1040703623.28710869929446.712891300706
1150203508.662075807541511.33792419246
1233503824.43601494788-474.436014947876
1327203554.42952806356-834.429528063561
1430103108.95482936679-98.954829366794
1556802855.012835218822824.98716478118
1619503660.42147576898-1710.42147576898
1725103069.91677688202-559.916776882023
1825802741.52882300961-161.528823009606
1943502506.899433639731843.10056636027
2028302989.88003959755-159.880039597555
2116302911.50045330252-1281.50045330252
2227202408.44322268095311.556777319052
2344902368.927986781372121.07201321863
2423603019.51034270145-659.510342701452


Extrapolation Forecasts of Exponential Smoothing
tForecast95% Lower Bound95% Upper Bound
252850.29902338183-104.2318616969215804.82990846057
262861.05101850104-284.5775912791396006.67962828121
272871.80301362025-552.5253786855816296.13140592607
282882.55500873946-908.4823988131196673.59241629203
292893.30700385867-1347.255874289357133.86988200668
302904.05899897788-1861.109071937347669.2270698931
312914.81099409709-2441.951031475618271.57301966978
322925.5629892163-3082.445549284328933.57152771692
332936.31498433551-3776.37474898549649.00471765641
342947.06697945472-4518.6268986486610412.7608575581
352957.81897457393-5305.0429138626411220.6808630105
362968.57096969314-6132.2357574514312069.3776968377

\begin{tabular}{lllllllll}
\hline
Extrapolation Forecasts of Exponential Smoothing \tabularnewline
t & Forecast & 95% Lower Bound & 95% Upper Bound \tabularnewline
25 & 2850.29902338183 & -104.231861696921 & 5804.82990846057 \tabularnewline
26 & 2861.05101850104 & -284.577591279139 & 6006.67962828121 \tabularnewline
27 & 2871.80301362025 & -552.525378685581 & 6296.13140592607 \tabularnewline
28 & 2882.55500873946 & -908.482398813119 & 6673.59241629203 \tabularnewline
29 & 2893.30700385867 & -1347.25587428935 & 7133.86988200668 \tabularnewline
30 & 2904.05899897788 & -1861.10907193734 & 7669.2270698931 \tabularnewline
31 & 2914.81099409709 & -2441.95103147561 & 8271.57301966978 \tabularnewline
32 & 2925.5629892163 & -3082.44554928432 & 8933.57152771692 \tabularnewline
33 & 2936.31498433551 & -3776.3747489854 & 9649.00471765641 \tabularnewline
34 & 2947.06697945472 & -4518.62689864866 & 10412.7608575581 \tabularnewline
35 & 2957.81897457393 & -5305.04291386264 & 11220.6808630105 \tabularnewline
36 & 2968.57096969314 & -6132.23575745143 & 12069.3776968377 \tabularnewline
\hline
\end{tabular}
%Source: https://freestatistics.org/blog/index.php?pk=300193&T=3

[TABLE]
[ROW][C]Extrapolation Forecasts of Exponential Smoothing[/C][/ROW]
[ROW][C]t[/C][C]Forecast[/C][C]95% Lower Bound[/C][C]95% Upper Bound[/C][/ROW]
[ROW][C]25[/C][C]2850.29902338183[/C][C]-104.231861696921[/C][C]5804.82990846057[/C][/ROW]
[ROW][C]26[/C][C]2861.05101850104[/C][C]-284.577591279139[/C][C]6006.67962828121[/C][/ROW]
[ROW][C]27[/C][C]2871.80301362025[/C][C]-552.525378685581[/C][C]6296.13140592607[/C][/ROW]
[ROW][C]28[/C][C]2882.55500873946[/C][C]-908.482398813119[/C][C]6673.59241629203[/C][/ROW]
[ROW][C]29[/C][C]2893.30700385867[/C][C]-1347.25587428935[/C][C]7133.86988200668[/C][/ROW]
[ROW][C]30[/C][C]2904.05899897788[/C][C]-1861.10907193734[/C][C]7669.2270698931[/C][/ROW]
[ROW][C]31[/C][C]2914.81099409709[/C][C]-2441.95103147561[/C][C]8271.57301966978[/C][/ROW]
[ROW][C]32[/C][C]2925.5629892163[/C][C]-3082.44554928432[/C][C]8933.57152771692[/C][/ROW]
[ROW][C]33[/C][C]2936.31498433551[/C][C]-3776.3747489854[/C][C]9649.00471765641[/C][/ROW]
[ROW][C]34[/C][C]2947.06697945472[/C][C]-4518.62689864866[/C][C]10412.7608575581[/C][/ROW]
[ROW][C]35[/C][C]2957.81897457393[/C][C]-5305.04291386264[/C][C]11220.6808630105[/C][/ROW]
[ROW][C]36[/C][C]2968.57096969314[/C][C]-6132.23575745143[/C][C]12069.3776968377[/C][/ROW]
[/TABLE]
Source: https://freestatistics.org/blog/index.php?pk=300193&T=3

Globally Unique Identifier (entire table): ba.freestatistics.org/blog/index.php?pk=300193&T=3

As an alternative you can also use a QR Code:  

The GUIDs for individual cells are displayed in the table below:

Extrapolation Forecasts of Exponential Smoothing
tForecast95% Lower Bound95% Upper Bound
252850.29902338183-104.2318616969215804.82990846057
262861.05101850104-284.5775912791396006.67962828121
272871.80301362025-552.5253786855816296.13140592607
282882.55500873946-908.4823988131196673.59241629203
292893.30700385867-1347.255874289357133.86988200668
302904.05899897788-1861.109071937347669.2270698931
312914.81099409709-2441.951031475618271.57301966978
322925.5629892163-3082.445549284328933.57152771692
332936.31498433551-3776.37474898549649.00471765641
342947.06697945472-4518.6268986486610412.7608575581
352957.81897457393-5305.0429138626411220.6808630105
362968.57096969314-6132.2357574514312069.3776968377


Parameters (Session):
Parameters (R input):
par1 = 4 ; par2 = Double ; par3 = additive ; par4 = 12 ;
R code (references can be found in the software module):
par1 <- as.numeric(par1)
par4 <- as.numeric(par4)
if (par2 == 'Single') K <- 1
if (par2 == 'Double') K <- 2
if (par2 == 'Triple') K <- par1
nx <- length(x)
nxmK <- nx - K
x <- ts(x, frequency = par1)
if (par2 == 'Single') fit <- HoltWinters(x, gamma=F, beta=F)
if (par2 == 'Double') fit <- HoltWinters(x, gamma=F)
if (par2 == 'Triple') fit <- HoltWinters(x, seasonal=par3)
fit
myresid <- x - fit$fitted[,'xhat']
bitmap(file='test1.png')
op <- par(mfrow=c(2,1))
plot(fit,ylab='Observed (black) / Fitted (red)',main='Interpolation Fit of Exponential Smoothing')
plot(myresid,ylab='Residuals',main='Interpolation Prediction Errors')
par(op)
dev.off()
bitmap(file='test2.png')
p <- predict(fit, par4, prediction.interval=TRUE)
np <- length(p[,1])
plot(fit,p,ylab='Observed (black) / Fitted (red)',main='Extrapolation Fit of Exponential Smoothing')
dev.off()
bitmap(file='test3.png')
op <- par(mfrow = c(2,2))
acf(as.numeric(myresid),lag.max = nx/2,main='Residual ACF')
spectrum(myresid,main='Residals Periodogram')
cpgram(myresid,main='Residal Cumulative Periodogram')
qqnorm(myresid,main='Residual Normal QQ Plot')
qqline(myresid)
par(op)
dev.off()
load(file='createtable')
a<-table.start()
a<-table.row.start(a)
a<-table.element(a,'Estimated Parameters of Exponential Smoothing',2,TRUE)
a<-table.row.end(a)
a<-table.row.start(a)
a<-table.element(a,'Parameter',header=TRUE)
a<-table.element(a,'Value',header=TRUE)
a<-table.row.end(a)
a<-table.row.start(a)
a<-table.element(a,'alpha',header=TRUE)
a<-table.element(a,fit$alpha)
a<-table.row.end(a)
a<-table.row.start(a)
a<-table.element(a,'beta',header=TRUE)
a<-table.element(a,fit$beta)
a<-table.row.end(a)
a<-table.row.start(a)
a<-table.element(a,'gamma',header=TRUE)
a<-table.element(a,fit$gamma)
a<-table.row.end(a)
a<-table.end(a)
table.save(a,file='mytable.tab')
a<-table.start()
a<-table.row.start(a)
a<-table.element(a,'Interpolation Forecasts of Exponential Smoothing',4,TRUE)
a<-table.row.end(a)
a<-table.row.start(a)
a<-table.element(a,'t',header=TRUE)
a<-table.element(a,'Observed',header=TRUE)
a<-table.element(a,'Fitted',header=TRUE)
a<-table.element(a,'Residuals',header=TRUE)
a<-table.row.end(a)
for (i in 1:nxmK) {
a<-table.row.start(a)
a<-table.element(a,i+K,header=TRUE)
a<-table.element(a,x[i+K])
a<-table.element(a,fit$fitted[i,'xhat'])
a<-table.element(a,myresid[i])
a<-table.row.end(a)
}
a<-table.end(a)
table.save(a,file='mytable1.tab')
a<-table.start()
a<-table.row.start(a)
a<-table.element(a,'Extrapolation Forecasts of Exponential Smoothing',4,TRUE)
a<-table.row.end(a)
a<-table.row.start(a)
a<-table.element(a,'t',header=TRUE)
a<-table.element(a,'Forecast',header=TRUE)
a<-table.element(a,'95% Lower Bound',header=TRUE)
a<-table.element(a,'95% Upper Bound',header=TRUE)
a<-table.row.end(a)
for (i in 1:np) {
a<-table.row.start(a)
a<-table.element(a,nx+i,header=TRUE)
a<-table.element(a,p[i,'fit'])
a<-table.element(a,p[i,'lwr'])
a<-table.element(a,p[i,'upr'])
a<-table.row.end(a)
}
a<-table.end(a)
table.save(a,file='mytable2.tab')