Free Statistics

of Irreproducible Research!

Author's title

Author*The author of this computation has been verified*
R Software Modulerwasp_autocorrelation.wasp
Title produced by software(Partial) Autocorrelation Function
Date of computationFri, 16 Dec 2016 14:56:32 +0100
Cite this page as followsStatistical Computations at FreeStatistics.org, Office for Research Development and Education, URL https://freestatistics.org/blog/index.php?v=date/2016/Dec/16/t1481896682djrbysj26o0tyfy.htm/, Retrieved Thu, 02 May 2024 21:32:45 +0000
Statistical Computations at FreeStatistics.org, Office for Research Development and Education, URL https://freestatistics.org/blog/index.php?pk=300274, Retrieved Thu, 02 May 2024 21:32:45 +0000
QR Codes:

Original text written by user:
IsPrivate?No (this computation is public)
User-defined keywords
Estimated Impact62
Family? (F = Feedback message, R = changed R code, M = changed R Module, P = changed Parameters, D = changed Data)
-       [(Partial) Autocorrelation Function] [ACF zonder differ...] [2016-12-16 13:56:32] [9fb47d69755d1f4b66b6f2591280f9e0] [Current]
Feedback Forum

Post a new message
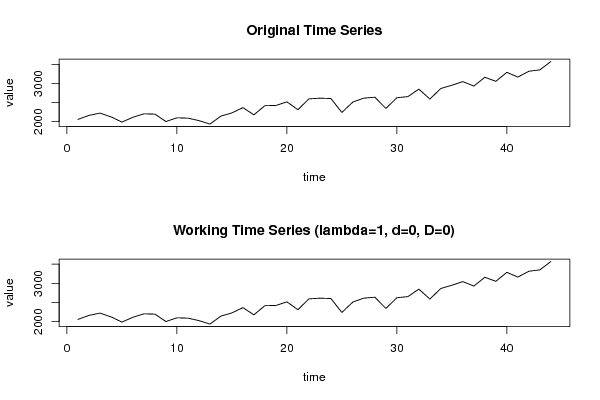
Dataseries X:
2058.44
2163.84
2223.38
2126.36
1989.96
2115.1
2204.74
2197.16
2003.2
2100.46
2091.98
2027.38
1937.32
2145.32
2228.88
2367.04
2178.48
2417.94
2424.08
2517.46
2313
2595.96
2614.1
2604.26
2240.9
2514.2
2615.36
2638.56
2345.84
2625.46
2654.58
2850.46
2591.16
2868.08
2951.72
3046.74
2930.46
3161.2
3054.26
3289.48
3165.14
3317.62
3353.74
3571.6


Summary of computational transaction
Raw Input view raw input (R code)
Raw Outputview raw output of R engine
Computing time1 seconds
R ServerBig Analytics Cloud Computing Center

\begin{tabular}{lllllllll}
\hline
Summary of computational transaction \tabularnewline
Raw Input view raw input (R code)  \tabularnewline
Raw Outputview raw output of R engine  \tabularnewline
Computing time1 seconds \tabularnewline
R ServerBig Analytics Cloud Computing Center \tabularnewline
\hline
\end{tabular}
%Source: https://freestatistics.org/blog/index.php?pk=300274&T=0

[TABLE]
[ROW]
Summary of computational transaction[/C][/ROW] [ROW]Raw Input[/C] view raw input (R code) [/C][/ROW] [ROW]Raw Output[/C]view raw output of R engine [/C][/ROW] [ROW]Computing time[/C]1 seconds[/C][/ROW] [ROW]R Server[/C]Big Analytics Cloud Computing Center[/C][/ROW] [/TABLE] Source: https://freestatistics.org/blog/index.php?pk=300274&T=0

Globally Unique Identifier (entire table): ba.freestatistics.org/blog/index.php?pk=300274&T=0

As an alternative you can also use a QR Code:  

The GUIDs for individual cells are displayed in the table below:

Summary of computational transaction
Raw Input view raw input (R code)
Raw Outputview raw output of R engine
Computing time1 seconds
R ServerBig Analytics Cloud Computing Center


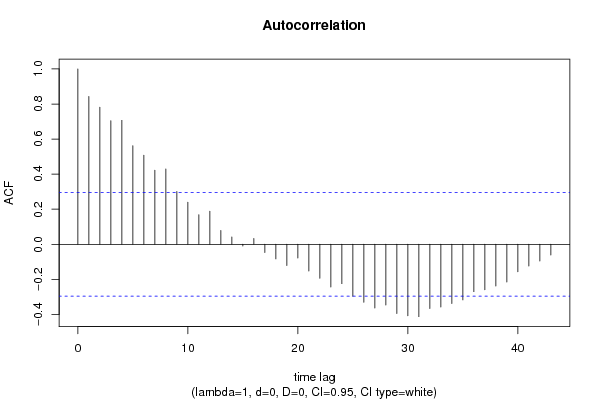
Autocorrelation Function
Time lag kACF(k)T-STATP-value
10.8432155.59331e-06
20.7816175.18473e-06
30.7044834.6731.4e-05
40.706854.68871.3e-05
50.5617363.72610.000276
60.5080273.36990.000787
70.4220442.79950.003786
80.4297962.85090.003306
90.3010281.99680.026028
100.2400081.5920.059268
110.1686451.11870.134676
120.1886911.25160.108658
130.0789260.52350.301614
140.041140.27290.393106
15-0.00993-0.06590.47389
160.0329790.21880.413925
17-0.0469-0.31110.378598
18-0.083689-0.55510.290809
19-0.121038-0.80290.213182
20-0.078468-0.52050.302663
21-0.15222-1.00970.159077
22-0.194189-1.28810.102221
23-0.243664-1.61630.056591
24-0.224876-1.49170.071462
25-0.296278-1.96530.027857
26-0.330511-2.19240.016844
27-0.363805-2.41320.010022
28-0.346556-2.29880.013162
29-0.395179-2.62130.005991
30-0.407631-2.70390.004853
31-0.412993-2.73950.004427
32-0.366828-2.43330.009547
33-0.357843-2.37370.011022
34-0.337787-2.24060.015074
35-0.317205-2.10410.020559
36-0.270451-1.7940.039846
37-0.259637-1.72220.046025
38-0.238458-1.58180.060434
39-0.215105-1.42680.080341
40-0.157131-1.04230.151485
41-0.123715-0.82060.208139
42-0.095924-0.63630.263942
43-0.061175-0.40580.343431
44NANANA
45NANANA
46NANANA
47NANANA
48NANANA

\begin{tabular}{lllllllll}
\hline
Autocorrelation Function \tabularnewline
Time lag k & ACF(k) & T-STAT & P-value \tabularnewline
1 & 0.843215 & 5.5933 & 1e-06 \tabularnewline
2 & 0.781617 & 5.1847 & 3e-06 \tabularnewline
3 & 0.704483 & 4.673 & 1.4e-05 \tabularnewline
4 & 0.70685 & 4.6887 & 1.3e-05 \tabularnewline
5 & 0.561736 & 3.7261 & 0.000276 \tabularnewline
6 & 0.508027 & 3.3699 & 0.000787 \tabularnewline
7 & 0.422044 & 2.7995 & 0.003786 \tabularnewline
8 & 0.429796 & 2.8509 & 0.003306 \tabularnewline
9 & 0.301028 & 1.9968 & 0.026028 \tabularnewline
10 & 0.240008 & 1.592 & 0.059268 \tabularnewline
11 & 0.168645 & 1.1187 & 0.134676 \tabularnewline
12 & 0.188691 & 1.2516 & 0.108658 \tabularnewline
13 & 0.078926 & 0.5235 & 0.301614 \tabularnewline
14 & 0.04114 & 0.2729 & 0.393106 \tabularnewline
15 & -0.00993 & -0.0659 & 0.47389 \tabularnewline
16 & 0.032979 & 0.2188 & 0.413925 \tabularnewline
17 & -0.0469 & -0.3111 & 0.378598 \tabularnewline
18 & -0.083689 & -0.5551 & 0.290809 \tabularnewline
19 & -0.121038 & -0.8029 & 0.213182 \tabularnewline
20 & -0.078468 & -0.5205 & 0.302663 \tabularnewline
21 & -0.15222 & -1.0097 & 0.159077 \tabularnewline
22 & -0.194189 & -1.2881 & 0.102221 \tabularnewline
23 & -0.243664 & -1.6163 & 0.056591 \tabularnewline
24 & -0.224876 & -1.4917 & 0.071462 \tabularnewline
25 & -0.296278 & -1.9653 & 0.027857 \tabularnewline
26 & -0.330511 & -2.1924 & 0.016844 \tabularnewline
27 & -0.363805 & -2.4132 & 0.010022 \tabularnewline
28 & -0.346556 & -2.2988 & 0.013162 \tabularnewline
29 & -0.395179 & -2.6213 & 0.005991 \tabularnewline
30 & -0.407631 & -2.7039 & 0.004853 \tabularnewline
31 & -0.412993 & -2.7395 & 0.004427 \tabularnewline
32 & -0.366828 & -2.4333 & 0.009547 \tabularnewline
33 & -0.357843 & -2.3737 & 0.011022 \tabularnewline
34 & -0.337787 & -2.2406 & 0.015074 \tabularnewline
35 & -0.317205 & -2.1041 & 0.020559 \tabularnewline
36 & -0.270451 & -1.794 & 0.039846 \tabularnewline
37 & -0.259637 & -1.7222 & 0.046025 \tabularnewline
38 & -0.238458 & -1.5818 & 0.060434 \tabularnewline
39 & -0.215105 & -1.4268 & 0.080341 \tabularnewline
40 & -0.157131 & -1.0423 & 0.151485 \tabularnewline
41 & -0.123715 & -0.8206 & 0.208139 \tabularnewline
42 & -0.095924 & -0.6363 & 0.263942 \tabularnewline
43 & -0.061175 & -0.4058 & 0.343431 \tabularnewline
44 & NA & NA & NA \tabularnewline
45 & NA & NA & NA \tabularnewline
46 & NA & NA & NA \tabularnewline
47 & NA & NA & NA \tabularnewline
48 & NA & NA & NA \tabularnewline
\hline
\end{tabular}
%Source: https://freestatistics.org/blog/index.php?pk=300274&T=1

[TABLE]
[ROW][C]Autocorrelation Function[/C][/ROW]
[ROW][C]Time lag k[/C][C]ACF(k)[/C][C]T-STAT[/C][C]P-value[/C][/ROW]
[ROW][C]1[/C][C]0.843215[/C][C]5.5933[/C][C]1e-06[/C][/ROW]
[ROW][C]2[/C][C]0.781617[/C][C]5.1847[/C][C]3e-06[/C][/ROW]
[ROW][C]3[/C][C]0.704483[/C][C]4.673[/C][C]1.4e-05[/C][/ROW]
[ROW][C]4[/C][C]0.70685[/C][C]4.6887[/C][C]1.3e-05[/C][/ROW]
[ROW][C]5[/C][C]0.561736[/C][C]3.7261[/C][C]0.000276[/C][/ROW]
[ROW][C]6[/C][C]0.508027[/C][C]3.3699[/C][C]0.000787[/C][/ROW]
[ROW][C]7[/C][C]0.422044[/C][C]2.7995[/C][C]0.003786[/C][/ROW]
[ROW][C]8[/C][C]0.429796[/C][C]2.8509[/C][C]0.003306[/C][/ROW]
[ROW][C]9[/C][C]0.301028[/C][C]1.9968[/C][C]0.026028[/C][/ROW]
[ROW][C]10[/C][C]0.240008[/C][C]1.592[/C][C]0.059268[/C][/ROW]
[ROW][C]11[/C][C]0.168645[/C][C]1.1187[/C][C]0.134676[/C][/ROW]
[ROW][C]12[/C][C]0.188691[/C][C]1.2516[/C][C]0.108658[/C][/ROW]
[ROW][C]13[/C][C]0.078926[/C][C]0.5235[/C][C]0.301614[/C][/ROW]
[ROW][C]14[/C][C]0.04114[/C][C]0.2729[/C][C]0.393106[/C][/ROW]
[ROW][C]15[/C][C]-0.00993[/C][C]-0.0659[/C][C]0.47389[/C][/ROW]
[ROW][C]16[/C][C]0.032979[/C][C]0.2188[/C][C]0.413925[/C][/ROW]
[ROW][C]17[/C][C]-0.0469[/C][C]-0.3111[/C][C]0.378598[/C][/ROW]
[ROW][C]18[/C][C]-0.083689[/C][C]-0.5551[/C][C]0.290809[/C][/ROW]
[ROW][C]19[/C][C]-0.121038[/C][C]-0.8029[/C][C]0.213182[/C][/ROW]
[ROW][C]20[/C][C]-0.078468[/C][C]-0.5205[/C][C]0.302663[/C][/ROW]
[ROW][C]21[/C][C]-0.15222[/C][C]-1.0097[/C][C]0.159077[/C][/ROW]
[ROW][C]22[/C][C]-0.194189[/C][C]-1.2881[/C][C]0.102221[/C][/ROW]
[ROW][C]23[/C][C]-0.243664[/C][C]-1.6163[/C][C]0.056591[/C][/ROW]
[ROW][C]24[/C][C]-0.224876[/C][C]-1.4917[/C][C]0.071462[/C][/ROW]
[ROW][C]25[/C][C]-0.296278[/C][C]-1.9653[/C][C]0.027857[/C][/ROW]
[ROW][C]26[/C][C]-0.330511[/C][C]-2.1924[/C][C]0.016844[/C][/ROW]
[ROW][C]27[/C][C]-0.363805[/C][C]-2.4132[/C][C]0.010022[/C][/ROW]
[ROW][C]28[/C][C]-0.346556[/C][C]-2.2988[/C][C]0.013162[/C][/ROW]
[ROW][C]29[/C][C]-0.395179[/C][C]-2.6213[/C][C]0.005991[/C][/ROW]
[ROW][C]30[/C][C]-0.407631[/C][C]-2.7039[/C][C]0.004853[/C][/ROW]
[ROW][C]31[/C][C]-0.412993[/C][C]-2.7395[/C][C]0.004427[/C][/ROW]
[ROW][C]32[/C][C]-0.366828[/C][C]-2.4333[/C][C]0.009547[/C][/ROW]
[ROW][C]33[/C][C]-0.357843[/C][C]-2.3737[/C][C]0.011022[/C][/ROW]
[ROW][C]34[/C][C]-0.337787[/C][C]-2.2406[/C][C]0.015074[/C][/ROW]
[ROW][C]35[/C][C]-0.317205[/C][C]-2.1041[/C][C]0.020559[/C][/ROW]
[ROW][C]36[/C][C]-0.270451[/C][C]-1.794[/C][C]0.039846[/C][/ROW]
[ROW][C]37[/C][C]-0.259637[/C][C]-1.7222[/C][C]0.046025[/C][/ROW]
[ROW][C]38[/C][C]-0.238458[/C][C]-1.5818[/C][C]0.060434[/C][/ROW]
[ROW][C]39[/C][C]-0.215105[/C][C]-1.4268[/C][C]0.080341[/C][/ROW]
[ROW][C]40[/C][C]-0.157131[/C][C]-1.0423[/C][C]0.151485[/C][/ROW]
[ROW][C]41[/C][C]-0.123715[/C][C]-0.8206[/C][C]0.208139[/C][/ROW]
[ROW][C]42[/C][C]-0.095924[/C][C]-0.6363[/C][C]0.263942[/C][/ROW]
[ROW][C]43[/C][C]-0.061175[/C][C]-0.4058[/C][C]0.343431[/C][/ROW]
[ROW][C]44[/C][C]NA[/C][C]NA[/C][C]NA[/C][/ROW]
[ROW][C]45[/C][C]NA[/C][C]NA[/C][C]NA[/C][/ROW]
[ROW][C]46[/C][C]NA[/C][C]NA[/C][C]NA[/C][/ROW]
[ROW][C]47[/C][C]NA[/C][C]NA[/C][C]NA[/C][/ROW]
[ROW][C]48[/C][C]NA[/C][C]NA[/C][C]NA[/C][/ROW]
[/TABLE]
Source: https://freestatistics.org/blog/index.php?pk=300274&T=1

Globally Unique Identifier (entire table): ba.freestatistics.org/blog/index.php?pk=300274&T=1

As an alternative you can also use a QR Code:  

The GUIDs for individual cells are displayed in the table below:

Autocorrelation Function
Time lag kACF(k)T-STATP-value
10.8432155.59331e-06
20.7816175.18473e-06
30.7044834.6731.4e-05
40.706854.68871.3e-05
50.5617363.72610.000276
60.5080273.36990.000787
70.4220442.79950.003786
80.4297962.85090.003306
90.3010281.99680.026028
100.2400081.5920.059268
110.1686451.11870.134676
120.1886911.25160.108658
130.0789260.52350.301614
140.041140.27290.393106
15-0.00993-0.06590.47389
160.0329790.21880.413925
17-0.0469-0.31110.378598
18-0.083689-0.55510.290809
19-0.121038-0.80290.213182
20-0.078468-0.52050.302663
21-0.15222-1.00970.159077
22-0.194189-1.28810.102221
23-0.243664-1.61630.056591
24-0.224876-1.49170.071462
25-0.296278-1.96530.027857
26-0.330511-2.19240.016844
27-0.363805-2.41320.010022
28-0.346556-2.29880.013162
29-0.395179-2.62130.005991
30-0.407631-2.70390.004853
31-0.412993-2.73950.004427
32-0.366828-2.43330.009547
33-0.357843-2.37370.011022
34-0.337787-2.24060.015074
35-0.317205-2.10410.020559
36-0.270451-1.7940.039846
37-0.259637-1.72220.046025
38-0.238458-1.58180.060434
39-0.215105-1.42680.080341
40-0.157131-1.04230.151485
41-0.123715-0.82060.208139
42-0.095924-0.63630.263942
43-0.061175-0.40580.343431
44NANANA
45NANANA
46NANANA
47NANANA
48NANANA


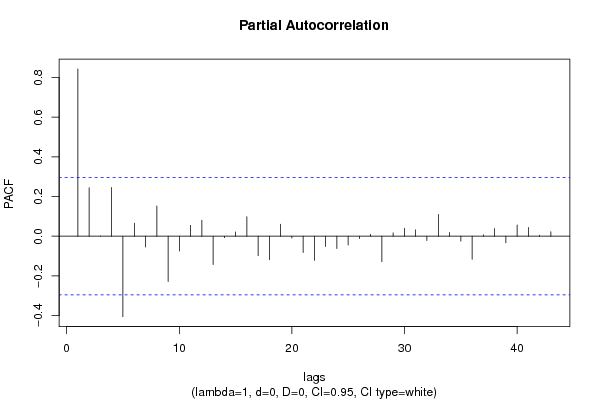
Partial Autocorrelation Function
Time lag kPACF(k)T-STATP-value
10.8432155.59331e-06
20.2443191.62060.056122
30.0015540.01030.495911
40.245531.62870.055262
5-0.405319-2.68860.005048
60.0659240.43730.332021
7-0.054228-0.35970.360394
80.1525951.01220.158489
9-0.228464-1.51550.068404
10-0.074845-0.49650.31102
110.0549120.36420.358711
120.0809180.53670.297073
13-0.142715-0.94670.17449
14-0.006972-0.04620.481662
150.0211740.14050.444473
160.098680.65460.258076
17-0.097912-0.64950.259704
18-0.118717-0.78750.217611
190.060850.40360.344218
20-0.009169-0.06080.47589
21-0.08217-0.54510.294234
22-0.121753-0.80760.211828
23-0.052043-0.34520.365789
24-0.061997-0.41120.341446
25-0.043794-0.29050.386401
26-0.011914-0.0790.468685
270.0093860.06230.47532
28-0.12868-0.85360.198984
290.0170440.11310.45525
300.0406230.26950.394416
310.0320080.21230.41642
32-0.021592-0.14320.443383
330.10960.7270.235537
340.0186180.12350.451137
35-0.024758-0.16420.435152
36-0.116457-0.77250.221978
370.0068350.04530.48202
380.0389770.25850.398597
39-0.03333-0.22110.413025
400.056590.37540.354593
410.0441710.2930.38545
420.0054380.03610.485694
430.0229430.15220.439867
44NANANA
45NANANA
46NANANA
47NANANA
48NANANA

\begin{tabular}{lllllllll}
\hline
Partial Autocorrelation Function \tabularnewline
Time lag k & PACF(k) & T-STAT & P-value \tabularnewline
1 & 0.843215 & 5.5933 & 1e-06 \tabularnewline
2 & 0.244319 & 1.6206 & 0.056122 \tabularnewline
3 & 0.001554 & 0.0103 & 0.495911 \tabularnewline
4 & 0.24553 & 1.6287 & 0.055262 \tabularnewline
5 & -0.405319 & -2.6886 & 0.005048 \tabularnewline
6 & 0.065924 & 0.4373 & 0.332021 \tabularnewline
7 & -0.054228 & -0.3597 & 0.360394 \tabularnewline
8 & 0.152595 & 1.0122 & 0.158489 \tabularnewline
9 & -0.228464 & -1.5155 & 0.068404 \tabularnewline
10 & -0.074845 & -0.4965 & 0.31102 \tabularnewline
11 & 0.054912 & 0.3642 & 0.358711 \tabularnewline
12 & 0.080918 & 0.5367 & 0.297073 \tabularnewline
13 & -0.142715 & -0.9467 & 0.17449 \tabularnewline
14 & -0.006972 & -0.0462 & 0.481662 \tabularnewline
15 & 0.021174 & 0.1405 & 0.444473 \tabularnewline
16 & 0.09868 & 0.6546 & 0.258076 \tabularnewline
17 & -0.097912 & -0.6495 & 0.259704 \tabularnewline
18 & -0.118717 & -0.7875 & 0.217611 \tabularnewline
19 & 0.06085 & 0.4036 & 0.344218 \tabularnewline
20 & -0.009169 & -0.0608 & 0.47589 \tabularnewline
21 & -0.08217 & -0.5451 & 0.294234 \tabularnewline
22 & -0.121753 & -0.8076 & 0.211828 \tabularnewline
23 & -0.052043 & -0.3452 & 0.365789 \tabularnewline
24 & -0.061997 & -0.4112 & 0.341446 \tabularnewline
25 & -0.043794 & -0.2905 & 0.386401 \tabularnewline
26 & -0.011914 & -0.079 & 0.468685 \tabularnewline
27 & 0.009386 & 0.0623 & 0.47532 \tabularnewline
28 & -0.12868 & -0.8536 & 0.198984 \tabularnewline
29 & 0.017044 & 0.1131 & 0.45525 \tabularnewline
30 & 0.040623 & 0.2695 & 0.394416 \tabularnewline
31 & 0.032008 & 0.2123 & 0.41642 \tabularnewline
32 & -0.021592 & -0.1432 & 0.443383 \tabularnewline
33 & 0.1096 & 0.727 & 0.235537 \tabularnewline
34 & 0.018618 & 0.1235 & 0.451137 \tabularnewline
35 & -0.024758 & -0.1642 & 0.435152 \tabularnewline
36 & -0.116457 & -0.7725 & 0.221978 \tabularnewline
37 & 0.006835 & 0.0453 & 0.48202 \tabularnewline
38 & 0.038977 & 0.2585 & 0.398597 \tabularnewline
39 & -0.03333 & -0.2211 & 0.413025 \tabularnewline
40 & 0.05659 & 0.3754 & 0.354593 \tabularnewline
41 & 0.044171 & 0.293 & 0.38545 \tabularnewline
42 & 0.005438 & 0.0361 & 0.485694 \tabularnewline
43 & 0.022943 & 0.1522 & 0.439867 \tabularnewline
44 & NA & NA & NA \tabularnewline
45 & NA & NA & NA \tabularnewline
46 & NA & NA & NA \tabularnewline
47 & NA & NA & NA \tabularnewline
48 & NA & NA & NA \tabularnewline
\hline
\end{tabular}
%Source: https://freestatistics.org/blog/index.php?pk=300274&T=2

[TABLE]
[ROW][C]Partial Autocorrelation Function[/C][/ROW]
[ROW][C]Time lag k[/C][C]PACF(k)[/C][C]T-STAT[/C][C]P-value[/C][/ROW]
[ROW][C]1[/C][C]0.843215[/C][C]5.5933[/C][C]1e-06[/C][/ROW]
[ROW][C]2[/C][C]0.244319[/C][C]1.6206[/C][C]0.056122[/C][/ROW]
[ROW][C]3[/C][C]0.001554[/C][C]0.0103[/C][C]0.495911[/C][/ROW]
[ROW][C]4[/C][C]0.24553[/C][C]1.6287[/C][C]0.055262[/C][/ROW]
[ROW][C]5[/C][C]-0.405319[/C][C]-2.6886[/C][C]0.005048[/C][/ROW]
[ROW][C]6[/C][C]0.065924[/C][C]0.4373[/C][C]0.332021[/C][/ROW]
[ROW][C]7[/C][C]-0.054228[/C][C]-0.3597[/C][C]0.360394[/C][/ROW]
[ROW][C]8[/C][C]0.152595[/C][C]1.0122[/C][C]0.158489[/C][/ROW]
[ROW][C]9[/C][C]-0.228464[/C][C]-1.5155[/C][C]0.068404[/C][/ROW]
[ROW][C]10[/C][C]-0.074845[/C][C]-0.4965[/C][C]0.31102[/C][/ROW]
[ROW][C]11[/C][C]0.054912[/C][C]0.3642[/C][C]0.358711[/C][/ROW]
[ROW][C]12[/C][C]0.080918[/C][C]0.5367[/C][C]0.297073[/C][/ROW]
[ROW][C]13[/C][C]-0.142715[/C][C]-0.9467[/C][C]0.17449[/C][/ROW]
[ROW][C]14[/C][C]-0.006972[/C][C]-0.0462[/C][C]0.481662[/C][/ROW]
[ROW][C]15[/C][C]0.021174[/C][C]0.1405[/C][C]0.444473[/C][/ROW]
[ROW][C]16[/C][C]0.09868[/C][C]0.6546[/C][C]0.258076[/C][/ROW]
[ROW][C]17[/C][C]-0.097912[/C][C]-0.6495[/C][C]0.259704[/C][/ROW]
[ROW][C]18[/C][C]-0.118717[/C][C]-0.7875[/C][C]0.217611[/C][/ROW]
[ROW][C]19[/C][C]0.06085[/C][C]0.4036[/C][C]0.344218[/C][/ROW]
[ROW][C]20[/C][C]-0.009169[/C][C]-0.0608[/C][C]0.47589[/C][/ROW]
[ROW][C]21[/C][C]-0.08217[/C][C]-0.5451[/C][C]0.294234[/C][/ROW]
[ROW][C]22[/C][C]-0.121753[/C][C]-0.8076[/C][C]0.211828[/C][/ROW]
[ROW][C]23[/C][C]-0.052043[/C][C]-0.3452[/C][C]0.365789[/C][/ROW]
[ROW][C]24[/C][C]-0.061997[/C][C]-0.4112[/C][C]0.341446[/C][/ROW]
[ROW][C]25[/C][C]-0.043794[/C][C]-0.2905[/C][C]0.386401[/C][/ROW]
[ROW][C]26[/C][C]-0.011914[/C][C]-0.079[/C][C]0.468685[/C][/ROW]
[ROW][C]27[/C][C]0.009386[/C][C]0.0623[/C][C]0.47532[/C][/ROW]
[ROW][C]28[/C][C]-0.12868[/C][C]-0.8536[/C][C]0.198984[/C][/ROW]
[ROW][C]29[/C][C]0.017044[/C][C]0.1131[/C][C]0.45525[/C][/ROW]
[ROW][C]30[/C][C]0.040623[/C][C]0.2695[/C][C]0.394416[/C][/ROW]
[ROW][C]31[/C][C]0.032008[/C][C]0.2123[/C][C]0.41642[/C][/ROW]
[ROW][C]32[/C][C]-0.021592[/C][C]-0.1432[/C][C]0.443383[/C][/ROW]
[ROW][C]33[/C][C]0.1096[/C][C]0.727[/C][C]0.235537[/C][/ROW]
[ROW][C]34[/C][C]0.018618[/C][C]0.1235[/C][C]0.451137[/C][/ROW]
[ROW][C]35[/C][C]-0.024758[/C][C]-0.1642[/C][C]0.435152[/C][/ROW]
[ROW][C]36[/C][C]-0.116457[/C][C]-0.7725[/C][C]0.221978[/C][/ROW]
[ROW][C]37[/C][C]0.006835[/C][C]0.0453[/C][C]0.48202[/C][/ROW]
[ROW][C]38[/C][C]0.038977[/C][C]0.2585[/C][C]0.398597[/C][/ROW]
[ROW][C]39[/C][C]-0.03333[/C][C]-0.2211[/C][C]0.413025[/C][/ROW]
[ROW][C]40[/C][C]0.05659[/C][C]0.3754[/C][C]0.354593[/C][/ROW]
[ROW][C]41[/C][C]0.044171[/C][C]0.293[/C][C]0.38545[/C][/ROW]
[ROW][C]42[/C][C]0.005438[/C][C]0.0361[/C][C]0.485694[/C][/ROW]
[ROW][C]43[/C][C]0.022943[/C][C]0.1522[/C][C]0.439867[/C][/ROW]
[ROW][C]44[/C][C]NA[/C][C]NA[/C][C]NA[/C][/ROW]
[ROW][C]45[/C][C]NA[/C][C]NA[/C][C]NA[/C][/ROW]
[ROW][C]46[/C][C]NA[/C][C]NA[/C][C]NA[/C][/ROW]
[ROW][C]47[/C][C]NA[/C][C]NA[/C][C]NA[/C][/ROW]
[ROW][C]48[/C][C]NA[/C][C]NA[/C][C]NA[/C][/ROW]
[/TABLE]
Source: https://freestatistics.org/blog/index.php?pk=300274&T=2

Globally Unique Identifier (entire table): ba.freestatistics.org/blog/index.php?pk=300274&T=2

As an alternative you can also use a QR Code:  

The GUIDs for individual cells are displayed in the table below:

Partial Autocorrelation Function
Time lag kPACF(k)T-STATP-value
10.8432155.59331e-06
20.2443191.62060.056122
30.0015540.01030.495911
40.245531.62870.055262
5-0.405319-2.68860.005048
60.0659240.43730.332021
7-0.054228-0.35970.360394
80.1525951.01220.158489
9-0.228464-1.51550.068404
10-0.074845-0.49650.31102
110.0549120.36420.358711
120.0809180.53670.297073
13-0.142715-0.94670.17449
14-0.006972-0.04620.481662
150.0211740.14050.444473
160.098680.65460.258076
17-0.097912-0.64950.259704
18-0.118717-0.78750.217611
190.060850.40360.344218
20-0.009169-0.06080.47589
21-0.08217-0.54510.294234
22-0.121753-0.80760.211828
23-0.052043-0.34520.365789
24-0.061997-0.41120.341446
25-0.043794-0.29050.386401
26-0.011914-0.0790.468685
270.0093860.06230.47532
28-0.12868-0.85360.198984
290.0170440.11310.45525
300.0406230.26950.394416
310.0320080.21230.41642
32-0.021592-0.14320.443383
330.10960.7270.235537
340.0186180.12350.451137
35-0.024758-0.16420.435152
36-0.116457-0.77250.221978
370.0068350.04530.48202
380.0389770.25850.398597
39-0.03333-0.22110.413025
400.056590.37540.354593
410.0441710.2930.38545
420.0054380.03610.485694
430.0229430.15220.439867
44NANANA
45NANANA
46NANANA
47NANANA
48NANANA


Parameters (Session):
par1 = 48 ; par2 = 1 ; par3 = 1 ; par4 = 1 ; par5 = 4 ; par6 = White Noise ; par7 = 0.95 ;
Parameters (R input):
par1 = 48 ; par2 = 1 ; par3 = 0 ; par4 = 0 ; par5 = 4 ; par6 = White Noise ; par7 = 0.95 ; par8 = ;
R code (references can be found in the software module):
if (par1 == 'Default') {
par1 = 10*log10(length(x))
} else {
par1 <- as.numeric(par1)
}
par2 <- as.numeric(par2)
par3 <- as.numeric(par3)
par4 <- as.numeric(par4)
par5 <- as.numeric(par5)
if (par6 == 'White Noise') par6 <- 'white' else par6 <- 'ma'
par7 <- as.numeric(par7)
if (par8 != '') par8 <- as.numeric(par8)
x <- na.omit(x)
ox <- x
if (par8 == '') {
if (par2 == 0) {
x <- log(x)
} else {
x <- (x ^ par2 - 1) / par2
}
} else {
x <- log(x,base=par8)
}
if (par3 > 0) x <- diff(x,lag=1,difference=par3)
if (par4 > 0) x <- diff(x,lag=par5,difference=par4)
bitmap(file='picts.png')
op <- par(mfrow=c(2,1))
plot(ox,type='l',main='Original Time Series',xlab='time',ylab='value')
if (par8=='') {
mytitle <- paste('Working Time Series (lambda=',par2,', d=',par3,', D=',par4,')',sep='')
mysub <- paste('(lambda=',par2,', d=',par3,', D=',par4,', CI=', par7, ', CI type=',par6,')',sep='')
} else {
mytitle <- paste('Working Time Series (base=',par8,', d=',par3,', D=',par4,')',sep='')
mysub <- paste('(base=',par8,', d=',par3,', D=',par4,', CI=', par7, ', CI type=',par6,')',sep='')
}
plot(x,type='l', main=mytitle,xlab='time',ylab='value')
par(op)
dev.off()
bitmap(file='pic1.png')
racf <- acf(x, par1, main='Autocorrelation', xlab='time lag', ylab='ACF', ci.type=par6, ci=par7, sub=mysub)
dev.off()
bitmap(file='pic2.png')
rpacf <- pacf(x,par1,main='Partial Autocorrelation',xlab='lags',ylab='PACF',sub=mysub)
dev.off()
(myacf <- c(racf$acf))
(mypacf <- c(rpacf$acf))
lengthx <- length(x)
sqrtn <- sqrt(lengthx)
load(file='createtable')
a<-table.start()
a<-table.row.start(a)
a<-table.element(a,'Autocorrelation Function',4,TRUE)
a<-table.row.end(a)
a<-table.row.start(a)
a<-table.element(a,'Time lag k',header=TRUE)
a<-table.element(a,'ACF(k)',header=TRUE)
a<-table.element(a,'T-STAT',header=TRUE)
a<-table.element(a,'P-value',header=TRUE)
a<-table.row.end(a)
for (i in 2:(par1+1)) {
a<-table.row.start(a)
a<-table.element(a,i-1,header=TRUE)
a<-table.element(a,round(myacf[i],6))
mytstat <- myacf[i]*sqrtn
a<-table.element(a,round(mytstat,4))
a<-table.element(a,round(1-pt(abs(mytstat),lengthx),6))
a<-table.row.end(a)
}
a<-table.end(a)
table.save(a,file='mytable.tab')
a<-table.start()
a<-table.row.start(a)
a<-table.element(a,'Partial Autocorrelation Function',4,TRUE)
a<-table.row.end(a)
a<-table.row.start(a)
a<-table.element(a,'Time lag k',header=TRUE)
a<-table.element(a,'PACF(k)',header=TRUE)
a<-table.element(a,'T-STAT',header=TRUE)
a<-table.element(a,'P-value',header=TRUE)
a<-table.row.end(a)
for (i in 1:par1) {
a<-table.row.start(a)
a<-table.element(a,i,header=TRUE)
a<-table.element(a,round(mypacf[i],6))
mytstat <- mypacf[i]*sqrtn
a<-table.element(a,round(mytstat,4))
a<-table.element(a,round(1-pt(abs(mytstat),lengthx),6))
a<-table.row.end(a)
}
a<-table.end(a)
table.save(a,file='mytable1.tab')