Free Statistics

of Irreproducible Research!

Author's title

Author*The author of this computation has been verified*
R Software Modulerwasp_arimabackwardselection.wasp
Title produced by softwareARIMA Backward Selection
Date of computationFri, 16 Dec 2016 15:00:12 +0100
Cite this page as followsStatistical Computations at FreeStatistics.org, Office for Research Development and Education, URL https://freestatistics.org/blog/index.php?v=date/2016/Dec/16/t1481897079nmh0q1b4pzv5jxl.htm/, Retrieved Thu, 02 May 2024 17:24:29 +0000
Statistical Computations at FreeStatistics.org, Office for Research Development and Education, URL https://freestatistics.org/blog/index.php?pk=300280, Retrieved Thu, 02 May 2024 17:24:29 +0000
QR Codes:

Original text written by user:
IsPrivate?No (this computation is public)
User-defined keywords
Estimated Impact54
Family? (F = Feedback message, R = changed R code, M = changed R Module, P = changed Parameters, D = changed Data)
-       [ARIMA Backward Selection] [forecasting1] [2016-12-16 14:00:12] [46a1fe1e497d9fc1a6cd5ffde28dca5e] [Current]
Feedback Forum

Post a new message
Dataseries X:
5750
5400
6150
6350
6450
6400
5900
6450
6600
7100
6850
6050
6750
6450
7000
6650
6650
6550
6900
6450
6150
6750
6300
5650
6250
5950
6450
6150
5800
5700
5950
6700
6150
7350
6850
5600
6400
5850
6350
6350
6000
6150
6400
6300
6600
6850
6700
6200
6750
6350
6900
6000
6050
6000
6600
6350
6300
6200
5600
5550
6450
6550
7050
6450
6850
6150
6800
7450
7150
7450
6600
6300
7400
6600
7250
7400
7150
6850
7350
7550
7550
8300
7600
6100
7800
7050
7450
7000
6900
7100
7600
7350
6850
8400
7550
7350
7250
6650
7400
6900
7000
7250
7950
7600
7750
8150
7150
7000
6400
5800
6700
6350
6200
6150
7000


Summary of computational transaction
Raw Input view raw input (R code)
Raw Outputview raw output of R engine
Computing time4 seconds
R ServerBig Analytics Cloud Computing Center

\begin{tabular}{lllllllll}
\hline
Summary of computational transaction \tabularnewline
Raw Input view raw input (R code)  \tabularnewline
Raw Outputview raw output of R engine  \tabularnewline
Computing time4 seconds \tabularnewline
R ServerBig Analytics Cloud Computing Center \tabularnewline
\hline
\end{tabular}
%Source: https://freestatistics.org/blog/index.php?pk=300280&T=0

[TABLE]
[ROW]
Summary of computational transaction[/C][/ROW] [ROW]Raw Input[/C] view raw input (R code) [/C][/ROW] [ROW]Raw Output[/C]view raw output of R engine [/C][/ROW] [ROW]Computing time[/C]4 seconds[/C][/ROW] [ROW]R Server[/C]Big Analytics Cloud Computing Center[/C][/ROW] [/TABLE] Source: https://freestatistics.org/blog/index.php?pk=300280&T=0

Globally Unique Identifier (entire table): ba.freestatistics.org/blog/index.php?pk=300280&T=0

As an alternative you can also use a QR Code:  

The GUIDs for individual cells are displayed in the table below:

Summary of computational transaction
Raw Input view raw input (R code)
Raw Outputview raw output of R engine
Computing time4 seconds
R ServerBig Analytics Cloud Computing Center


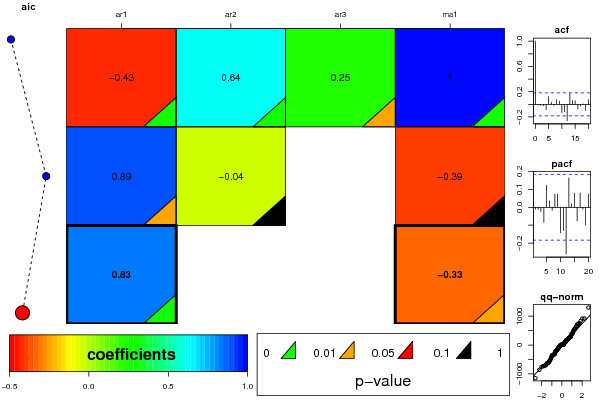
ARIMA Parameter Estimation and Backward Selection
Iterationar1ar2ar3ma1
Estimates ( 1 )-0.42520.63860.24851
(p-val)(0 )(0 )(0.0131 )(0 )
Estimates ( 2 )0.8915-0.04470-0.3941
(p-val)(0.03 )(0.8755 )(NA )(0.3153 )
Estimates ( 3 )0.828400-0.3349
(p-val)(0 )(NA )(NA )(0.0258 )
Estimates ( 4 )NANANANA
(p-val)(NA )(NA )(NA )(NA )
Estimates ( 5 )NANANANA
(p-val)(NA )(NA )(NA )(NA )
Estimates ( 6 )NANANANA
(p-val)(NA )(NA )(NA )(NA )
Estimates ( 7 )NANANANA
(p-val)(NA )(NA )(NA )(NA )

\begin{tabular}{lllllllll}
\hline
ARIMA Parameter Estimation and Backward Selection \tabularnewline
Iteration & ar1 & ar2 & ar3 & ma1 \tabularnewline
Estimates ( 1 ) & -0.4252 & 0.6386 & 0.2485 & 1 \tabularnewline
(p-val) & (0 ) & (0 ) & (0.0131 ) & (0 ) \tabularnewline
Estimates ( 2 ) & 0.8915 & -0.0447 & 0 & -0.3941 \tabularnewline
(p-val) & (0.03 ) & (0.8755 ) & (NA ) & (0.3153 ) \tabularnewline
Estimates ( 3 ) & 0.8284 & 0 & 0 & -0.3349 \tabularnewline
(p-val) & (0 ) & (NA ) & (NA ) & (0.0258 ) \tabularnewline
Estimates ( 4 ) & NA & NA & NA & NA \tabularnewline
(p-val) & (NA ) & (NA ) & (NA ) & (NA ) \tabularnewline
Estimates ( 5 ) & NA & NA & NA & NA \tabularnewline
(p-val) & (NA ) & (NA ) & (NA ) & (NA ) \tabularnewline
Estimates ( 6 ) & NA & NA & NA & NA \tabularnewline
(p-val) & (NA ) & (NA ) & (NA ) & (NA ) \tabularnewline
Estimates ( 7 ) & NA & NA & NA & NA \tabularnewline
(p-val) & (NA ) & (NA ) & (NA ) & (NA ) \tabularnewline
\hline
\end{tabular}
%Source: https://freestatistics.org/blog/index.php?pk=300280&T=1

[TABLE]
[ROW][C]ARIMA Parameter Estimation and Backward Selection[/C][/ROW]
[ROW][C]Iteration[/C][C]ar1[/C][C]ar2[/C][C]ar3[/C][C]ma1[/C][/ROW]
[ROW][C]Estimates ( 1 )[/C][C]-0.4252[/C][C]0.6386[/C][C]0.2485[/C][C]1[/C][/ROW]
[ROW][C](p-val)[/C][C](0 )[/C][C](0 )[/C][C](0.0131 )[/C][C](0 )[/C][/ROW]
[ROW][C]Estimates ( 2 )[/C][C]0.8915[/C][C]-0.0447[/C][C]0[/C][C]-0.3941[/C][/ROW]
[ROW][C](p-val)[/C][C](0.03 )[/C][C](0.8755 )[/C][C](NA )[/C][C](0.3153 )[/C][/ROW]
[ROW][C]Estimates ( 3 )[/C][C]0.8284[/C][C]0[/C][C]0[/C][C]-0.3349[/C][/ROW]
[ROW][C](p-val)[/C][C](0 )[/C][C](NA )[/C][C](NA )[/C][C](0.0258 )[/C][/ROW]
[ROW][C]Estimates ( 4 )[/C][C]NA[/C][C]NA[/C][C]NA[/C][C]NA[/C][/ROW]
[ROW][C](p-val)[/C][C](NA )[/C][C](NA )[/C][C](NA )[/C][C](NA )[/C][/ROW]
[ROW][C]Estimates ( 5 )[/C][C]NA[/C][C]NA[/C][C]NA[/C][C]NA[/C][/ROW]
[ROW][C](p-val)[/C][C](NA )[/C][C](NA )[/C][C](NA )[/C][C](NA )[/C][/ROW]
[ROW][C]Estimates ( 6 )[/C][C]NA[/C][C]NA[/C][C]NA[/C][C]NA[/C][/ROW]
[ROW][C](p-val)[/C][C](NA )[/C][C](NA )[/C][C](NA )[/C][C](NA )[/C][/ROW]
[ROW][C]Estimates ( 7 )[/C][C]NA[/C][C]NA[/C][C]NA[/C][C]NA[/C][/ROW]
[ROW][C](p-val)[/C][C](NA )[/C][C](NA )[/C][C](NA )[/C][C](NA )[/C][/ROW]
[/TABLE]
Source: https://freestatistics.org/blog/index.php?pk=300280&T=1

Globally Unique Identifier (entire table): ba.freestatistics.org/blog/index.php?pk=300280&T=1

As an alternative you can also use a QR Code:  

The GUIDs for individual cells are displayed in the table below:

ARIMA Parameter Estimation and Backward Selection
Iterationar1ar2ar3ma1
Estimates ( 1 )-0.42520.63860.24851
(p-val)(0 )(0 )(0.0131 )(0 )
Estimates ( 2 )0.8915-0.04470-0.3941
(p-val)(0.03 )(0.8755 )(NA )(0.3153 )
Estimates ( 3 )0.828400-0.3349
(p-val)(0 )(NA )(NA )(0.0258 )
Estimates ( 4 )NANANANA
(p-val)(NA )(NA )(NA )(NA )
Estimates ( 5 )NANANANA
(p-val)(NA )(NA )(NA )(NA )
Estimates ( 6 )NANANANA
(p-val)(NA )(NA )(NA )(NA )
Estimates ( 7 )NANANANA
(p-val)(NA )(NA )(NA )(NA )


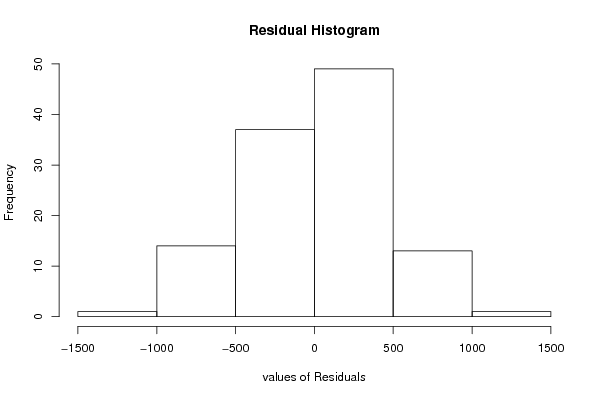
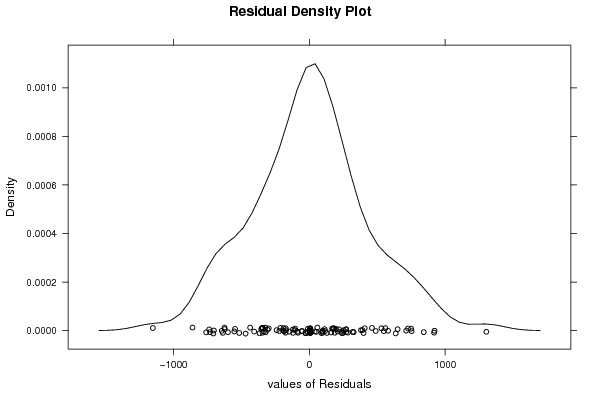
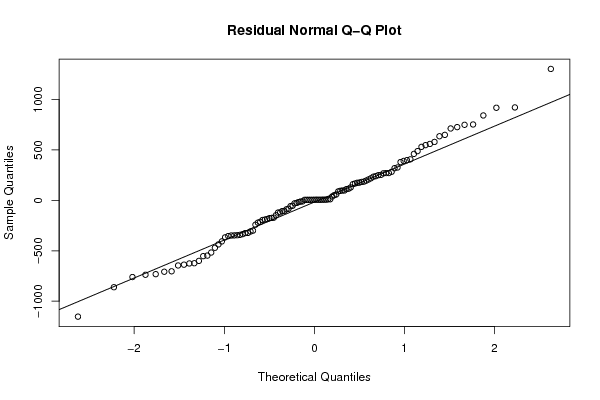
Estimated ARIMA Residuals
Value
6.04995590104043
749.484887414979
399.12054323185
111.843912924079
-366.775389915864
-173.932831081459
-83.4375936741935
842.324450367039
-552.884709109787
-623.213364308273
-194.403926225116
-334.673715753593
-57.1812177547281
-190.490197027589
-147.172681443819
-184.568583263353
-104.729380716156
-470.076223154836
-299.783796367057
-348.30801101524
921.721342098212
97.9124199785829
649.74691714541
271.133646180179
-406.693475860009
58.8749014287132
-212.758686378703
-87.9902602626207
250.011944273099
115.752251958894
326.242693156902
186.311346320807
-707.665925216124
547.836299873521
-703.161004327549
38.7621968454523
726.673061282293
94.7487330953963
252.102071043608
219.218567147782
-731.616523273968
98.2885374695206
-171.473256918309
268.388427462265
-29.2391048198842
-347.166233483909
-517.118711565148
-737.691638526666
10.9387502002719
234.669467306285
530.899634387375
167.507221456087
391.212490869398
559.68044800686
-322.564365169972
-25.1109974192086
918.501679572995
240.216076765663
635.998652676184
174.193302401492
-17.0459231787481
319.307749609645
-637.614627161707
-53.4100497168965
752.884711419611
-241.320532673194
379.875980097607
89.0347224160551
-323.98546879016
207.740589043057
579.724511987397
488.526052344164
-861.042679775162
283.6558836793
196.243006487975
-105.985030276484
-599.970844343104
-120.889380253998
407.377317939907
176.489694839884
-342.165840248565
-645.367953082509
460.811604128636
11.1771602954495
1303.44530216694
-1152.98370295242
-308.194542360554
160.596047466101
-10.0025526304016
182.976360946282
128.487056074741
271.370784607487
51.6065881167779
713.088505133126
-760.194435696143
-436.494237609686
-176.564928074895
-625.411367479186
-354.29656046921
-119.789190264672
-11.1057813670113
-345.306025065189
-547.425230081709
-220.783549020036

\begin{tabular}{lllllllll}
\hline
Estimated ARIMA Residuals \tabularnewline
Value \tabularnewline
6.04995590104043 \tabularnewline
749.484887414979 \tabularnewline
399.12054323185 \tabularnewline
111.843912924079 \tabularnewline
-366.775389915864 \tabularnewline
-173.932831081459 \tabularnewline
-83.4375936741935 \tabularnewline
842.324450367039 \tabularnewline
-552.884709109787 \tabularnewline
-623.213364308273 \tabularnewline
-194.403926225116 \tabularnewline
-334.673715753593 \tabularnewline
-57.1812177547281 \tabularnewline
-190.490197027589 \tabularnewline
-147.172681443819 \tabularnewline
-184.568583263353 \tabularnewline
-104.729380716156 \tabularnewline
-470.076223154836 \tabularnewline
-299.783796367057 \tabularnewline
-348.30801101524 \tabularnewline
921.721342098212 \tabularnewline
97.9124199785829 \tabularnewline
649.74691714541 \tabularnewline
271.133646180179 \tabularnewline
-406.693475860009 \tabularnewline
58.8749014287132 \tabularnewline
-212.758686378703 \tabularnewline
-87.9902602626207 \tabularnewline
250.011944273099 \tabularnewline
115.752251958894 \tabularnewline
326.242693156902 \tabularnewline
186.311346320807 \tabularnewline
-707.665925216124 \tabularnewline
547.836299873521 \tabularnewline
-703.161004327549 \tabularnewline
38.7621968454523 \tabularnewline
726.673061282293 \tabularnewline
94.7487330953963 \tabularnewline
252.102071043608 \tabularnewline
219.218567147782 \tabularnewline
-731.616523273968 \tabularnewline
98.2885374695206 \tabularnewline
-171.473256918309 \tabularnewline
268.388427462265 \tabularnewline
-29.2391048198842 \tabularnewline
-347.166233483909 \tabularnewline
-517.118711565148 \tabularnewline
-737.691638526666 \tabularnewline
10.9387502002719 \tabularnewline
234.669467306285 \tabularnewline
530.899634387375 \tabularnewline
167.507221456087 \tabularnewline
391.212490869398 \tabularnewline
559.68044800686 \tabularnewline
-322.564365169972 \tabularnewline
-25.1109974192086 \tabularnewline
918.501679572995 \tabularnewline
240.216076765663 \tabularnewline
635.998652676184 \tabularnewline
174.193302401492 \tabularnewline
-17.0459231787481 \tabularnewline
319.307749609645 \tabularnewline
-637.614627161707 \tabularnewline
-53.4100497168965 \tabularnewline
752.884711419611 \tabularnewline
-241.320532673194 \tabularnewline
379.875980097607 \tabularnewline
89.0347224160551 \tabularnewline
-323.98546879016 \tabularnewline
207.740589043057 \tabularnewline
579.724511987397 \tabularnewline
488.526052344164 \tabularnewline
-861.042679775162 \tabularnewline
283.6558836793 \tabularnewline
196.243006487975 \tabularnewline
-105.985030276484 \tabularnewline
-599.970844343104 \tabularnewline
-120.889380253998 \tabularnewline
407.377317939907 \tabularnewline
176.489694839884 \tabularnewline
-342.165840248565 \tabularnewline
-645.367953082509 \tabularnewline
460.811604128636 \tabularnewline
11.1771602954495 \tabularnewline
1303.44530216694 \tabularnewline
-1152.98370295242 \tabularnewline
-308.194542360554 \tabularnewline
160.596047466101 \tabularnewline
-10.0025526304016 \tabularnewline
182.976360946282 \tabularnewline
128.487056074741 \tabularnewline
271.370784607487 \tabularnewline
51.6065881167779 \tabularnewline
713.088505133126 \tabularnewline
-760.194435696143 \tabularnewline
-436.494237609686 \tabularnewline
-176.564928074895 \tabularnewline
-625.411367479186 \tabularnewline
-354.29656046921 \tabularnewline
-119.789190264672 \tabularnewline
-11.1057813670113 \tabularnewline
-345.306025065189 \tabularnewline
-547.425230081709 \tabularnewline
-220.783549020036 \tabularnewline
\hline
\end{tabular}
%Source: https://freestatistics.org/blog/index.php?pk=300280&T=2

[TABLE]
[ROW][C]Estimated ARIMA Residuals[/C][/ROW]
[ROW][C]Value[/C][/ROW]
[ROW][C]6.04995590104043[/C][/ROW]
[ROW][C]749.484887414979[/C][/ROW]
[ROW][C]399.12054323185[/C][/ROW]
[ROW][C]111.843912924079[/C][/ROW]
[ROW][C]-366.775389915864[/C][/ROW]
[ROW][C]-173.932831081459[/C][/ROW]
[ROW][C]-83.4375936741935[/C][/ROW]
[ROW][C]842.324450367039[/C][/ROW]
[ROW][C]-552.884709109787[/C][/ROW]
[ROW][C]-623.213364308273[/C][/ROW]
[ROW][C]-194.403926225116[/C][/ROW]
[ROW][C]-334.673715753593[/C][/ROW]
[ROW][C]-57.1812177547281[/C][/ROW]
[ROW][C]-190.490197027589[/C][/ROW]
[ROW][C]-147.172681443819[/C][/ROW]
[ROW][C]-184.568583263353[/C][/ROW]
[ROW][C]-104.729380716156[/C][/ROW]
[ROW][C]-470.076223154836[/C][/ROW]
[ROW][C]-299.783796367057[/C][/ROW]
[ROW][C]-348.30801101524[/C][/ROW]
[ROW][C]921.721342098212[/C][/ROW]
[ROW][C]97.9124199785829[/C][/ROW]
[ROW][C]649.74691714541[/C][/ROW]
[ROW][C]271.133646180179[/C][/ROW]
[ROW][C]-406.693475860009[/C][/ROW]
[ROW][C]58.8749014287132[/C][/ROW]
[ROW][C]-212.758686378703[/C][/ROW]
[ROW][C]-87.9902602626207[/C][/ROW]
[ROW][C]250.011944273099[/C][/ROW]
[ROW][C]115.752251958894[/C][/ROW]
[ROW][C]326.242693156902[/C][/ROW]
[ROW][C]186.311346320807[/C][/ROW]
[ROW][C]-707.665925216124[/C][/ROW]
[ROW][C]547.836299873521[/C][/ROW]
[ROW][C]-703.161004327549[/C][/ROW]
[ROW][C]38.7621968454523[/C][/ROW]
[ROW][C]726.673061282293[/C][/ROW]
[ROW][C]94.7487330953963[/C][/ROW]
[ROW][C]252.102071043608[/C][/ROW]
[ROW][C]219.218567147782[/C][/ROW]
[ROW][C]-731.616523273968[/C][/ROW]
[ROW][C]98.2885374695206[/C][/ROW]
[ROW][C]-171.473256918309[/C][/ROW]
[ROW][C]268.388427462265[/C][/ROW]
[ROW][C]-29.2391048198842[/C][/ROW]
[ROW][C]-347.166233483909[/C][/ROW]
[ROW][C]-517.118711565148[/C][/ROW]
[ROW][C]-737.691638526666[/C][/ROW]
[ROW][C]10.9387502002719[/C][/ROW]
[ROW][C]234.669467306285[/C][/ROW]
[ROW][C]530.899634387375[/C][/ROW]
[ROW][C]167.507221456087[/C][/ROW]
[ROW][C]391.212490869398[/C][/ROW]
[ROW][C]559.68044800686[/C][/ROW]
[ROW][C]-322.564365169972[/C][/ROW]
[ROW][C]-25.1109974192086[/C][/ROW]
[ROW][C]918.501679572995[/C][/ROW]
[ROW][C]240.216076765663[/C][/ROW]
[ROW][C]635.998652676184[/C][/ROW]
[ROW][C]174.193302401492[/C][/ROW]
[ROW][C]-17.0459231787481[/C][/ROW]
[ROW][C]319.307749609645[/C][/ROW]
[ROW][C]-637.614627161707[/C][/ROW]
[ROW][C]-53.4100497168965[/C][/ROW]
[ROW][C]752.884711419611[/C][/ROW]
[ROW][C]-241.320532673194[/C][/ROW]
[ROW][C]379.875980097607[/C][/ROW]
[ROW][C]89.0347224160551[/C][/ROW]
[ROW][C]-323.98546879016[/C][/ROW]
[ROW][C]207.740589043057[/C][/ROW]
[ROW][C]579.724511987397[/C][/ROW]
[ROW][C]488.526052344164[/C][/ROW]
[ROW][C]-861.042679775162[/C][/ROW]
[ROW][C]283.6558836793[/C][/ROW]
[ROW][C]196.243006487975[/C][/ROW]
[ROW][C]-105.985030276484[/C][/ROW]
[ROW][C]-599.970844343104[/C][/ROW]
[ROW][C]-120.889380253998[/C][/ROW]
[ROW][C]407.377317939907[/C][/ROW]
[ROW][C]176.489694839884[/C][/ROW]
[ROW][C]-342.165840248565[/C][/ROW]
[ROW][C]-645.367953082509[/C][/ROW]
[ROW][C]460.811604128636[/C][/ROW]
[ROW][C]11.1771602954495[/C][/ROW]
[ROW][C]1303.44530216694[/C][/ROW]
[ROW][C]-1152.98370295242[/C][/ROW]
[ROW][C]-308.194542360554[/C][/ROW]
[ROW][C]160.596047466101[/C][/ROW]
[ROW][C]-10.0025526304016[/C][/ROW]
[ROW][C]182.976360946282[/C][/ROW]
[ROW][C]128.487056074741[/C][/ROW]
[ROW][C]271.370784607487[/C][/ROW]
[ROW][C]51.6065881167779[/C][/ROW]
[ROW][C]713.088505133126[/C][/ROW]
[ROW][C]-760.194435696143[/C][/ROW]
[ROW][C]-436.494237609686[/C][/ROW]
[ROW][C]-176.564928074895[/C][/ROW]
[ROW][C]-625.411367479186[/C][/ROW]
[ROW][C]-354.29656046921[/C][/ROW]
[ROW][C]-119.789190264672[/C][/ROW]
[ROW][C]-11.1057813670113[/C][/ROW]
[ROW][C]-345.306025065189[/C][/ROW]
[ROW][C]-547.425230081709[/C][/ROW]
[ROW][C]-220.783549020036[/C][/ROW]
[/TABLE]
Source: https://freestatistics.org/blog/index.php?pk=300280&T=2

Globally Unique Identifier (entire table): ba.freestatistics.org/blog/index.php?pk=300280&T=2

As an alternative you can also use a QR Code:  

The GUIDs for individual cells are displayed in the table below:

Estimated ARIMA Residuals
Value
6.04995590104043
749.484887414979
399.12054323185
111.843912924079
-366.775389915864
-173.932831081459
-83.4375936741935
842.324450367039
-552.884709109787
-623.213364308273
-194.403926225116
-334.673715753593
-57.1812177547281
-190.490197027589
-147.172681443819
-184.568583263353
-104.729380716156
-470.076223154836
-299.783796367057
-348.30801101524
921.721342098212
97.9124199785829
649.74691714541
271.133646180179
-406.693475860009
58.8749014287132
-212.758686378703
-87.9902602626207
250.011944273099
115.752251958894
326.242693156902
186.311346320807
-707.665925216124
547.836299873521
-703.161004327549
38.7621968454523
726.673061282293
94.7487330953963
252.102071043608
219.218567147782
-731.616523273968
98.2885374695206
-171.473256918309
268.388427462265
-29.2391048198842
-347.166233483909
-517.118711565148
-737.691638526666
10.9387502002719
234.669467306285
530.899634387375
167.507221456087
391.212490869398
559.68044800686
-322.564365169972
-25.1109974192086
918.501679572995
240.216076765663
635.998652676184
174.193302401492
-17.0459231787481
319.307749609645
-637.614627161707
-53.4100497168965
752.884711419611
-241.320532673194
379.875980097607
89.0347224160551
-323.98546879016
207.740589043057
579.724511987397
488.526052344164
-861.042679775162
283.6558836793
196.243006487975
-105.985030276484
-599.970844343104
-120.889380253998
407.377317939907
176.489694839884
-342.165840248565
-645.367953082509
460.811604128636
11.1771602954495
1303.44530216694
-1152.98370295242
-308.194542360554
160.596047466101
-10.0025526304016
182.976360946282
128.487056074741
271.370784607487
51.6065881167779
713.088505133126
-760.194435696143
-436.494237609686
-176.564928074895
-625.411367479186
-354.29656046921
-119.789190264672
-11.1057813670113
-345.306025065189
-547.425230081709
-220.783549020036


Parameters (Session):
par1 = FALSE ; par2 = 1 ; par3 = 0 ; par4 = 1 ; par5 = 12 ; par6 = 3 ; par7 = 1 ; par8 = 0 ; par9 = 0 ;
Parameters (R input):
par1 = FALSE ; par2 = 1 ; par3 = 0 ; par4 = 1 ; par5 = 12 ; par6 = 3 ; par7 = 1 ; par8 = 0 ; par9 = 0 ;
R code (references can be found in the software module):
par9 <- '0'
par8 <- '0'
par7 <- '1'
par6 <- '3'
par5 <- '1'
par4 <- '1'
par3 <- '0'
par2 <- '1'
par1 <- 'FALSE'
library(lattice)
if (par1 == 'TRUE') par1 <- TRUE
if (par1 == 'FALSE') par1 <- FALSE
par2 <- as.numeric(par2) #Box-Cox lambda transformation parameter
par3 <- as.numeric(par3) #degree of non-seasonal differencing
par4 <- as.numeric(par4) #degree of seasonal differencing
par5 <- as.numeric(par5) #seasonal period
par6 <- as.numeric(par6) #degree (p) of the non-seasonal AR(p) polynomial
par7 <- as.numeric(par7) #degree (q) of the non-seasonal MA(q) polynomial
par8 <- as.numeric(par8) #degree (P) of the seasonal AR(P) polynomial
par9 <- as.numeric(par9) #degree (Q) of the seasonal MA(Q) polynomial
armaGR <- function(arima.out, names, n){
try1 <- arima.out$coef
try2 <- sqrt(diag(arima.out$var.coef))
try.data.frame <- data.frame(matrix(NA,ncol=4,nrow=length(names)))
dimnames(try.data.frame) <- list(names,c('coef','std','tstat','pv'))
try.data.frame[,1] <- try1
for(i in 1:length(try2)) try.data.frame[which(rownames(try.data.frame)==names(try2)[i]),2] <- try2[i]
try.data.frame[,3] <- try.data.frame[,1] / try.data.frame[,2]
try.data.frame[,4] <- round((1-pt(abs(try.data.frame[,3]),df=n-(length(try2)+1)))*2,5)
vector <- rep(NA,length(names))
vector[is.na(try.data.frame[,4])] <- 0
maxi <- which.max(try.data.frame[,4])
continue <- max(try.data.frame[,4],na.rm=TRUE) > .05
vector[maxi] <- 0
list(summary=try.data.frame,next.vector=vector,continue=continue)
}
arimaSelect <- function(series, order=c(13,0,0), seasonal=list(order=c(2,0,0),period=12), include.mean=F){
nrc <- order[1]+order[3]+seasonal$order[1]+seasonal$order[3]
coeff <- matrix(NA, nrow=nrc*2, ncol=nrc)
pval <- matrix(NA, nrow=nrc*2, ncol=nrc)
mylist <- rep(list(NULL), nrc)
names <- NULL
if(order[1] > 0) names <- paste('ar',1:order[1],sep='')
if(order[3] > 0) names <- c( names , paste('ma',1:order[3],sep='') )
if(seasonal$order[1] > 0) names <- c(names, paste('sar',1:seasonal$order[1],sep=''))
if(seasonal$order[3] > 0) names <- c(names, paste('sma',1:seasonal$order[3],sep=''))
arima.out <- arima(series, order=order, seasonal=seasonal, include.mean=include.mean, method='ML')
mylist[[1]] <- arima.out
last.arma <- armaGR(arima.out, names, length(series))
mystop <- FALSE
i <- 1
coeff[i,] <- last.arma[[1]][,1]
pval [i,] <- last.arma[[1]][,4]
i <- 2
aic <- arima.out$aic
while(!mystop){
mylist[[i]] <- arima.out
arima.out <- arima(series, order=order, seasonal=seasonal, include.mean=include.mean, method='ML', fixed=last.arma$next.vector)
aic <- c(aic, arima.out$aic)
last.arma <- armaGR(arima.out, names, length(series))
mystop <- !last.arma$continue
coeff[i,] <- last.arma[[1]][,1]
pval [i,] <- last.arma[[1]][,4]
i <- i+1
}
list(coeff, pval, mylist, aic=aic)
}
arimaSelectplot <- function(arimaSelect.out,noms,choix){
noms <- names(arimaSelect.out[[3]][[1]]$coef)
coeff <- arimaSelect.out[[1]]
k <- min(which(is.na(coeff[,1])))-1
coeff <- coeff[1:k,]
pval <- arimaSelect.out[[2]][1:k,]
aic <- arimaSelect.out$aic[1:k]
coeff[coeff==0] <- NA
n <- ncol(coeff)
if(missing(choix)) choix <- k
layout(matrix(c(1,1,1,2,
3,3,3,2,
3,3,3,4,
5,6,7,7),nr=4),
widths=c(10,35,45,15),
heights=c(30,30,15,15))
couleurs <- rainbow(75)[1:50]#(50)
ticks <- pretty(coeff)
par(mar=c(1,1,3,1))
plot(aic,k:1-.5,type='o',pch=21,bg='blue',cex=2,axes=F,lty=2,xpd=NA)
points(aic[choix],k-choix+.5,pch=21,cex=4,bg=2,xpd=NA)
title('aic',line=2)
par(mar=c(3,0,0,0))
plot(0,axes=F,xlab='',ylab='',xlim=range(ticks),ylim=c(.1,1))
rect(xleft = min(ticks) + (0:49)/50*(max(ticks)-min(ticks)),
xright = min(ticks) + (1:50)/50*(max(ticks)-min(ticks)),
ytop = rep(1,50),
ybottom= rep(0,50),col=couleurs,border=NA)
axis(1,ticks)
rect(xleft=min(ticks),xright=max(ticks),ytop=1,ybottom=0)
text(mean(coeff,na.rm=T),.5,'coefficients',cex=2,font=2)
par(mar=c(1,1,3,1))
image(1:n,1:k,t(coeff[k:1,]),axes=F,col=couleurs,zlim=range(ticks))
for(i in 1:n) for(j in 1:k) if(!is.na(coeff[j,i])) {
if(pval[j,i]<.01) symb = 'green'
else if( (pval[j,i]<.05) & (pval[j,i]>=.01)) symb = 'orange'
else if( (pval[j,i]<.1) & (pval[j,i]>=.05)) symb = 'red'
else symb = 'black'
polygon(c(i+.5 ,i+.2 ,i+.5 ,i+.5),
c(k-j+0.5,k-j+0.5,k-j+0.8,k-j+0.5),
col=symb)
if(j==choix) {
rect(xleft=i-.5,
xright=i+.5,
ybottom=k-j+1.5,
ytop=k-j+.5,
lwd=4)
text(i,
k-j+1,
round(coeff[j,i],2),
cex=1.2,
font=2)
}
else{
rect(xleft=i-.5,xright=i+.5,ybottom=k-j+1.5,ytop=k-j+.5)
text(i,k-j+1,round(coeff[j,i],2),cex=1.2,font=1)
}
}
axis(3,1:n,noms)
par(mar=c(0.5,0,0,0.5))
plot(0,axes=F,xlab='',ylab='',type='n',xlim=c(0,8),ylim=c(-.2,.8))
cols <- c('green','orange','red','black')
niv <- c('0','0.01','0.05','0.1')
for(i in 0:3){
polygon(c(1+2*i ,1+2*i ,1+2*i-.5 ,1+2*i),
c(.4 ,.7 , .4 , .4),
col=cols[i+1])
text(2*i,0.5,niv[i+1],cex=1.5)
}
text(8,.5,1,cex=1.5)
text(4,0,'p-value',cex=2)
box()
residus <- arimaSelect.out[[3]][[choix]]$res
par(mar=c(1,2,4,1))
acf(residus,main='')
title('acf',line=.5)
par(mar=c(1,2,4,1))
pacf(residus,main='')
title('pacf',line=.5)
par(mar=c(2,2,4,1))
qqnorm(residus,main='')
title('qq-norm',line=.5)
qqline(residus)
residus
}
if (par2 == 0) x <- log(x)
if (par2 != 0) x <- x^par2
(selection <- arimaSelect(x, order=c(par6,par3,par7), seasonal=list(order=c(par8,par4,par9), period=par5)))
bitmap(file='test1.png')
resid <- arimaSelectplot(selection)
dev.off()
resid
bitmap(file='test2.png')
acf(resid,length(resid)/2, main='Residual Autocorrelation Function')
dev.off()
bitmap(file='test3.png')
pacf(resid,length(resid)/2, main='Residual Partial Autocorrelation Function')
dev.off()
bitmap(file='test4.png')
cpgram(resid, main='Residual Cumulative Periodogram')
dev.off()
bitmap(file='test5.png')
hist(resid, main='Residual Histogram', xlab='values of Residuals')
dev.off()
bitmap(file='test6.png')
densityplot(~resid,col='black',main='Residual Density Plot', xlab='values of Residuals')
dev.off()
bitmap(file='test7.png')
qqnorm(resid, main='Residual Normal Q-Q Plot')
qqline(resid)
dev.off()
ncols <- length(selection[[1]][1,])
nrows <- length(selection[[2]][,1])-1
load(file='createtable')
a<-table.start()
a<-table.row.start(a)
a<-table.element(a,'ARIMA Parameter Estimation and Backward Selection', ncols+1,TRUE)
a<-table.row.end(a)
a<-table.row.start(a)
a<-table.element(a,'Iteration', header=TRUE)
for (i in 1:ncols) {
a<-table.element(a,names(selection[[3]][[1]]$coef)[i],header=TRUE)
}
a<-table.row.end(a)
for (j in 1:nrows) {
a<-table.row.start(a)
mydum <- 'Estimates ('
mydum <- paste(mydum,j)
mydum <- paste(mydum,')')
a<-table.element(a,mydum, header=TRUE)
for (i in 1:ncols) {
a<-table.element(a,round(selection[[1]][j,i],4))
}
a<-table.row.end(a)
a<-table.row.start(a)
a<-table.element(a,'(p-val)', header=TRUE)
for (i in 1:ncols) {
mydum <- '('
mydum <- paste(mydum,round(selection[[2]][j,i],4),sep='')
mydum <- paste(mydum,')')
a<-table.element(a,mydum)
}
a<-table.row.end(a)
}
a<-table.end(a)
table.save(a,file='mytable.tab')
a<-table.start()
a<-table.row.start(a)
a<-table.element(a,'Estimated ARIMA Residuals', 1,TRUE)
a<-table.row.end(a)
a<-table.row.start(a)
a<-table.element(a,'Value', 1,TRUE)
a<-table.row.end(a)
for (i in (par4*par5+par3):length(resid)) {
a<-table.row.start(a)
a<-table.element(a,resid[i])
a<-table.row.end(a)
}
a<-table.end(a)
table.save(a,file='mytable1.tab')