Free Statistics

of Irreproducible Research!

Author's title

Author*The author of this computation has been verified*
R Software Modulerwasp_arimabackwardselection.wasp
Title produced by softwareARIMA Backward Selection
Date of computationFri, 16 Dec 2016 14:59:53 +0100
Cite this page as followsStatistical Computations at FreeStatistics.org, Office for Research Development and Education, URL https://freestatistics.org/blog/index.php?v=date/2016/Dec/16/t1481897262akqs9zpbu9n435h.htm/, Retrieved Thu, 02 May 2024 17:48:24 +0000
Statistical Computations at FreeStatistics.org, Office for Research Development and Education, URL https://freestatistics.org/blog/index.php?pk=300284, Retrieved Thu, 02 May 2024 17:48:24 +0000
QR Codes:

Original text written by user:
IsPrivate?No (this computation is public)
User-defined keywords
Estimated Impact60
Family? (F = Feedback message, R = changed R code, M = changed R Module, P = changed Parameters, D = changed Data)
-       [ARIMA Backward Selection] [] [2016-12-16 13:59:53] [9b171b8beffcb53bb49a1e7c02b89c12] [Current]
Feedback Forum

Post a new message
Dataseries X:
2669.94
2778.72
2648.44
2631.32
3057.32
2730.66
2730.62
2738.7
2616.36
2773.54
2872.76
2999.42
2730.62
2907.22
2778.04
2833.94
2914.44
2788.86
2742.8
2726.52
2746.44
2927.42
2879.56
3262.02
2883.14
2903.2
2877.7
2874.3
3026.66
2979.42
3109.68
2966.76
2961.04
3103.84
3359.12
3976.24
3049.42
3089.14
3166.26
3459.04
3457.32
3292.66
3432.86
3388.4
3312.9
3390.04
3757.44
4612.38
3613.34
3525.14
3473.06
3662.22
3717.4
3466.9
3443.4
3383.16
3843.64
3692.4
3558.38
3811.02
3470.54
3354.68
3499.96
3537.36
3414.98
3649
3549.72
3680.78
3484.64
3451.92
3831.14
3906.02
3499.54
3620.62
3473.64
3494.32
3799.66
3476.4
3446.86
3441.94
3514.68
3464.96
3579.48
3944.24
3702.42
3716.28
3538.36
3482.58
3665.5
3484.5
3425.08
3421.44
3602.34
3593.44
3478.5
4365.26
3445.2
3473.48
3472.32
3403.82
3575.4
3512.96
3433.04
3495.2
3478.96
3559.28
3887.1
4083.16
3659.52
3693.48
3779.52
3891.62
3895.86
3745.04
3884.46
3862.98


Summary of computational transaction
Raw Input view raw input (R code)
Raw Outputview raw output of R engine
Computing time3 seconds
R ServerBig Analytics Cloud Computing Center

\begin{tabular}{lllllllll}
\hline
Summary of computational transaction \tabularnewline
Raw Input view raw input (R code)  \tabularnewline
Raw Outputview raw output of R engine  \tabularnewline
Computing time3 seconds \tabularnewline
R ServerBig Analytics Cloud Computing Center \tabularnewline
\hline
\end{tabular}
%Source: https://freestatistics.org/blog/index.php?pk=300284&T=0

[TABLE]
[ROW]
Summary of computational transaction[/C][/ROW] [ROW]Raw Input[/C] view raw input (R code) [/C][/ROW] [ROW]Raw Output[/C]view raw output of R engine [/C][/ROW] [ROW]Computing time[/C]3 seconds[/C][/ROW] [ROW]R Server[/C]Big Analytics Cloud Computing Center[/C][/ROW] [/TABLE] Source: https://freestatistics.org/blog/index.php?pk=300284&T=0

Globally Unique Identifier (entire table): ba.freestatistics.org/blog/index.php?pk=300284&T=0

As an alternative you can also use a QR Code:  

The GUIDs for individual cells are displayed in the table below:

Summary of computational transaction
Raw Input view raw input (R code)
Raw Outputview raw output of R engine
Computing time3 seconds
R ServerBig Analytics Cloud Computing Center


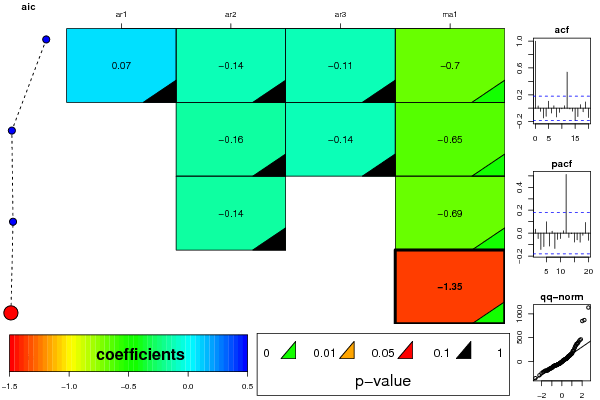
ARIMA Parameter Estimation and Backward Selection
Iterationar1ar2ar3ma1
Estimates ( 1 )0.0702-0.1355-0.1095-0.6964
(p-val)(0.6178 )(0.2119 )(0.3179 )(0 )
Estimates ( 2 )0-0.1568-0.1365-0.6501
(p-val)(NA )(0.1211 )(0.1468 )(0 )
Estimates ( 3 )0-0.14330-0.6882
(p-val)(NA )(0.1621 )(NA )(0 )
Estimates ( 4 )000-1.3546
(p-val)(NA )(NA )(NA )(0 )
Estimates ( 5 )NANANANA
(p-val)(NA )(NA )(NA )(NA )
Estimates ( 6 )NANANANA
(p-val)(NA )(NA )(NA )(NA )
Estimates ( 7 )NANANANA
(p-val)(NA )(NA )(NA )(NA )

\begin{tabular}{lllllllll}
\hline
ARIMA Parameter Estimation and Backward Selection \tabularnewline
Iteration & ar1 & ar2 & ar3 & ma1 \tabularnewline
Estimates ( 1 ) & 0.0702 & -0.1355 & -0.1095 & -0.6964 \tabularnewline
(p-val) & (0.6178 ) & (0.2119 ) & (0.3179 ) & (0 ) \tabularnewline
Estimates ( 2 ) & 0 & -0.1568 & -0.1365 & -0.6501 \tabularnewline
(p-val) & (NA ) & (0.1211 ) & (0.1468 ) & (0 ) \tabularnewline
Estimates ( 3 ) & 0 & -0.1433 & 0 & -0.6882 \tabularnewline
(p-val) & (NA ) & (0.1621 ) & (NA ) & (0 ) \tabularnewline
Estimates ( 4 ) & 0 & 0 & 0 & -1.3546 \tabularnewline
(p-val) & (NA ) & (NA ) & (NA ) & (0 ) \tabularnewline
Estimates ( 5 ) & NA & NA & NA & NA \tabularnewline
(p-val) & (NA ) & (NA ) & (NA ) & (NA ) \tabularnewline
Estimates ( 6 ) & NA & NA & NA & NA \tabularnewline
(p-val) & (NA ) & (NA ) & (NA ) & (NA ) \tabularnewline
Estimates ( 7 ) & NA & NA & NA & NA \tabularnewline
(p-val) & (NA ) & (NA ) & (NA ) & (NA ) \tabularnewline
\hline
\end{tabular}
%Source: https://freestatistics.org/blog/index.php?pk=300284&T=1

[TABLE]
[ROW][C]ARIMA Parameter Estimation and Backward Selection[/C][/ROW]
[ROW][C]Iteration[/C][C]ar1[/C][C]ar2[/C][C]ar3[/C][C]ma1[/C][/ROW]
[ROW][C]Estimates ( 1 )[/C][C]0.0702[/C][C]-0.1355[/C][C]-0.1095[/C][C]-0.6964[/C][/ROW]
[ROW][C](p-val)[/C][C](0.6178 )[/C][C](0.2119 )[/C][C](0.3179 )[/C][C](0 )[/C][/ROW]
[ROW][C]Estimates ( 2 )[/C][C]0[/C][C]-0.1568[/C][C]-0.1365[/C][C]-0.6501[/C][/ROW]
[ROW][C](p-val)[/C][C](NA )[/C][C](0.1211 )[/C][C](0.1468 )[/C][C](0 )[/C][/ROW]
[ROW][C]Estimates ( 3 )[/C][C]0[/C][C]-0.1433[/C][C]0[/C][C]-0.6882[/C][/ROW]
[ROW][C](p-val)[/C][C](NA )[/C][C](0.1621 )[/C][C](NA )[/C][C](0 )[/C][/ROW]
[ROW][C]Estimates ( 4 )[/C][C]0[/C][C]0[/C][C]0[/C][C]-1.3546[/C][/ROW]
[ROW][C](p-val)[/C][C](NA )[/C][C](NA )[/C][C](NA )[/C][C](0 )[/C][/ROW]
[ROW][C]Estimates ( 5 )[/C][C]NA[/C][C]NA[/C][C]NA[/C][C]NA[/C][/ROW]
[ROW][C](p-val)[/C][C](NA )[/C][C](NA )[/C][C](NA )[/C][C](NA )[/C][/ROW]
[ROW][C]Estimates ( 6 )[/C][C]NA[/C][C]NA[/C][C]NA[/C][C]NA[/C][/ROW]
[ROW][C](p-val)[/C][C](NA )[/C][C](NA )[/C][C](NA )[/C][C](NA )[/C][/ROW]
[ROW][C]Estimates ( 7 )[/C][C]NA[/C][C]NA[/C][C]NA[/C][C]NA[/C][/ROW]
[ROW][C](p-val)[/C][C](NA )[/C][C](NA )[/C][C](NA )[/C][C](NA )[/C][/ROW]
[/TABLE]
Source: https://freestatistics.org/blog/index.php?pk=300284&T=1

Globally Unique Identifier (entire table): ba.freestatistics.org/blog/index.php?pk=300284&T=1

As an alternative you can also use a QR Code:  

The GUIDs for individual cells are displayed in the table below:

ARIMA Parameter Estimation and Backward Selection
Iterationar1ar2ar3ma1
Estimates ( 1 )0.0702-0.1355-0.1095-0.6964
(p-val)(0.6178 )(0.2119 )(0.3179 )(0 )
Estimates ( 2 )0-0.1568-0.1365-0.6501
(p-val)(NA )(0.1211 )(0.1468 )(0 )
Estimates ( 3 )0-0.14330-0.6882
(p-val)(NA )(0.1621 )(NA )(0 )
Estimates ( 4 )000-1.3546
(p-val)(NA )(NA )(NA )(0 )
Estimates ( 5 )NANANANA
(p-val)(NA )(NA )(NA )(NA )
Estimates ( 6 )NANANANA
(p-val)(NA )(NA )(NA )(NA )
Estimates ( 7 )NANANANA
(p-val)(NA )(NA )(NA )(NA )


Estimated ARIMA Residuals
Value
2.66993799152037
88.6864590948936
-77.1774260364736
-46.5307936437066
369.001801570518
-79.6448784839128
6.70005925782055
-34.0777936688173
-145.603623415872
58.2071792247138
121.696844486588
232.896015070231
-94.3140867608679
129.848148970616
-78.3478176082914
27.2941471089502
80.7680053455247
-61.9841374361508
-77.1788258324763
-87.3930204475
-46.8248222057289
146.422169741115
55.7615415350954
446.774326776856
-78.2736439149752
21.0105068588159
-65.3453669778059
-45.4949117055892
117.395910670449
33.063497326411
174.851657635806
-29.3595279306856
-7.25488852267357
117.322625092969
335.200538869182
868.269442405562
-292.695618959857
-73.2591245873583
-106.136749113411
225.43067770087
164.472935242966
-9.507238908622
133.410676692972
23.7514312375623
-39.0597074932756
43.8870369628484
386.781303651899
1132.17586125832
-167.227496400732
-80.7465062037463
-250.84074125134
3.89199722098783
50.3938470921416
-188.707231728701
-145.457719649094
-196.24669622393
322.056537878211
61.7622746030133
-25.5154722308148
213.403354622959
-212.826712233813
-226.114724501221
-59.13089804727
-19.8994900375551
-115.251768668983
160.065278661029
-6.66514643515848
160.015031622847
-100.248818864588
-82.9256018373239
294.038730114623
272.545092281546
-164.563560019506
18.5613270136982
-192.466759760707
-94.4195915212217
219.294738124004
-169.37926999453
-102.341128067423
-121.682883882957
-15.2350216010359
-60.9097859915037
83.028203627106
414.772934593504
60.037101347119
107.457797092349
-138.62839846706
-149.196281172975
54.7433006792721
-151.321058582821
-137.340002802308
-124.098768743009
86.9797081430202
50.4369394516393
-54.3014760783244
848.114578352871
-352.869394664439
-87.4628634997594
-193.222729193716
-197.420803190728
35.5505048074037
-47.7925181150276
-88.2179404871504
-7.50028090157548
-32.8565050218558
66.6177968565858
371.33810465245
463.123776877269
-57.9361384214299
22.190012216789
40.5909379675227
144.901784383092
116.292167702085
-54.7215530268772
102.368832324015
27.3523889344297

\begin{tabular}{lllllllll}
\hline
Estimated ARIMA Residuals \tabularnewline
Value \tabularnewline
2.66993799152037 \tabularnewline
88.6864590948936 \tabularnewline
-77.1774260364736 \tabularnewline
-46.5307936437066 \tabularnewline
369.001801570518 \tabularnewline
-79.6448784839128 \tabularnewline
6.70005925782055 \tabularnewline
-34.0777936688173 \tabularnewline
-145.603623415872 \tabularnewline
58.2071792247138 \tabularnewline
121.696844486588 \tabularnewline
232.896015070231 \tabularnewline
-94.3140867608679 \tabularnewline
129.848148970616 \tabularnewline
-78.3478176082914 \tabularnewline
27.2941471089502 \tabularnewline
80.7680053455247 \tabularnewline
-61.9841374361508 \tabularnewline
-77.1788258324763 \tabularnewline
-87.3930204475 \tabularnewline
-46.8248222057289 \tabularnewline
146.422169741115 \tabularnewline
55.7615415350954 \tabularnewline
446.774326776856 \tabularnewline
-78.2736439149752 \tabularnewline
21.0105068588159 \tabularnewline
-65.3453669778059 \tabularnewline
-45.4949117055892 \tabularnewline
117.395910670449 \tabularnewline
33.063497326411 \tabularnewline
174.851657635806 \tabularnewline
-29.3595279306856 \tabularnewline
-7.25488852267357 \tabularnewline
117.322625092969 \tabularnewline
335.200538869182 \tabularnewline
868.269442405562 \tabularnewline
-292.695618959857 \tabularnewline
-73.2591245873583 \tabularnewline
-106.136749113411 \tabularnewline
225.43067770087 \tabularnewline
164.472935242966 \tabularnewline
-9.507238908622 \tabularnewline
133.410676692972 \tabularnewline
23.7514312375623 \tabularnewline
-39.0597074932756 \tabularnewline
43.8870369628484 \tabularnewline
386.781303651899 \tabularnewline
1132.17586125832 \tabularnewline
-167.227496400732 \tabularnewline
-80.7465062037463 \tabularnewline
-250.84074125134 \tabularnewline
3.89199722098783 \tabularnewline
50.3938470921416 \tabularnewline
-188.707231728701 \tabularnewline
-145.457719649094 \tabularnewline
-196.24669622393 \tabularnewline
322.056537878211 \tabularnewline
61.7622746030133 \tabularnewline
-25.5154722308148 \tabularnewline
213.403354622959 \tabularnewline
-212.826712233813 \tabularnewline
-226.114724501221 \tabularnewline
-59.13089804727 \tabularnewline
-19.8994900375551 \tabularnewline
-115.251768668983 \tabularnewline
160.065278661029 \tabularnewline
-6.66514643515848 \tabularnewline
160.015031622847 \tabularnewline
-100.248818864588 \tabularnewline
-82.9256018373239 \tabularnewline
294.038730114623 \tabularnewline
272.545092281546 \tabularnewline
-164.563560019506 \tabularnewline
18.5613270136982 \tabularnewline
-192.466759760707 \tabularnewline
-94.4195915212217 \tabularnewline
219.294738124004 \tabularnewline
-169.37926999453 \tabularnewline
-102.341128067423 \tabularnewline
-121.682883882957 \tabularnewline
-15.2350216010359 \tabularnewline
-60.9097859915037 \tabularnewline
83.028203627106 \tabularnewline
414.772934593504 \tabularnewline
60.037101347119 \tabularnewline
107.457797092349 \tabularnewline
-138.62839846706 \tabularnewline
-149.196281172975 \tabularnewline
54.7433006792721 \tabularnewline
-151.321058582821 \tabularnewline
-137.340002802308 \tabularnewline
-124.098768743009 \tabularnewline
86.9797081430202 \tabularnewline
50.4369394516393 \tabularnewline
-54.3014760783244 \tabularnewline
848.114578352871 \tabularnewline
-352.869394664439 \tabularnewline
-87.4628634997594 \tabularnewline
-193.222729193716 \tabularnewline
-197.420803190728 \tabularnewline
35.5505048074037 \tabularnewline
-47.7925181150276 \tabularnewline
-88.2179404871504 \tabularnewline
-7.50028090157548 \tabularnewline
-32.8565050218558 \tabularnewline
66.6177968565858 \tabularnewline
371.33810465245 \tabularnewline
463.123776877269 \tabularnewline
-57.9361384214299 \tabularnewline
22.190012216789 \tabularnewline
40.5909379675227 \tabularnewline
144.901784383092 \tabularnewline
116.292167702085 \tabularnewline
-54.7215530268772 \tabularnewline
102.368832324015 \tabularnewline
27.3523889344297 \tabularnewline
\hline
\end{tabular}
%Source: https://freestatistics.org/blog/index.php?pk=300284&T=2

[TABLE]
[ROW][C]Estimated ARIMA Residuals[/C][/ROW]
[ROW][C]Value[/C][/ROW]
[ROW][C]2.66993799152037[/C][/ROW]
[ROW][C]88.6864590948936[/C][/ROW]
[ROW][C]-77.1774260364736[/C][/ROW]
[ROW][C]-46.5307936437066[/C][/ROW]
[ROW][C]369.001801570518[/C][/ROW]
[ROW][C]-79.6448784839128[/C][/ROW]
[ROW][C]6.70005925782055[/C][/ROW]
[ROW][C]-34.0777936688173[/C][/ROW]
[ROW][C]-145.603623415872[/C][/ROW]
[ROW][C]58.2071792247138[/C][/ROW]
[ROW][C]121.696844486588[/C][/ROW]
[ROW][C]232.896015070231[/C][/ROW]
[ROW][C]-94.3140867608679[/C][/ROW]
[ROW][C]129.848148970616[/C][/ROW]
[ROW][C]-78.3478176082914[/C][/ROW]
[ROW][C]27.2941471089502[/C][/ROW]
[ROW][C]80.7680053455247[/C][/ROW]
[ROW][C]-61.9841374361508[/C][/ROW]
[ROW][C]-77.1788258324763[/C][/ROW]
[ROW][C]-87.3930204475[/C][/ROW]
[ROW][C]-46.8248222057289[/C][/ROW]
[ROW][C]146.422169741115[/C][/ROW]
[ROW][C]55.7615415350954[/C][/ROW]
[ROW][C]446.774326776856[/C][/ROW]
[ROW][C]-78.2736439149752[/C][/ROW]
[ROW][C]21.0105068588159[/C][/ROW]
[ROW][C]-65.3453669778059[/C][/ROW]
[ROW][C]-45.4949117055892[/C][/ROW]
[ROW][C]117.395910670449[/C][/ROW]
[ROW][C]33.063497326411[/C][/ROW]
[ROW][C]174.851657635806[/C][/ROW]
[ROW][C]-29.3595279306856[/C][/ROW]
[ROW][C]-7.25488852267357[/C][/ROW]
[ROW][C]117.322625092969[/C][/ROW]
[ROW][C]335.200538869182[/C][/ROW]
[ROW][C]868.269442405562[/C][/ROW]
[ROW][C]-292.695618959857[/C][/ROW]
[ROW][C]-73.2591245873583[/C][/ROW]
[ROW][C]-106.136749113411[/C][/ROW]
[ROW][C]225.43067770087[/C][/ROW]
[ROW][C]164.472935242966[/C][/ROW]
[ROW][C]-9.507238908622[/C][/ROW]
[ROW][C]133.410676692972[/C][/ROW]
[ROW][C]23.7514312375623[/C][/ROW]
[ROW][C]-39.0597074932756[/C][/ROW]
[ROW][C]43.8870369628484[/C][/ROW]
[ROW][C]386.781303651899[/C][/ROW]
[ROW][C]1132.17586125832[/C][/ROW]
[ROW][C]-167.227496400732[/C][/ROW]
[ROW][C]-80.7465062037463[/C][/ROW]
[ROW][C]-250.84074125134[/C][/ROW]
[ROW][C]3.89199722098783[/C][/ROW]
[ROW][C]50.3938470921416[/C][/ROW]
[ROW][C]-188.707231728701[/C][/ROW]
[ROW][C]-145.457719649094[/C][/ROW]
[ROW][C]-196.24669622393[/C][/ROW]
[ROW][C]322.056537878211[/C][/ROW]
[ROW][C]61.7622746030133[/C][/ROW]
[ROW][C]-25.5154722308148[/C][/ROW]
[ROW][C]213.403354622959[/C][/ROW]
[ROW][C]-212.826712233813[/C][/ROW]
[ROW][C]-226.114724501221[/C][/ROW]
[ROW][C]-59.13089804727[/C][/ROW]
[ROW][C]-19.8994900375551[/C][/ROW]
[ROW][C]-115.251768668983[/C][/ROW]
[ROW][C]160.065278661029[/C][/ROW]
[ROW][C]-6.66514643515848[/C][/ROW]
[ROW][C]160.015031622847[/C][/ROW]
[ROW][C]-100.248818864588[/C][/ROW]
[ROW][C]-82.9256018373239[/C][/ROW]
[ROW][C]294.038730114623[/C][/ROW]
[ROW][C]272.545092281546[/C][/ROW]
[ROW][C]-164.563560019506[/C][/ROW]
[ROW][C]18.5613270136982[/C][/ROW]
[ROW][C]-192.466759760707[/C][/ROW]
[ROW][C]-94.4195915212217[/C][/ROW]
[ROW][C]219.294738124004[/C][/ROW]
[ROW][C]-169.37926999453[/C][/ROW]
[ROW][C]-102.341128067423[/C][/ROW]
[ROW][C]-121.682883882957[/C][/ROW]
[ROW][C]-15.2350216010359[/C][/ROW]
[ROW][C]-60.9097859915037[/C][/ROW]
[ROW][C]83.028203627106[/C][/ROW]
[ROW][C]414.772934593504[/C][/ROW]
[ROW][C]60.037101347119[/C][/ROW]
[ROW][C]107.457797092349[/C][/ROW]
[ROW][C]-138.62839846706[/C][/ROW]
[ROW][C]-149.196281172975[/C][/ROW]
[ROW][C]54.7433006792721[/C][/ROW]
[ROW][C]-151.321058582821[/C][/ROW]
[ROW][C]-137.340002802308[/C][/ROW]
[ROW][C]-124.098768743009[/C][/ROW]
[ROW][C]86.9797081430202[/C][/ROW]
[ROW][C]50.4369394516393[/C][/ROW]
[ROW][C]-54.3014760783244[/C][/ROW]
[ROW][C]848.114578352871[/C][/ROW]
[ROW][C]-352.869394664439[/C][/ROW]
[ROW][C]-87.4628634997594[/C][/ROW]
[ROW][C]-193.222729193716[/C][/ROW]
[ROW][C]-197.420803190728[/C][/ROW]
[ROW][C]35.5505048074037[/C][/ROW]
[ROW][C]-47.7925181150276[/C][/ROW]
[ROW][C]-88.2179404871504[/C][/ROW]
[ROW][C]-7.50028090157548[/C][/ROW]
[ROW][C]-32.8565050218558[/C][/ROW]
[ROW][C]66.6177968565858[/C][/ROW]
[ROW][C]371.33810465245[/C][/ROW]
[ROW][C]463.123776877269[/C][/ROW]
[ROW][C]-57.9361384214299[/C][/ROW]
[ROW][C]22.190012216789[/C][/ROW]
[ROW][C]40.5909379675227[/C][/ROW]
[ROW][C]144.901784383092[/C][/ROW]
[ROW][C]116.292167702085[/C][/ROW]
[ROW][C]-54.7215530268772[/C][/ROW]
[ROW][C]102.368832324015[/C][/ROW]
[ROW][C]27.3523889344297[/C][/ROW]
[/TABLE]
Source: https://freestatistics.org/blog/index.php?pk=300284&T=2

Globally Unique Identifier (entire table): ba.freestatistics.org/blog/index.php?pk=300284&T=2

As an alternative you can also use a QR Code:  

The GUIDs for individual cells are displayed in the table below:

Estimated ARIMA Residuals
Value
2.66993799152037
88.6864590948936
-77.1774260364736
-46.5307936437066
369.001801570518
-79.6448784839128
6.70005925782055
-34.0777936688173
-145.603623415872
58.2071792247138
121.696844486588
232.896015070231
-94.3140867608679
129.848148970616
-78.3478176082914
27.2941471089502
80.7680053455247
-61.9841374361508
-77.1788258324763
-87.3930204475
-46.8248222057289
146.422169741115
55.7615415350954
446.774326776856
-78.2736439149752
21.0105068588159
-65.3453669778059
-45.4949117055892
117.395910670449
33.063497326411
174.851657635806
-29.3595279306856
-7.25488852267357
117.322625092969
335.200538869182
868.269442405562
-292.695618959857
-73.2591245873583
-106.136749113411
225.43067770087
164.472935242966
-9.507238908622
133.410676692972
23.7514312375623
-39.0597074932756
43.8870369628484
386.781303651899
1132.17586125832
-167.227496400732
-80.7465062037463
-250.84074125134
3.89199722098783
50.3938470921416
-188.707231728701
-145.457719649094
-196.24669622393
322.056537878211
61.7622746030133
-25.5154722308148
213.403354622959
-212.826712233813
-226.114724501221
-59.13089804727
-19.8994900375551
-115.251768668983
160.065278661029
-6.66514643515848
160.015031622847
-100.248818864588
-82.9256018373239
294.038730114623
272.545092281546
-164.563560019506
18.5613270136982
-192.466759760707
-94.4195915212217
219.294738124004
-169.37926999453
-102.341128067423
-121.682883882957
-15.2350216010359
-60.9097859915037
83.028203627106
414.772934593504
60.037101347119
107.457797092349
-138.62839846706
-149.196281172975
54.7433006792721
-151.321058582821
-137.340002802308
-124.098768743009
86.9797081430202
50.4369394516393
-54.3014760783244
848.114578352871
-352.869394664439
-87.4628634997594
-193.222729193716
-197.420803190728
35.5505048074037
-47.7925181150276
-88.2179404871504
-7.50028090157548
-32.8565050218558
66.6177968565858
371.33810465245
463.123776877269
-57.9361384214299
22.190012216789
40.5909379675227
144.901784383092
116.292167702085
-54.7215530268772
102.368832324015
27.3523889344297


Parameters (Session):
par1 = FALSE ; par2 = 1 ; par3 = 1 ; par4 = 0 ; par5 = 1 ; par6 = 3 ; par7 = 1 ; par8 = 0 ; par9 = 0 ;
Parameters (R input):
par1 = FALSE ; par2 = 1 ; par3 = 1 ; par4 = 0 ; par5 = 1 ; par6 = 3 ; par7 = 1 ; par8 = 0 ; par9 = 0 ;
R code (references can be found in the software module):
library(lattice)
if (par1 == 'TRUE') par1 <- TRUE
if (par1 == 'FALSE') par1 <- FALSE
par2 <- as.numeric(par2) #Box-Cox lambda transformation parameter
par3 <- as.numeric(par3) #degree of non-seasonal differencing
par4 <- as.numeric(par4) #degree of seasonal differencing
par5 <- as.numeric(par5) #seasonal period
par6 <- as.numeric(par6) #degree (p) of the non-seasonal AR(p) polynomial
par7 <- as.numeric(par7) #degree (q) of the non-seasonal MA(q) polynomial
par8 <- as.numeric(par8) #degree (P) of the seasonal AR(P) polynomial
par9 <- as.numeric(par9) #degree (Q) of the seasonal MA(Q) polynomial
armaGR <- function(arima.out, names, n){
try1 <- arima.out$coef
try2 <- sqrt(diag(arima.out$var.coef))
try.data.frame <- data.frame(matrix(NA,ncol=4,nrow=length(names)))
dimnames(try.data.frame) <- list(names,c('coef','std','tstat','pv'))
try.data.frame[,1] <- try1
for(i in 1:length(try2)) try.data.frame[which(rownames(try.data.frame)==names(try2)[i]),2] <- try2[i]
try.data.frame[,3] <- try.data.frame[,1] / try.data.frame[,2]
try.data.frame[,4] <- round((1-pt(abs(try.data.frame[,3]),df=n-(length(try2)+1)))*2,5)
vector <- rep(NA,length(names))
vector[is.na(try.data.frame[,4])] <- 0
maxi <- which.max(try.data.frame[,4])
continue <- max(try.data.frame[,4],na.rm=TRUE) > .05
vector[maxi] <- 0
list(summary=try.data.frame,next.vector=vector,continue=continue)
}
arimaSelect <- function(series, order=c(13,0,0), seasonal=list(order=c(2,0,0),period=12), include.mean=F){
nrc <- order[1]+order[3]+seasonal$order[1]+seasonal$order[3]
coeff <- matrix(NA, nrow=nrc*2, ncol=nrc)
pval <- matrix(NA, nrow=nrc*2, ncol=nrc)
mylist <- rep(list(NULL), nrc)
names <- NULL
if(order[1] > 0) names <- paste('ar',1:order[1],sep='')
if(order[3] > 0) names <- c( names , paste('ma',1:order[3],sep='') )
if(seasonal$order[1] > 0) names <- c(names, paste('sar',1:seasonal$order[1],sep=''))
if(seasonal$order[3] > 0) names <- c(names, paste('sma',1:seasonal$order[3],sep=''))
arima.out <- arima(series, order=order, seasonal=seasonal, include.mean=include.mean, method='ML')
mylist[[1]] <- arima.out
last.arma <- armaGR(arima.out, names, length(series))
mystop <- FALSE
i <- 1
coeff[i,] <- last.arma[[1]][,1]
pval [i,] <- last.arma[[1]][,4]
i <- 2
aic <- arima.out$aic
while(!mystop){
mylist[[i]] <- arima.out
arima.out <- arima(series, order=order, seasonal=seasonal, include.mean=include.mean, method='ML', fixed=last.arma$next.vector)
aic <- c(aic, arima.out$aic)
last.arma <- armaGR(arima.out, names, length(series))
mystop <- !last.arma$continue
coeff[i,] <- last.arma[[1]][,1]
pval [i,] <- last.arma[[1]][,4]
i <- i+1
}
list(coeff, pval, mylist, aic=aic)
}
arimaSelectplot <- function(arimaSelect.out,noms,choix){
noms <- names(arimaSelect.out[[3]][[1]]$coef)
coeff <- arimaSelect.out[[1]]
k <- min(which(is.na(coeff[,1])))-1
coeff <- coeff[1:k,]
pval <- arimaSelect.out[[2]][1:k,]
aic <- arimaSelect.out$aic[1:k]
coeff[coeff==0] <- NA
n <- ncol(coeff)
if(missing(choix)) choix <- k
layout(matrix(c(1,1,1,2,
3,3,3,2,
3,3,3,4,
5,6,7,7),nr=4),
widths=c(10,35,45,15),
heights=c(30,30,15,15))
couleurs <- rainbow(75)[1:50]#(50)
ticks <- pretty(coeff)
par(mar=c(1,1,3,1))
plot(aic,k:1-.5,type='o',pch=21,bg='blue',cex=2,axes=F,lty=2,xpd=NA)
points(aic[choix],k-choix+.5,pch=21,cex=4,bg=2,xpd=NA)
title('aic',line=2)
par(mar=c(3,0,0,0))
plot(0,axes=F,xlab='',ylab='',xlim=range(ticks),ylim=c(.1,1))
rect(xleft = min(ticks) + (0:49)/50*(max(ticks)-min(ticks)),
xright = min(ticks) + (1:50)/50*(max(ticks)-min(ticks)),
ytop = rep(1,50),
ybottom= rep(0,50),col=couleurs,border=NA)
axis(1,ticks)
rect(xleft=min(ticks),xright=max(ticks),ytop=1,ybottom=0)
text(mean(coeff,na.rm=T),.5,'coefficients',cex=2,font=2)
par(mar=c(1,1,3,1))
image(1:n,1:k,t(coeff[k:1,]),axes=F,col=couleurs,zlim=range(ticks))
for(i in 1:n) for(j in 1:k) if(!is.na(coeff[j,i])) {
if(pval[j,i]<.01) symb = 'green'
else if( (pval[j,i]<.05) & (pval[j,i]>=.01)) symb = 'orange'
else if( (pval[j,i]<.1) & (pval[j,i]>=.05)) symb = 'red'
else symb = 'black'
polygon(c(i+.5 ,i+.2 ,i+.5 ,i+.5),
c(k-j+0.5,k-j+0.5,k-j+0.8,k-j+0.5),
col=symb)
if(j==choix) {
rect(xleft=i-.5,
xright=i+.5,
ybottom=k-j+1.5,
ytop=k-j+.5,
lwd=4)
text(i,
k-j+1,
round(coeff[j,i],2),
cex=1.2,
font=2)
}
else{
rect(xleft=i-.5,xright=i+.5,ybottom=k-j+1.5,ytop=k-j+.5)
text(i,k-j+1,round(coeff[j,i],2),cex=1.2,font=1)
}
}
axis(3,1:n,noms)
par(mar=c(0.5,0,0,0.5))
plot(0,axes=F,xlab='',ylab='',type='n',xlim=c(0,8),ylim=c(-.2,.8))
cols <- c('green','orange','red','black')
niv <- c('0','0.01','0.05','0.1')
for(i in 0:3){
polygon(c(1+2*i ,1+2*i ,1+2*i-.5 ,1+2*i),
c(.4 ,.7 , .4 , .4),
col=cols[i+1])
text(2*i,0.5,niv[i+1],cex=1.5)
}
text(8,.5,1,cex=1.5)
text(4,0,'p-value',cex=2)
box()
residus <- arimaSelect.out[[3]][[choix]]$res
par(mar=c(1,2,4,1))
acf(residus,main='')
title('acf',line=.5)
par(mar=c(1,2,4,1))
pacf(residus,main='')
title('pacf',line=.5)
par(mar=c(2,2,4,1))
qqnorm(residus,main='')
title('qq-norm',line=.5)
qqline(residus)
residus
}
if (par2 == 0) x <- log(x)
if (par2 != 0) x <- x^par2
(selection <- arimaSelect(x, order=c(par6,par3,par7), seasonal=list(order=c(par8,par4,par9), period=par5)))
bitmap(file='test1.png')
resid <- arimaSelectplot(selection)
dev.off()
resid
bitmap(file='test2.png')
acf(resid,length(resid)/2, main='Residual Autocorrelation Function')
dev.off()
bitmap(file='test3.png')
pacf(resid,length(resid)/2, main='Residual Partial Autocorrelation Function')
dev.off()
bitmap(file='test4.png')
cpgram(resid, main='Residual Cumulative Periodogram')
dev.off()
bitmap(file='test5.png')
hist(resid, main='Residual Histogram', xlab='values of Residuals')
dev.off()
bitmap(file='test6.png')
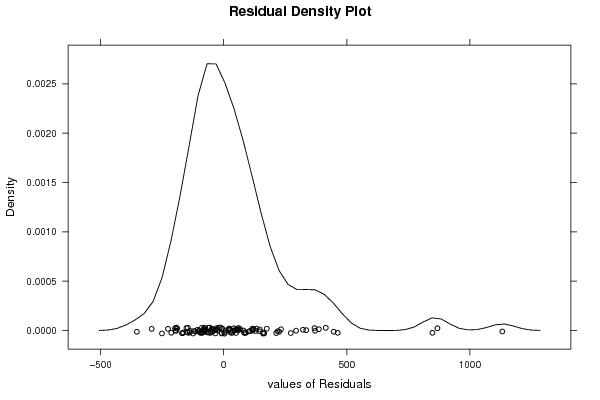
densityplot(~resid,col='black',main='Residual Density Plot', xlab='values of Residuals')
dev.off()
bitmap(file='test7.png')
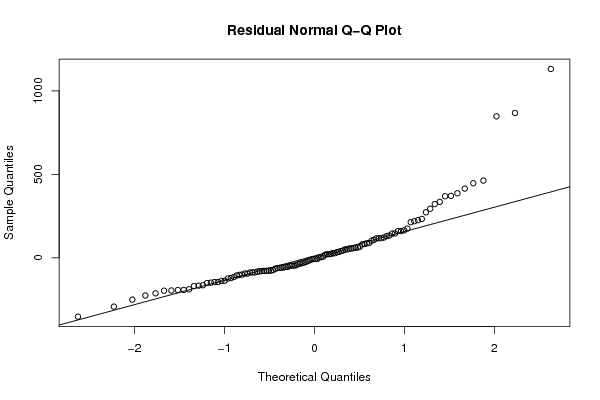
qqnorm(resid, main='Residual Normal Q-Q Plot')
qqline(resid)
dev.off()
ncols <- length(selection[[1]][1,])
nrows <- length(selection[[2]][,1])-1
load(file='createtable')
a<-table.start()
a<-table.row.start(a)
a<-table.element(a,'ARIMA Parameter Estimation and Backward Selection', ncols+1,TRUE)
a<-table.row.end(a)
a<-table.row.start(a)
a<-table.element(a,'Iteration', header=TRUE)
for (i in 1:ncols) {
a<-table.element(a,names(selection[[3]][[1]]$coef)[i],header=TRUE)
}
a<-table.row.end(a)
for (j in 1:nrows) {
a<-table.row.start(a)
mydum <- 'Estimates ('
mydum <- paste(mydum,j)
mydum <- paste(mydum,')')
a<-table.element(a,mydum, header=TRUE)
for (i in 1:ncols) {
a<-table.element(a,round(selection[[1]][j,i],4))
}
a<-table.row.end(a)
a<-table.row.start(a)
a<-table.element(a,'(p-val)', header=TRUE)
for (i in 1:ncols) {
mydum <- '('
mydum <- paste(mydum,round(selection[[2]][j,i],4),sep='')
mydum <- paste(mydum,')')
a<-table.element(a,mydum)
}
a<-table.row.end(a)
}
a<-table.end(a)
table.save(a,file='mytable.tab')
a<-table.start()
a<-table.row.start(a)
a<-table.element(a,'Estimated ARIMA Residuals', 1,TRUE)
a<-table.row.end(a)
a<-table.row.start(a)
a<-table.element(a,'Value', 1,TRUE)
a<-table.row.end(a)
for (i in (par4*par5+par3):length(resid)) {
a<-table.row.start(a)
a<-table.element(a,resid[i])
a<-table.row.end(a)
}
a<-table.end(a)
table.save(a,file='mytable1.tab')