Free Statistics

of Irreproducible Research!

Author's title

Author*The author of this computation has been verified*
R Software Modulerwasp_exponentialsmoothing.wasp
Title produced by softwareExponential Smoothing
Date of computationFri, 16 Dec 2016 15:22:17 +0100
Cite this page as followsStatistical Computations at FreeStatistics.org, Office for Research Development and Education, URL https://freestatistics.org/blog/index.php?v=date/2016/Dec/16/t1481898154jeokvw87dhomy08.htm/, Retrieved Thu, 02 May 2024 22:55:20 +0000
Statistical Computations at FreeStatistics.org, Office for Research Development and Education, URL https://freestatistics.org/blog/index.php?pk=300301, Retrieved Thu, 02 May 2024 22:55:20 +0000
QR Codes:

Original text written by user:
IsPrivate?No (this computation is public)
User-defined keywords
Estimated Impact65
Family? (F = Feedback message, R = changed R code, M = changed R Module, P = changed Parameters, D = changed Data)
-     [ARIMA Backward Selection] [] [2016-12-16 13:36:55] [683f400e1b95307fc738e729f07c4fce]
-    D  [ARIMA Backward Selection] [] [2016-12-16 14:17:56] [683f400e1b95307fc738e729f07c4fce]
- RM        [Exponential Smoothing] [] [2016-12-16 14:22:17] [404ac5ee4f7301873f6a96ef36861981] [Current]
Feedback Forum

Post a new message
Dataseries X:
3530
3440
3120
3420
3680
3710
3940
3600
3970
4040
4060
3760
4070
4130
4080
4420
4530
4710
5070
5470
5520
5980
6340
6170
6170
6670
7310
7330
6430
6750
7500
7930
8210
7640
7720
7290
7430
8130
8180
8230
8420


Summary of computational transaction
Raw Input view raw input (R code)
Raw Outputview raw output of R engine
Computing time1 seconds
R ServerBig Analytics Cloud Computing Center

\begin{tabular}{lllllllll}
\hline
Summary of computational transaction \tabularnewline
Raw Input view raw input (R code)  \tabularnewline
Raw Outputview raw output of R engine  \tabularnewline
Computing time1 seconds \tabularnewline
R ServerBig Analytics Cloud Computing Center \tabularnewline
\hline
\end{tabular}
%Source: https://freestatistics.org/blog/index.php?pk=300301&T=0

[TABLE]
[ROW]
Summary of computational transaction[/C][/ROW] [ROW]Raw Input[/C] view raw input (R code) [/C][/ROW] [ROW]Raw Output[/C]view raw output of R engine [/C][/ROW] [ROW]Computing time[/C]1 seconds[/C][/ROW] [ROW]R Server[/C]Big Analytics Cloud Computing Center[/C][/ROW] [/TABLE] Source: https://freestatistics.org/blog/index.php?pk=300301&T=0

Globally Unique Identifier (entire table): ba.freestatistics.org/blog/index.php?pk=300301&T=0

As an alternative you can also use a QR Code:  

The GUIDs for individual cells are displayed in the table below:

Summary of computational transaction
Raw Input view raw input (R code)
Raw Outputview raw output of R engine
Computing time1 seconds
R ServerBig Analytics Cloud Computing Center


Estimated Parameters of Exponential Smoothing
ParameterValue
alpha1
beta0.081394319016618
gammaFALSE

\begin{tabular}{lllllllll}
\hline
Estimated Parameters of Exponential Smoothing \tabularnewline
Parameter & Value \tabularnewline
alpha & 1 \tabularnewline
beta & 0.081394319016618 \tabularnewline
gamma & FALSE \tabularnewline
\hline
\end{tabular}
%Source: https://freestatistics.org/blog/index.php?pk=300301&T=1

[TABLE]
[ROW][C]Estimated Parameters of Exponential Smoothing[/C][/ROW]
[ROW][C]Parameter[/C][C]Value[/C][/ROW]
[ROW][C]alpha[/C][C]1[/C][/ROW]
[ROW][C]beta[/C][C]0.081394319016618[/C][/ROW]
[ROW][C]gamma[/C][C]FALSE[/C][/ROW]
[/TABLE]
Source: https://freestatistics.org/blog/index.php?pk=300301&T=1

Globally Unique Identifier (entire table): ba.freestatistics.org/blog/index.php?pk=300301&T=1

As an alternative you can also use a QR Code:  

The GUIDs for individual cells are displayed in the table below:

Estimated Parameters of Exponential Smoothing
ParameterValue
alpha1
beta0.081394319016618
gammaFALSE


Interpolation Forecasts of Exponential Smoothing
tObservedFittedResiduals
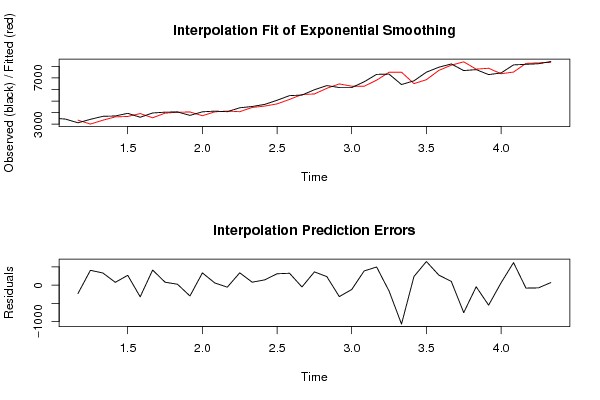
331203350-230
434203011.27930662618408.720693373822
536803344.54684913134335.45315086866
637103631.8508299082778.1491700917268
739403668.2117283896271.788271610397
836003920.33374967404-320.333749674035
939703554.26040226128415.739597738723
1040403958.0992437074681.9007562925367
1140604034.7654999928425.2345000071596
1237604056.81944493665-296.819444936648
1340703732.66002834514337.339971654861
1441304070.1175856150759.8824143849283
1540804134.991673955-54.9916739550035
1644204080.51566410185339.484335898147
1745304448.1477604390981.8522395609089
1847104564.81006773814145.189932261864
1950704756.62770340266313.37229659734
2054705142.13442808287327.865571917127
2155205568.82082303806-48.8208230380624
2259805614.84708539305365.152914606952
2363406104.56845821441235.431541785586
2461706483.73124823308-313.731248233084
2561706288.19530692892-118.195306928919
2666706278.57488041048391.42511958952
2773106810.43466146547499.565338534533
2873307491.09644199979-161.096441999792
2964307497.98410680722-1067.98410680722
3067506511.05626771307238.943732286926
3175006850.50493008586649.495069914143
3279307653.37013900617276.62986099383
3382108105.88623816142104.113761838576
3476408394.36050690653-754.360506906532
3577207762.95984715385-42.9598471538457
3672907839.4631596497-549.4631596497
3774307364.7399799452965.2600200547067
3881307510.05177483666619.948225163343
3981808260.51203844939-80.5120384493875
4082308303.95881590716-73.9588159071609
4184208347.9389884511272.061011548878

\begin{tabular}{lllllllll}
\hline
Interpolation Forecasts of Exponential Smoothing \tabularnewline
t & Observed & Fitted & Residuals \tabularnewline
3 & 3120 & 3350 & -230 \tabularnewline
4 & 3420 & 3011.27930662618 & 408.720693373822 \tabularnewline
5 & 3680 & 3344.54684913134 & 335.45315086866 \tabularnewline
6 & 3710 & 3631.85082990827 & 78.1491700917268 \tabularnewline
7 & 3940 & 3668.2117283896 & 271.788271610397 \tabularnewline
8 & 3600 & 3920.33374967404 & -320.333749674035 \tabularnewline
9 & 3970 & 3554.26040226128 & 415.739597738723 \tabularnewline
10 & 4040 & 3958.09924370746 & 81.9007562925367 \tabularnewline
11 & 4060 & 4034.76549999284 & 25.2345000071596 \tabularnewline
12 & 3760 & 4056.81944493665 & -296.819444936648 \tabularnewline
13 & 4070 & 3732.66002834514 & 337.339971654861 \tabularnewline
14 & 4130 & 4070.11758561507 & 59.8824143849283 \tabularnewline
15 & 4080 & 4134.991673955 & -54.9916739550035 \tabularnewline
16 & 4420 & 4080.51566410185 & 339.484335898147 \tabularnewline
17 & 4530 & 4448.14776043909 & 81.8522395609089 \tabularnewline
18 & 4710 & 4564.81006773814 & 145.189932261864 \tabularnewline
19 & 5070 & 4756.62770340266 & 313.37229659734 \tabularnewline
20 & 5470 & 5142.13442808287 & 327.865571917127 \tabularnewline
21 & 5520 & 5568.82082303806 & -48.8208230380624 \tabularnewline
22 & 5980 & 5614.84708539305 & 365.152914606952 \tabularnewline
23 & 6340 & 6104.56845821441 & 235.431541785586 \tabularnewline
24 & 6170 & 6483.73124823308 & -313.731248233084 \tabularnewline
25 & 6170 & 6288.19530692892 & -118.195306928919 \tabularnewline
26 & 6670 & 6278.57488041048 & 391.42511958952 \tabularnewline
27 & 7310 & 6810.43466146547 & 499.565338534533 \tabularnewline
28 & 7330 & 7491.09644199979 & -161.096441999792 \tabularnewline
29 & 6430 & 7497.98410680722 & -1067.98410680722 \tabularnewline
30 & 6750 & 6511.05626771307 & 238.943732286926 \tabularnewline
31 & 7500 & 6850.50493008586 & 649.495069914143 \tabularnewline
32 & 7930 & 7653.37013900617 & 276.62986099383 \tabularnewline
33 & 8210 & 8105.88623816142 & 104.113761838576 \tabularnewline
34 & 7640 & 8394.36050690653 & -754.360506906532 \tabularnewline
35 & 7720 & 7762.95984715385 & -42.9598471538457 \tabularnewline
36 & 7290 & 7839.4631596497 & -549.4631596497 \tabularnewline
37 & 7430 & 7364.73997994529 & 65.2600200547067 \tabularnewline
38 & 8130 & 7510.05177483666 & 619.948225163343 \tabularnewline
39 & 8180 & 8260.51203844939 & -80.5120384493875 \tabularnewline
40 & 8230 & 8303.95881590716 & -73.9588159071609 \tabularnewline
41 & 8420 & 8347.93898845112 & 72.061011548878 \tabularnewline
\hline
\end{tabular}
%Source: https://freestatistics.org/blog/index.php?pk=300301&T=2

[TABLE]
[ROW][C]Interpolation Forecasts of Exponential Smoothing[/C][/ROW]
[ROW][C]t[/C][C]Observed[/C][C]Fitted[/C][C]Residuals[/C][/ROW]
[ROW][C]3[/C][C]3120[/C][C]3350[/C][C]-230[/C][/ROW]
[ROW][C]4[/C][C]3420[/C][C]3011.27930662618[/C][C]408.720693373822[/C][/ROW]
[ROW][C]5[/C][C]3680[/C][C]3344.54684913134[/C][C]335.45315086866[/C][/ROW]
[ROW][C]6[/C][C]3710[/C][C]3631.85082990827[/C][C]78.1491700917268[/C][/ROW]
[ROW][C]7[/C][C]3940[/C][C]3668.2117283896[/C][C]271.788271610397[/C][/ROW]
[ROW][C]8[/C][C]3600[/C][C]3920.33374967404[/C][C]-320.333749674035[/C][/ROW]
[ROW][C]9[/C][C]3970[/C][C]3554.26040226128[/C][C]415.739597738723[/C][/ROW]
[ROW][C]10[/C][C]4040[/C][C]3958.09924370746[/C][C]81.9007562925367[/C][/ROW]
[ROW][C]11[/C][C]4060[/C][C]4034.76549999284[/C][C]25.2345000071596[/C][/ROW]
[ROW][C]12[/C][C]3760[/C][C]4056.81944493665[/C][C]-296.819444936648[/C][/ROW]
[ROW][C]13[/C][C]4070[/C][C]3732.66002834514[/C][C]337.339971654861[/C][/ROW]
[ROW][C]14[/C][C]4130[/C][C]4070.11758561507[/C][C]59.8824143849283[/C][/ROW]
[ROW][C]15[/C][C]4080[/C][C]4134.991673955[/C][C]-54.9916739550035[/C][/ROW]
[ROW][C]16[/C][C]4420[/C][C]4080.51566410185[/C][C]339.484335898147[/C][/ROW]
[ROW][C]17[/C][C]4530[/C][C]4448.14776043909[/C][C]81.8522395609089[/C][/ROW]
[ROW][C]18[/C][C]4710[/C][C]4564.81006773814[/C][C]145.189932261864[/C][/ROW]
[ROW][C]19[/C][C]5070[/C][C]4756.62770340266[/C][C]313.37229659734[/C][/ROW]
[ROW][C]20[/C][C]5470[/C][C]5142.13442808287[/C][C]327.865571917127[/C][/ROW]
[ROW][C]21[/C][C]5520[/C][C]5568.82082303806[/C][C]-48.8208230380624[/C][/ROW]
[ROW][C]22[/C][C]5980[/C][C]5614.84708539305[/C][C]365.152914606952[/C][/ROW]
[ROW][C]23[/C][C]6340[/C][C]6104.56845821441[/C][C]235.431541785586[/C][/ROW]
[ROW][C]24[/C][C]6170[/C][C]6483.73124823308[/C][C]-313.731248233084[/C][/ROW]
[ROW][C]25[/C][C]6170[/C][C]6288.19530692892[/C][C]-118.195306928919[/C][/ROW]
[ROW][C]26[/C][C]6670[/C][C]6278.57488041048[/C][C]391.42511958952[/C][/ROW]
[ROW][C]27[/C][C]7310[/C][C]6810.43466146547[/C][C]499.565338534533[/C][/ROW]
[ROW][C]28[/C][C]7330[/C][C]7491.09644199979[/C][C]-161.096441999792[/C][/ROW]
[ROW][C]29[/C][C]6430[/C][C]7497.98410680722[/C][C]-1067.98410680722[/C][/ROW]
[ROW][C]30[/C][C]6750[/C][C]6511.05626771307[/C][C]238.943732286926[/C][/ROW]
[ROW][C]31[/C][C]7500[/C][C]6850.50493008586[/C][C]649.495069914143[/C][/ROW]
[ROW][C]32[/C][C]7930[/C][C]7653.37013900617[/C][C]276.62986099383[/C][/ROW]
[ROW][C]33[/C][C]8210[/C][C]8105.88623816142[/C][C]104.113761838576[/C][/ROW]
[ROW][C]34[/C][C]7640[/C][C]8394.36050690653[/C][C]-754.360506906532[/C][/ROW]
[ROW][C]35[/C][C]7720[/C][C]7762.95984715385[/C][C]-42.9598471538457[/C][/ROW]
[ROW][C]36[/C][C]7290[/C][C]7839.4631596497[/C][C]-549.4631596497[/C][/ROW]
[ROW][C]37[/C][C]7430[/C][C]7364.73997994529[/C][C]65.2600200547067[/C][/ROW]
[ROW][C]38[/C][C]8130[/C][C]7510.05177483666[/C][C]619.948225163343[/C][/ROW]
[ROW][C]39[/C][C]8180[/C][C]8260.51203844939[/C][C]-80.5120384493875[/C][/ROW]
[ROW][C]40[/C][C]8230[/C][C]8303.95881590716[/C][C]-73.9588159071609[/C][/ROW]
[ROW][C]41[/C][C]8420[/C][C]8347.93898845112[/C][C]72.061011548878[/C][/ROW]
[/TABLE]
Source: https://freestatistics.org/blog/index.php?pk=300301&T=2

Globally Unique Identifier (entire table): ba.freestatistics.org/blog/index.php?pk=300301&T=2

As an alternative you can also use a QR Code:  

The GUIDs for individual cells are displayed in the table below:

Interpolation Forecasts of Exponential Smoothing
tObservedFittedResiduals
331203350-230
434203011.27930662618408.720693373822
536803344.54684913134335.45315086866
637103631.8508299082778.1491700917268
739403668.2117283896271.788271610397
836003920.33374967404-320.333749674035
939703554.26040226128415.739597738723
1040403958.0992437074681.9007562925367
1140604034.7654999928425.2345000071596
1237604056.81944493665-296.819444936648
1340703732.66002834514337.339971654861
1441304070.1175856150759.8824143849283
1540804134.991673955-54.9916739550035
1644204080.51566410185339.484335898147
1745304448.1477604390981.8522395609089
1847104564.81006773814145.189932261864
1950704756.62770340266313.37229659734
2054705142.13442808287327.865571917127
2155205568.82082303806-48.8208230380624
2259805614.84708539305365.152914606952
2363406104.56845821441235.431541785586
2461706483.73124823308-313.731248233084
2561706288.19530692892-118.195306928919
2666706278.57488041048391.42511958952
2773106810.43466146547499.565338534533
2873307491.09644199979-161.096441999792
2964307497.98410680722-1067.98410680722
3067506511.05626771307238.943732286926
3175006850.50493008586649.495069914143
3279307653.37013900617276.62986099383
3382108105.88623816142104.113761838576
3476408394.36050690653-754.360506906532
3577207762.95984715385-42.9598471538457
3672907839.4631596497-549.4631596497
3774307364.7399799452965.2600200547067
3881307510.05177483666619.948225163343
3981808260.51203844939-80.5120384493875
4082308303.95881590716-73.9588159071609
4184208347.9389884511272.061011548878


Extrapolation Forecasts of Exponential Smoothing
tForecast95% Lower Bound95% Upper Bound
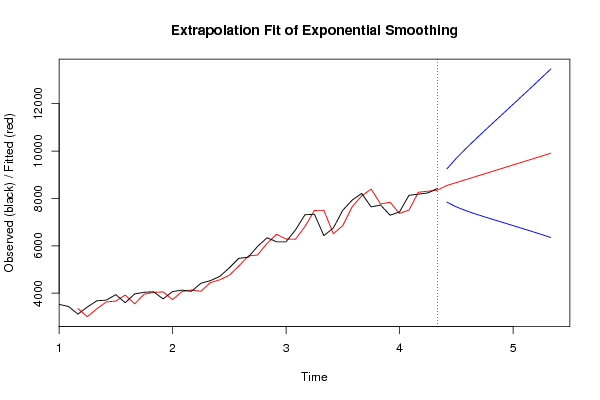
428543.804345413797847.701587391469239.90710343612
438667.608690827587642.323838725649692.89354292953
448791.413036241377485.1319117657710097.694160717
458915.217381655177347.9064565825810482.5283067277
469039.021727068967220.2559509139910857.7875032239
479162.826072482757097.1235150862611228.5286298792
489286.630417896546975.6699468567811597.5908889363
499410.434763310336854.1556081269111966.7139184938
509534.239108724126731.4508615180812337.0273559302
519658.043454137916606.792029139912709.2948791359
529781.847799551716479.6480084511513084.0475906523
539905.65214496556349.6421610729213461.6621288581

\begin{tabular}{lllllllll}
\hline
Extrapolation Forecasts of Exponential Smoothing \tabularnewline
t & Forecast & 95% Lower Bound & 95% Upper Bound \tabularnewline
42 & 8543.80434541379 & 7847.70158739146 & 9239.90710343612 \tabularnewline
43 & 8667.60869082758 & 7642.32383872564 & 9692.89354292953 \tabularnewline
44 & 8791.41303624137 & 7485.13191176577 & 10097.694160717 \tabularnewline
45 & 8915.21738165517 & 7347.90645658258 & 10482.5283067277 \tabularnewline
46 & 9039.02172706896 & 7220.25595091399 & 10857.7875032239 \tabularnewline
47 & 9162.82607248275 & 7097.12351508626 & 11228.5286298792 \tabularnewline
48 & 9286.63041789654 & 6975.66994685678 & 11597.5908889363 \tabularnewline
49 & 9410.43476331033 & 6854.15560812691 & 11966.7139184938 \tabularnewline
50 & 9534.23910872412 & 6731.45086151808 & 12337.0273559302 \tabularnewline
51 & 9658.04345413791 & 6606.7920291399 & 12709.2948791359 \tabularnewline
52 & 9781.84779955171 & 6479.64800845115 & 13084.0475906523 \tabularnewline
53 & 9905.6521449655 & 6349.64216107292 & 13461.6621288581 \tabularnewline
\hline
\end{tabular}
%Source: https://freestatistics.org/blog/index.php?pk=300301&T=3

[TABLE]
[ROW][C]Extrapolation Forecasts of Exponential Smoothing[/C][/ROW]
[ROW][C]t[/C][C]Forecast[/C][C]95% Lower Bound[/C][C]95% Upper Bound[/C][/ROW]
[ROW][C]42[/C][C]8543.80434541379[/C][C]7847.70158739146[/C][C]9239.90710343612[/C][/ROW]
[ROW][C]43[/C][C]8667.60869082758[/C][C]7642.32383872564[/C][C]9692.89354292953[/C][/ROW]
[ROW][C]44[/C][C]8791.41303624137[/C][C]7485.13191176577[/C][C]10097.694160717[/C][/ROW]
[ROW][C]45[/C][C]8915.21738165517[/C][C]7347.90645658258[/C][C]10482.5283067277[/C][/ROW]
[ROW][C]46[/C][C]9039.02172706896[/C][C]7220.25595091399[/C][C]10857.7875032239[/C][/ROW]
[ROW][C]47[/C][C]9162.82607248275[/C][C]7097.12351508626[/C][C]11228.5286298792[/C][/ROW]
[ROW][C]48[/C][C]9286.63041789654[/C][C]6975.66994685678[/C][C]11597.5908889363[/C][/ROW]
[ROW][C]49[/C][C]9410.43476331033[/C][C]6854.15560812691[/C][C]11966.7139184938[/C][/ROW]
[ROW][C]50[/C][C]9534.23910872412[/C][C]6731.45086151808[/C][C]12337.0273559302[/C][/ROW]
[ROW][C]51[/C][C]9658.04345413791[/C][C]6606.7920291399[/C][C]12709.2948791359[/C][/ROW]
[ROW][C]52[/C][C]9781.84779955171[/C][C]6479.64800845115[/C][C]13084.0475906523[/C][/ROW]
[ROW][C]53[/C][C]9905.6521449655[/C][C]6349.64216107292[/C][C]13461.6621288581[/C][/ROW]
[/TABLE]
Source: https://freestatistics.org/blog/index.php?pk=300301&T=3

Globally Unique Identifier (entire table): ba.freestatistics.org/blog/index.php?pk=300301&T=3

As an alternative you can also use a QR Code:  

The GUIDs for individual cells are displayed in the table below:

Extrapolation Forecasts of Exponential Smoothing
tForecast95% Lower Bound95% Upper Bound
428543.804345413797847.701587391469239.90710343612
438667.608690827587642.323838725649692.89354292953
448791.413036241377485.1319117657710097.694160717
458915.217381655177347.9064565825810482.5283067277
469039.021727068967220.2559509139910857.7875032239
479162.826072482757097.1235150862611228.5286298792
489286.630417896546975.6699468567811597.5908889363
499410.434763310336854.1556081269111966.7139184938
509534.239108724126731.4508615180812337.0273559302
519658.043454137916606.792029139912709.2948791359
529781.847799551716479.6480084511513084.0475906523
539905.65214496556349.6421610729213461.6621288581


Parameters (Session):
par1 = FALSE ; par2 = 1 ; par3 = 2 ; par4 = 0 ; par5 = 1 ; par6 = 3 ; par7 = 1 ; par8 = 2 ; par9 = 0 ;
Parameters (R input):
par1 = 12 ; par2 = Double ; par3 = additive ; par4 = 12 ;
R code (references can be found in the software module):
par1 <- as.numeric(par1)
par4 <- as.numeric(par4)
if (par2 == 'Single') K <- 1
if (par2 == 'Double') K <- 2
if (par2 == 'Triple') K <- par1
nx <- length(x)
nxmK <- nx - K
x <- ts(x, frequency = par1)
if (par2 == 'Single') fit <- HoltWinters(x, gamma=F, beta=F)
if (par2 == 'Double') fit <- HoltWinters(x, gamma=F)
if (par2 == 'Triple') fit <- HoltWinters(x, seasonal=par3)
fit
myresid <- x - fit$fitted[,'xhat']
bitmap(file='test1.png')
op <- par(mfrow=c(2,1))
plot(fit,ylab='Observed (black) / Fitted (red)',main='Interpolation Fit of Exponential Smoothing')
plot(myresid,ylab='Residuals',main='Interpolation Prediction Errors')
par(op)
dev.off()
bitmap(file='test2.png')
p <- predict(fit, par4, prediction.interval=TRUE)
np <- length(p[,1])
plot(fit,p,ylab='Observed (black) / Fitted (red)',main='Extrapolation Fit of Exponential Smoothing')
dev.off()
bitmap(file='test3.png')
op <- par(mfrow = c(2,2))
acf(as.numeric(myresid),lag.max = nx/2,main='Residual ACF')
spectrum(myresid,main='Residals Periodogram')
cpgram(myresid,main='Residal Cumulative Periodogram')
qqnorm(myresid,main='Residual Normal QQ Plot')
qqline(myresid)
par(op)
dev.off()
load(file='createtable')
a<-table.start()
a<-table.row.start(a)
a<-table.element(a,'Estimated Parameters of Exponential Smoothing',2,TRUE)
a<-table.row.end(a)
a<-table.row.start(a)
a<-table.element(a,'Parameter',header=TRUE)
a<-table.element(a,'Value',header=TRUE)
a<-table.row.end(a)
a<-table.row.start(a)
a<-table.element(a,'alpha',header=TRUE)
a<-table.element(a,fit$alpha)
a<-table.row.end(a)
a<-table.row.start(a)
a<-table.element(a,'beta',header=TRUE)
a<-table.element(a,fit$beta)
a<-table.row.end(a)
a<-table.row.start(a)
a<-table.element(a,'gamma',header=TRUE)
a<-table.element(a,fit$gamma)
a<-table.row.end(a)
a<-table.end(a)
table.save(a,file='mytable.tab')
a<-table.start()
a<-table.row.start(a)
a<-table.element(a,'Interpolation Forecasts of Exponential Smoothing',4,TRUE)
a<-table.row.end(a)
a<-table.row.start(a)
a<-table.element(a,'t',header=TRUE)
a<-table.element(a,'Observed',header=TRUE)
a<-table.element(a,'Fitted',header=TRUE)
a<-table.element(a,'Residuals',header=TRUE)
a<-table.row.end(a)
for (i in 1:nxmK) {
a<-table.row.start(a)
a<-table.element(a,i+K,header=TRUE)
a<-table.element(a,x[i+K])
a<-table.element(a,fit$fitted[i,'xhat'])
a<-table.element(a,myresid[i])
a<-table.row.end(a)
}
a<-table.end(a)
table.save(a,file='mytable1.tab')
a<-table.start()
a<-table.row.start(a)
a<-table.element(a,'Extrapolation Forecasts of Exponential Smoothing',4,TRUE)
a<-table.row.end(a)
a<-table.row.start(a)
a<-table.element(a,'t',header=TRUE)
a<-table.element(a,'Forecast',header=TRUE)
a<-table.element(a,'95% Lower Bound',header=TRUE)
a<-table.element(a,'95% Upper Bound',header=TRUE)
a<-table.row.end(a)
for (i in 1:np) {
a<-table.row.start(a)
a<-table.element(a,nx+i,header=TRUE)
a<-table.element(a,p[i,'fit'])
a<-table.element(a,p[i,'lwr'])
a<-table.element(a,p[i,'upr'])
a<-table.row.end(a)
}
a<-table.end(a)
table.save(a,file='mytable2.tab')