Free Statistics

of Irreproducible Research!

Author's title

Author*The author of this computation has been verified*
R Software Modulerwasp_autocorrelation.wasp
Title produced by software(Partial) Autocorrelation Function
Date of computationFri, 16 Dec 2016 15:26:32 +0100
Cite this page as followsStatistical Computations at FreeStatistics.org, Office for Research Development and Education, URL https://freestatistics.org/blog/index.php?v=date/2016/Dec/16/t14818984305e539eghyvdf33p.htm/, Retrieved Thu, 02 May 2024 15:38:00 +0000
Statistical Computations at FreeStatistics.org, Office for Research Development and Education, URL https://freestatistics.org/blog/index.php?pk=300306, Retrieved Thu, 02 May 2024 15:38:00 +0000
QR Codes:

Original text written by user:
IsPrivate?No (this computation is public)
User-defined keywords
Estimated Impact61
Family? (F = Feedback message, R = changed R code, M = changed R Module, P = changed Parameters, D = changed Data)
-     [ARIMA Backward Selection] [] [2016-12-16 13:36:55] [683f400e1b95307fc738e729f07c4fce]
-    D  [ARIMA Backward Selection] [] [2016-12-16 14:17:56] [683f400e1b95307fc738e729f07c4fce]
- RM D      [(Partial) Autocorrelation Function] [] [2016-12-16 14:26:32] [404ac5ee4f7301873f6a96ef36861981] [Current]
Feedback Forum

Post a new message
Dataseries X:
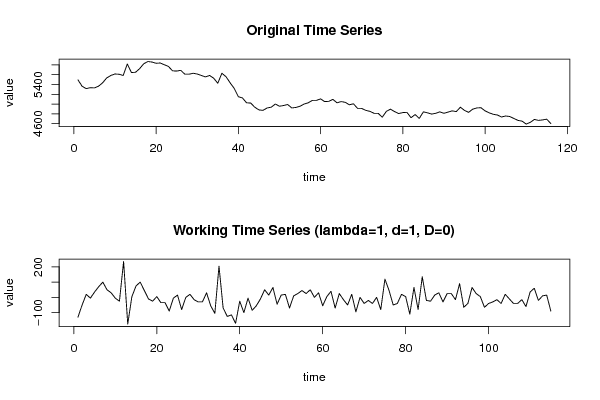
5495
5365
5315
5335
5330
5365
5435
5535
5585
5615
5610
5585
5820
5645
5650
5725
5825
5870
5860
5835
5840
5805
5770
5680
5675
5690
5610
5610
5630
5615
5585
5555
5585
5530
5425
5630
5560
5435
5320
5150
5125
5025
5020
4935
4880
4870
4920
4935
5000
4955
4970
4990
4920
4930
4955
5000
5025
5075
5075
5105
5050
5055
5095
5025
5050
5035
4985
5005
4910
4910
4870
4850
4810
4810
4730
4850
4895
4845
4805
4825
4830
4720
4785
4705
4840
4820
4795
4810
4840
4810
4835
4860
4845
4935
4870
4830
4895
4920
4925
4860
4820
4790
4775
4735
4755
4745
4705
4665
4650
4590
4625
4685
4665
4675
4690
4600


Summary of computational transaction
Raw Input view raw input (R code)
Raw Outputview raw output of R engine
Computing time2 seconds
R ServerBig Analytics Cloud Computing Center

\begin{tabular}{lllllllll}
\hline
Summary of computational transaction \tabularnewline
Raw Input view raw input (R code)  \tabularnewline
Raw Outputview raw output of R engine  \tabularnewline
Computing time2 seconds \tabularnewline
R ServerBig Analytics Cloud Computing Center \tabularnewline
\hline
\end{tabular}
%Source: https://freestatistics.org/blog/index.php?pk=300306&T=0

[TABLE]
[ROW]
Summary of computational transaction[/C][/ROW] [ROW]Raw Input[/C] view raw input (R code) [/C][/ROW] [ROW]Raw Output[/C]view raw output of R engine [/C][/ROW] [ROW]Computing time[/C]2 seconds[/C][/ROW] [ROW]R Server[/C]Big Analytics Cloud Computing Center[/C][/ROW] [/TABLE] Source: https://freestatistics.org/blog/index.php?pk=300306&T=0

Globally Unique Identifier (entire table): ba.freestatistics.org/blog/index.php?pk=300306&T=0

As an alternative you can also use a QR Code:  

The GUIDs for individual cells are displayed in the table below:

Summary of computational transaction
Raw Input view raw input (R code)
Raw Outputview raw output of R engine
Computing time2 seconds
R ServerBig Analytics Cloud Computing Center


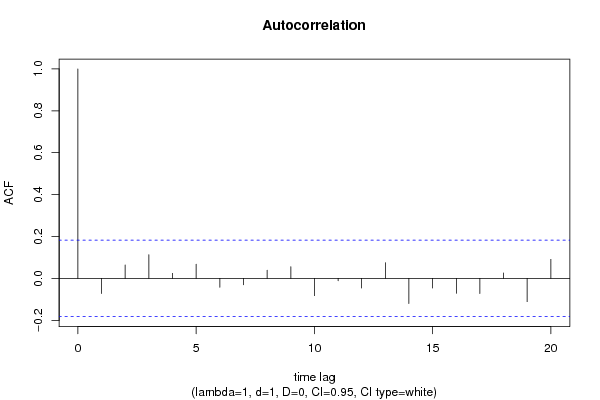
Autocorrelation Function
Time lag kACF(k)T-STATP-value
1-0.072223-0.77450.220111
20.0642510.6890.246101
30.1131791.21370.113672
40.0238960.25630.399107
50.0678230.72730.234253
6-0.042511-0.45590.324669
7-0.030168-0.32350.373446
80.0390050.41830.338262
90.0556690.5970.275847
10-0.082411-0.88380.189334
11-0.011212-0.12020.452255
12-0.045635-0.48940.312752
130.0748570.80280.211886
14-0.120231-1.28930.099934
15-0.045916-0.49240.31169
16-0.070701-0.75820.224947
17-0.072106-0.77320.220481
180.0256250.27480.391982
19-0.111061-1.1910.118054
200.0907040.97270.166373

\begin{tabular}{lllllllll}
\hline
Autocorrelation Function \tabularnewline
Time lag k & ACF(k) & T-STAT & P-value \tabularnewline
1 & -0.072223 & -0.7745 & 0.220111 \tabularnewline
2 & 0.064251 & 0.689 & 0.246101 \tabularnewline
3 & 0.113179 & 1.2137 & 0.113672 \tabularnewline
4 & 0.023896 & 0.2563 & 0.399107 \tabularnewline
5 & 0.067823 & 0.7273 & 0.234253 \tabularnewline
6 & -0.042511 & -0.4559 & 0.324669 \tabularnewline
7 & -0.030168 & -0.3235 & 0.373446 \tabularnewline
8 & 0.039005 & 0.4183 & 0.338262 \tabularnewline
9 & 0.055669 & 0.597 & 0.275847 \tabularnewline
10 & -0.082411 & -0.8838 & 0.189334 \tabularnewline
11 & -0.011212 & -0.1202 & 0.452255 \tabularnewline
12 & -0.045635 & -0.4894 & 0.312752 \tabularnewline
13 & 0.074857 & 0.8028 & 0.211886 \tabularnewline
14 & -0.120231 & -1.2893 & 0.099934 \tabularnewline
15 & -0.045916 & -0.4924 & 0.31169 \tabularnewline
16 & -0.070701 & -0.7582 & 0.224947 \tabularnewline
17 & -0.072106 & -0.7732 & 0.220481 \tabularnewline
18 & 0.025625 & 0.2748 & 0.391982 \tabularnewline
19 & -0.111061 & -1.191 & 0.118054 \tabularnewline
20 & 0.090704 & 0.9727 & 0.166373 \tabularnewline
\hline
\end{tabular}
%Source: https://freestatistics.org/blog/index.php?pk=300306&T=1

[TABLE]
[ROW][C]Autocorrelation Function[/C][/ROW]
[ROW][C]Time lag k[/C][C]ACF(k)[/C][C]T-STAT[/C][C]P-value[/C][/ROW]
[ROW][C]1[/C][C]-0.072223[/C][C]-0.7745[/C][C]0.220111[/C][/ROW]
[ROW][C]2[/C][C]0.064251[/C][C]0.689[/C][C]0.246101[/C][/ROW]
[ROW][C]3[/C][C]0.113179[/C][C]1.2137[/C][C]0.113672[/C][/ROW]
[ROW][C]4[/C][C]0.023896[/C][C]0.2563[/C][C]0.399107[/C][/ROW]
[ROW][C]5[/C][C]0.067823[/C][C]0.7273[/C][C]0.234253[/C][/ROW]
[ROW][C]6[/C][C]-0.042511[/C][C]-0.4559[/C][C]0.324669[/C][/ROW]
[ROW][C]7[/C][C]-0.030168[/C][C]-0.3235[/C][C]0.373446[/C][/ROW]
[ROW][C]8[/C][C]0.039005[/C][C]0.4183[/C][C]0.338262[/C][/ROW]
[ROW][C]9[/C][C]0.055669[/C][C]0.597[/C][C]0.275847[/C][/ROW]
[ROW][C]10[/C][C]-0.082411[/C][C]-0.8838[/C][C]0.189334[/C][/ROW]
[ROW][C]11[/C][C]-0.011212[/C][C]-0.1202[/C][C]0.452255[/C][/ROW]
[ROW][C]12[/C][C]-0.045635[/C][C]-0.4894[/C][C]0.312752[/C][/ROW]
[ROW][C]13[/C][C]0.074857[/C][C]0.8028[/C][C]0.211886[/C][/ROW]
[ROW][C]14[/C][C]-0.120231[/C][C]-1.2893[/C][C]0.099934[/C][/ROW]
[ROW][C]15[/C][C]-0.045916[/C][C]-0.4924[/C][C]0.31169[/C][/ROW]
[ROW][C]16[/C][C]-0.070701[/C][C]-0.7582[/C][C]0.224947[/C][/ROW]
[ROW][C]17[/C][C]-0.072106[/C][C]-0.7732[/C][C]0.220481[/C][/ROW]
[ROW][C]18[/C][C]0.025625[/C][C]0.2748[/C][C]0.391982[/C][/ROW]
[ROW][C]19[/C][C]-0.111061[/C][C]-1.191[/C][C]0.118054[/C][/ROW]
[ROW][C]20[/C][C]0.090704[/C][C]0.9727[/C][C]0.166373[/C][/ROW]
[/TABLE]
Source: https://freestatistics.org/blog/index.php?pk=300306&T=1

Globally Unique Identifier (entire table): ba.freestatistics.org/blog/index.php?pk=300306&T=1

As an alternative you can also use a QR Code:  

The GUIDs for individual cells are displayed in the table below:

Autocorrelation Function
Time lag kACF(k)T-STATP-value
1-0.072223-0.77450.220111
20.0642510.6890.246101
30.1131791.21370.113672
40.0238960.25630.399107
50.0678230.72730.234253
6-0.042511-0.45590.324669
7-0.030168-0.32350.373446
80.0390050.41830.338262
90.0556690.5970.275847
10-0.082411-0.88380.189334
11-0.011212-0.12020.452255
12-0.045635-0.48940.312752
130.0748570.80280.211886
14-0.120231-1.28930.099934
15-0.045916-0.49240.31169
16-0.070701-0.75820.224947
17-0.072106-0.77320.220481
180.0256250.27480.391982
19-0.111061-1.1910.118054
200.0907040.97270.166373


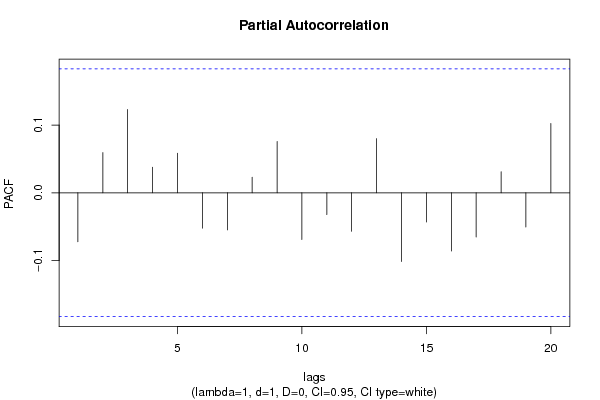
Partial Autocorrelation Function
Time lag kPACF(k)T-STATP-value
1-0.072223-0.77450.220111
20.0593440.63640.262891
30.1229021.3180.095065
40.0378330.40570.342852
50.0584810.62710.265907
6-0.052113-0.55890.288674
7-0.054762-0.58730.279092
80.0230320.2470.402678
90.0756960.81170.209306
10-0.068883-0.73870.230801
11-0.032174-0.3450.365353
12-0.056749-0.60860.272008
130.0799630.85750.196474
14-0.101458-1.0880.139431
15-0.043006-0.46120.322768
16-0.085864-0.92080.179545
17-0.065271-0.69990.242686
180.0311490.3340.369482
19-0.050562-0.54220.294358
200.1023161.09720.137419

\begin{tabular}{lllllllll}
\hline
Partial Autocorrelation Function \tabularnewline
Time lag k & PACF(k) & T-STAT & P-value \tabularnewline
1 & -0.072223 & -0.7745 & 0.220111 \tabularnewline
2 & 0.059344 & 0.6364 & 0.262891 \tabularnewline
3 & 0.122902 & 1.318 & 0.095065 \tabularnewline
4 & 0.037833 & 0.4057 & 0.342852 \tabularnewline
5 & 0.058481 & 0.6271 & 0.265907 \tabularnewline
6 & -0.052113 & -0.5589 & 0.288674 \tabularnewline
7 & -0.054762 & -0.5873 & 0.279092 \tabularnewline
8 & 0.023032 & 0.247 & 0.402678 \tabularnewline
9 & 0.075696 & 0.8117 & 0.209306 \tabularnewline
10 & -0.068883 & -0.7387 & 0.230801 \tabularnewline
11 & -0.032174 & -0.345 & 0.365353 \tabularnewline
12 & -0.056749 & -0.6086 & 0.272008 \tabularnewline
13 & 0.079963 & 0.8575 & 0.196474 \tabularnewline
14 & -0.101458 & -1.088 & 0.139431 \tabularnewline
15 & -0.043006 & -0.4612 & 0.322768 \tabularnewline
16 & -0.085864 & -0.9208 & 0.179545 \tabularnewline
17 & -0.065271 & -0.6999 & 0.242686 \tabularnewline
18 & 0.031149 & 0.334 & 0.369482 \tabularnewline
19 & -0.050562 & -0.5422 & 0.294358 \tabularnewline
20 & 0.102316 & 1.0972 & 0.137419 \tabularnewline
\hline
\end{tabular}
%Source: https://freestatistics.org/blog/index.php?pk=300306&T=2

[TABLE]
[ROW][C]Partial Autocorrelation Function[/C][/ROW]
[ROW][C]Time lag k[/C][C]PACF(k)[/C][C]T-STAT[/C][C]P-value[/C][/ROW]
[ROW][C]1[/C][C]-0.072223[/C][C]-0.7745[/C][C]0.220111[/C][/ROW]
[ROW][C]2[/C][C]0.059344[/C][C]0.6364[/C][C]0.262891[/C][/ROW]
[ROW][C]3[/C][C]0.122902[/C][C]1.318[/C][C]0.095065[/C][/ROW]
[ROW][C]4[/C][C]0.037833[/C][C]0.4057[/C][C]0.342852[/C][/ROW]
[ROW][C]5[/C][C]0.058481[/C][C]0.6271[/C][C]0.265907[/C][/ROW]
[ROW][C]6[/C][C]-0.052113[/C][C]-0.5589[/C][C]0.288674[/C][/ROW]
[ROW][C]7[/C][C]-0.054762[/C][C]-0.5873[/C][C]0.279092[/C][/ROW]
[ROW][C]8[/C][C]0.023032[/C][C]0.247[/C][C]0.402678[/C][/ROW]
[ROW][C]9[/C][C]0.075696[/C][C]0.8117[/C][C]0.209306[/C][/ROW]
[ROW][C]10[/C][C]-0.068883[/C][C]-0.7387[/C][C]0.230801[/C][/ROW]
[ROW][C]11[/C][C]-0.032174[/C][C]-0.345[/C][C]0.365353[/C][/ROW]
[ROW][C]12[/C][C]-0.056749[/C][C]-0.6086[/C][C]0.272008[/C][/ROW]
[ROW][C]13[/C][C]0.079963[/C][C]0.8575[/C][C]0.196474[/C][/ROW]
[ROW][C]14[/C][C]-0.101458[/C][C]-1.088[/C][C]0.139431[/C][/ROW]
[ROW][C]15[/C][C]-0.043006[/C][C]-0.4612[/C][C]0.322768[/C][/ROW]
[ROW][C]16[/C][C]-0.085864[/C][C]-0.9208[/C][C]0.179545[/C][/ROW]
[ROW][C]17[/C][C]-0.065271[/C][C]-0.6999[/C][C]0.242686[/C][/ROW]
[ROW][C]18[/C][C]0.031149[/C][C]0.334[/C][C]0.369482[/C][/ROW]
[ROW][C]19[/C][C]-0.050562[/C][C]-0.5422[/C][C]0.294358[/C][/ROW]
[ROW][C]20[/C][C]0.102316[/C][C]1.0972[/C][C]0.137419[/C][/ROW]
[/TABLE]
Source: https://freestatistics.org/blog/index.php?pk=300306&T=2

Globally Unique Identifier (entire table): ba.freestatistics.org/blog/index.php?pk=300306&T=2

As an alternative you can also use a QR Code:  

The GUIDs for individual cells are displayed in the table below:

Partial Autocorrelation Function
Time lag kPACF(k)T-STATP-value
1-0.072223-0.77450.220111
20.0593440.63640.262891
30.1229021.3180.095065
40.0378330.40570.342852
50.0584810.62710.265907
6-0.052113-0.55890.288674
7-0.054762-0.58730.279092
80.0230320.2470.402678
90.0756960.81170.209306
10-0.068883-0.73870.230801
11-0.032174-0.3450.365353
12-0.056749-0.60860.272008
130.0799630.85750.196474
14-0.101458-1.0880.139431
15-0.043006-0.46120.322768
16-0.085864-0.92080.179545
17-0.065271-0.69990.242686
180.0311490.3340.369482
19-0.050562-0.54220.294358
200.1023161.09720.137419


Parameters (Session):
par1 = FALSE ; par2 = 1 ; par3 = 2 ; par4 = 0 ; par5 = 1 ; par6 = 3 ; par7 = 1 ; par8 = 2 ; par9 = 0 ;
Parameters (R input):
par1 = Default ; par2 = 1 ; par3 = 1 ; par4 = 0 ; par5 = 12 ; par6 = White Noise ; par7 = 0.95 ; par8 = ;
R code (references can be found in the software module):
par8 <- ''
par7 <- '0.95'
par6 <- 'White Noise'
par5 <- '12'
par4 <- '0'
par3 <- '0'
par2 <- '1'
par1 <- 'Default'
if (par1 == 'Default') {
par1 = 10*log10(length(x))
} else {
par1 <- as.numeric(par1)
}
par2 <- as.numeric(par2)
par3 <- as.numeric(par3)
par4 <- as.numeric(par4)
par5 <- as.numeric(par5)
if (par6 == 'White Noise') par6 <- 'white' else par6 <- 'ma'
par7 <- as.numeric(par7)
if (par8 != '') par8 <- as.numeric(par8)
x <- na.omit(x)
ox <- x
if (par8 == '') {
if (par2 == 0) {
x <- log(x)
} else {
x <- (x ^ par2 - 1) / par2
}
} else {
x <- log(x,base=par8)
}
if (par3 > 0) x <- diff(x,lag=1,difference=par3)
if (par4 > 0) x <- diff(x,lag=par5,difference=par4)
bitmap(file='picts.png')
op <- par(mfrow=c(2,1))
plot(ox,type='l',main='Original Time Series',xlab='time',ylab='value')
if (par8=='') {
mytitle <- paste('Working Time Series (lambda=',par2,', d=',par3,', D=',par4,')',sep='')
mysub <- paste('(lambda=',par2,', d=',par3,', D=',par4,', CI=', par7, ', CI type=',par6,')',sep='')
} else {
mytitle <- paste('Working Time Series (base=',par8,', d=',par3,', D=',par4,')',sep='')
mysub <- paste('(base=',par8,', d=',par3,', D=',par4,', CI=', par7, ', CI type=',par6,')',sep='')
}
plot(x,type='l', main=mytitle,xlab='time',ylab='value')
par(op)
dev.off()
bitmap(file='pic1.png')
racf <- acf(x, par1, main='Autocorrelation', xlab='time lag', ylab='ACF', ci.type=par6, ci=par7, sub=mysub)
dev.off()
bitmap(file='pic2.png')
rpacf <- pacf(x,par1,main='Partial Autocorrelation',xlab='lags',ylab='PACF',sub=mysub)
dev.off()
(myacf <- c(racf$acf))
(mypacf <- c(rpacf$acf))
lengthx <- length(x)
sqrtn <- sqrt(lengthx)
load(file='createtable')
a<-table.start()
a<-table.row.start(a)
a<-table.element(a,'Autocorrelation Function',4,TRUE)
a<-table.row.end(a)
a<-table.row.start(a)
a<-table.element(a,'Time lag k',header=TRUE)
a<-table.element(a,'ACF(k)',header=TRUE)
a<-table.element(a,'T-STAT',header=TRUE)
a<-table.element(a,'P-value',header=TRUE)
a<-table.row.end(a)
for (i in 2:(par1+1)) {
a<-table.row.start(a)
a<-table.element(a,i-1,header=TRUE)
a<-table.element(a,round(myacf[i],6))
mytstat <- myacf[i]*sqrtn
a<-table.element(a,round(mytstat,4))
a<-table.element(a,round(1-pt(abs(mytstat),lengthx),6))
a<-table.row.end(a)
}
a<-table.end(a)
table.save(a,file='mytable.tab')
a<-table.start()
a<-table.row.start(a)
a<-table.element(a,'Partial Autocorrelation Function',4,TRUE)
a<-table.row.end(a)
a<-table.row.start(a)
a<-table.element(a,'Time lag k',header=TRUE)
a<-table.element(a,'PACF(k)',header=TRUE)
a<-table.element(a,'T-STAT',header=TRUE)
a<-table.element(a,'P-value',header=TRUE)
a<-table.row.end(a)
for (i in 1:par1) {
a<-table.row.start(a)
a<-table.element(a,i,header=TRUE)
a<-table.element(a,round(mypacf[i],6))
mytstat <- mypacf[i]*sqrtn
a<-table.element(a,round(mytstat,4))
a<-table.element(a,round(1-pt(abs(mytstat),lengthx),6))
a<-table.row.end(a)
}
a<-table.end(a)
table.save(a,file='mytable1.tab')