Free Statistics

of Irreproducible Research!

Author's title

Author*The author of this computation has been verified*
R Software Modulerwasp_arimabackwardselection.wasp
Title produced by softwareARIMA Backward Selection
Date of computationFri, 16 Dec 2016 15:29:45 +0100
Cite this page as followsStatistical Computations at FreeStatistics.org, Office for Research Development and Education, URL https://freestatistics.org/blog/index.php?v=date/2016/Dec/16/t1481898850cm781p9nnswa8ol.htm/, Retrieved Thu, 02 May 2024 15:50:27 +0000
Statistical Computations at FreeStatistics.org, Office for Research Development and Education, URL https://freestatistics.org/blog/index.php?pk=300314, Retrieved Thu, 02 May 2024 15:50:27 +0000
QR Codes:

Original text written by user:
IsPrivate?No (this computation is public)
User-defined keywords
Estimated Impact67
Family? (F = Feedback message, R = changed R code, M = changed R Module, P = changed Parameters, D = changed Data)
-       [ARIMA Backward Selection] [] [2016-12-16 14:29:45] [9b171b8beffcb53bb49a1e7c02b89c12] [Current]
Feedback Forum

Post a new message
Dataseries X:
2669.94
2778.72
2648.44
2631.32
3057.32
2730.66
2730.62
2738.7
2616.36
2773.54
2872.76
2999.42
2730.62
2907.22
2778.04
2833.94
2914.44
2788.86
2742.8
2726.52
2746.44
2927.42
2879.56
3262.02
2883.14
2903.2
2877.7
2874.3
3026.66
2979.42
3109.68
2966.76
2961.04
3103.84
3359.12
3976.24
3049.42
3089.14
3166.26
3459.04
3457.32
3292.66
3432.86
3388.4
3312.9
3390.04
3757.44
4612.38
3613.34
3525.14
3473.06
3662.22
3717.4
3466.9
3443.4
3383.16
3843.64
3692.4
3558.38
3811.02
3470.54
3354.68
3499.96
3537.36
3414.98
3649
3549.72
3680.78
3484.64
3451.92
3831.14
3906.02
3499.54
3620.62
3473.64
3494.32
3799.66
3476.4
3446.86
3441.94
3514.68
3464.96
3579.48
3944.24
3702.42
3716.28
3538.36
3482.58
3665.5
3484.5
3425.08
3421.44
3602.34
3593.44
3478.5
4365.26
3445.2
3473.48
3472.32
3403.82
3575.4
3512.96
3433.04
3495.2
3478.96
3559.28
3887.1
4083.16
3659.52
3693.48
3779.52
3891.62
3895.86
3745.04
3884.46
3862.98


Summary of computational transaction
Raw Input view raw input (R code)
Raw Outputview raw output of R engine
Computing time3 seconds
R ServerBig Analytics Cloud Computing Center

\begin{tabular}{lllllllll}
\hline
Summary of computational transaction \tabularnewline
Raw Input view raw input (R code)  \tabularnewline
Raw Outputview raw output of R engine  \tabularnewline
Computing time3 seconds \tabularnewline
R ServerBig Analytics Cloud Computing Center \tabularnewline
\hline
\end{tabular}
%Source: https://freestatistics.org/blog/index.php?pk=300314&T=0

[TABLE]
[ROW]
Summary of computational transaction[/C][/ROW] [ROW]Raw Input[/C] view raw input (R code) [/C][/ROW] [ROW]Raw Output[/C]view raw output of R engine [/C][/ROW] [ROW]Computing time[/C]3 seconds[/C][/ROW] [ROW]R Server[/C]Big Analytics Cloud Computing Center[/C][/ROW] [/TABLE] Source: https://freestatistics.org/blog/index.php?pk=300314&T=0

Globally Unique Identifier (entire table): ba.freestatistics.org/blog/index.php?pk=300314&T=0

As an alternative you can also use a QR Code:  

The GUIDs for individual cells are displayed in the table below:

Summary of computational transaction
Raw Input view raw input (R code)
Raw Outputview raw output of R engine
Computing time3 seconds
R ServerBig Analytics Cloud Computing Center


ARIMA Parameter Estimation and Backward Selection
Iterationar1ar2ar3ma1
Estimates ( 1 )-0.106-0.2573-0.1355-0.538
(p-val)(0.6026 )(0.0568 )(0.311 )(0.0053 )
Estimates ( 2 )0-0.2131-0.0855-0.6204
(p-val)(NA )(0.0446 )(0.3921 )(0 )
Estimates ( 3 )0-0.20010-0.6449
(p-val)(NA )(0.0603 )(NA )(0 )
Estimates ( 4 )000-1.3921
(p-val)(NA )(NA )(NA )(0 )
Estimates ( 5 )NANANANA
(p-val)(NA )(NA )(NA )(NA )
Estimates ( 6 )NANANANA
(p-val)(NA )(NA )(NA )(NA )
Estimates ( 7 )NANANANA
(p-val)(NA )(NA )(NA )(NA )

\begin{tabular}{lllllllll}
\hline
ARIMA Parameter Estimation and Backward Selection \tabularnewline
Iteration & ar1 & ar2 & ar3 & ma1 \tabularnewline
Estimates ( 1 ) & -0.106 & -0.2573 & -0.1355 & -0.538 \tabularnewline
(p-val) & (0.6026 ) & (0.0568 ) & (0.311 ) & (0.0053 ) \tabularnewline
Estimates ( 2 ) & 0 & -0.2131 & -0.0855 & -0.6204 \tabularnewline
(p-val) & (NA ) & (0.0446 ) & (0.3921 ) & (0 ) \tabularnewline
Estimates ( 3 ) & 0 & -0.2001 & 0 & -0.6449 \tabularnewline
(p-val) & (NA ) & (0.0603 ) & (NA ) & (0 ) \tabularnewline
Estimates ( 4 ) & 0 & 0 & 0 & -1.3921 \tabularnewline
(p-val) & (NA ) & (NA ) & (NA ) & (0 ) \tabularnewline
Estimates ( 5 ) & NA & NA & NA & NA \tabularnewline
(p-val) & (NA ) & (NA ) & (NA ) & (NA ) \tabularnewline
Estimates ( 6 ) & NA & NA & NA & NA \tabularnewline
(p-val) & (NA ) & (NA ) & (NA ) & (NA ) \tabularnewline
Estimates ( 7 ) & NA & NA & NA & NA \tabularnewline
(p-val) & (NA ) & (NA ) & (NA ) & (NA ) \tabularnewline
\hline
\end{tabular}
%Source: https://freestatistics.org/blog/index.php?pk=300314&T=1

[TABLE]
[ROW][C]ARIMA Parameter Estimation and Backward Selection[/C][/ROW]
[ROW][C]Iteration[/C][C]ar1[/C][C]ar2[/C][C]ar3[/C][C]ma1[/C][/ROW]
[ROW][C]Estimates ( 1 )[/C][C]-0.106[/C][C]-0.2573[/C][C]-0.1355[/C][C]-0.538[/C][/ROW]
[ROW][C](p-val)[/C][C](0.6026 )[/C][C](0.0568 )[/C][C](0.311 )[/C][C](0.0053 )[/C][/ROW]
[ROW][C]Estimates ( 2 )[/C][C]0[/C][C]-0.2131[/C][C]-0.0855[/C][C]-0.6204[/C][/ROW]
[ROW][C](p-val)[/C][C](NA )[/C][C](0.0446 )[/C][C](0.3921 )[/C][C](0 )[/C][/ROW]
[ROW][C]Estimates ( 3 )[/C][C]0[/C][C]-0.2001[/C][C]0[/C][C]-0.6449[/C][/ROW]
[ROW][C](p-val)[/C][C](NA )[/C][C](0.0603 )[/C][C](NA )[/C][C](0 )[/C][/ROW]
[ROW][C]Estimates ( 4 )[/C][C]0[/C][C]0[/C][C]0[/C][C]-1.3921[/C][/ROW]
[ROW][C](p-val)[/C][C](NA )[/C][C](NA )[/C][C](NA )[/C][C](0 )[/C][/ROW]
[ROW][C]Estimates ( 5 )[/C][C]NA[/C][C]NA[/C][C]NA[/C][C]NA[/C][/ROW]
[ROW][C](p-val)[/C][C](NA )[/C][C](NA )[/C][C](NA )[/C][C](NA )[/C][/ROW]
[ROW][C]Estimates ( 6 )[/C][C]NA[/C][C]NA[/C][C]NA[/C][C]NA[/C][/ROW]
[ROW][C](p-val)[/C][C](NA )[/C][C](NA )[/C][C](NA )[/C][C](NA )[/C][/ROW]
[ROW][C]Estimates ( 7 )[/C][C]NA[/C][C]NA[/C][C]NA[/C][C]NA[/C][/ROW]
[ROW][C](p-val)[/C][C](NA )[/C][C](NA )[/C][C](NA )[/C][C](NA )[/C][/ROW]
[/TABLE]
Source: https://freestatistics.org/blog/index.php?pk=300314&T=1

Globally Unique Identifier (entire table): ba.freestatistics.org/blog/index.php?pk=300314&T=1

As an alternative you can also use a QR Code:  

The GUIDs for individual cells are displayed in the table below:

ARIMA Parameter Estimation and Backward Selection
Iterationar1ar2ar3ma1
Estimates ( 1 )-0.106-0.2573-0.1355-0.538
(p-val)(0.6026 )(0.0568 )(0.311 )(0.0053 )
Estimates ( 2 )0-0.2131-0.0855-0.6204
(p-val)(NA )(0.0446 )(0.3921 )(0 )
Estimates ( 3 )0-0.20010-0.6449
(p-val)(NA )(0.0603 )(NA )(0 )
Estimates ( 4 )000-1.3921
(p-val)(NA )(NA )(NA )(0 )
Estimates ( 5 )NANANANA
(p-val)(NA )(NA )(NA )(NA )
Estimates ( 6 )NANANANA
(p-val)(NA )(NA )(NA )(NA )
Estimates ( 7 )NANANANA
(p-val)(NA )(NA )(NA )(NA )


Estimated ARIMA Residuals
Value
-9.56885309325788
55.8210026471968
22.8069897614696
95.3593170699496
-281.561252590192
36.90489275821
-91.2432725605946
-42.7608584106892
105.455654423521
86.8885848287309
-62.5871039905745
220.191899095365
2.50157779786084
-103.75041024408
14.7443850741997
-81.1081745177341
40.2920789816482
92.4625151428086
250.329556635447
50.4814700006688
42.1925063406927
-36.3038936695002
274.596434016039
404.1211685019
-226.657729245189
-79.5753744573665
-58.3231322258994
262.498007672676
35.7469420299216
-35.1111361572163
-43.530136999888
46.8943095814215
-37.5471601497738
-70.1778341789019
52.8989258973633
258.800873803388
117.12307480946
-4.80359518163184
-146.746457950733
-223.855143722266
-113.322055312034
-179.65677226961
-268.185201594503
-205.917843786544
370.424405827145
7.36627224878793
-389.440470615099
-899.15747359663
-21.6613759480933
-162.127125006342
224.549148110105
-12.4719178042774
-146.119658742767
359.919652968698
120.82542059106
366.159260113053
-435.628170257201
-124.1643848933
301.796795685024
40.5934544926272
62.8598354413293
241.918271582112
-149.440133246571
-65.698160876867
326.878497223535
-349.806485394814
-70.2957291097391
-292.806844402801
93.9880491314838
16.4127944579054
-200.322256122914
157.282197919773
213.142165252759
88.2385778022144
58.9110409958003
-59.916179706614
-167.252506053634
19.0947292378914
-42.0564236335977
2.61661204997472
103.86974741223
108.066314831907
-138.124612464654
441.083761438255
-439.671388354014
-164.711865999194
-65.1594035749886
-51.8593284893668
-9.42361458996448
109.937514444894
48.1349189061721
120.563589356549
-123.484409750188
22.7434053257011
417.988212974113
-403.271300941336
324.911342072794
77.0476996705174
236.205779521894
334.075997676303
65.5658424382837
-9.96264588612712
179.436438201009
14.4051782256315

\begin{tabular}{lllllllll}
\hline
Estimated ARIMA Residuals \tabularnewline
Value \tabularnewline
-9.56885309325788 \tabularnewline
55.8210026471968 \tabularnewline
22.8069897614696 \tabularnewline
95.3593170699496 \tabularnewline
-281.561252590192 \tabularnewline
36.90489275821 \tabularnewline
-91.2432725605946 \tabularnewline
-42.7608584106892 \tabularnewline
105.455654423521 \tabularnewline
86.8885848287309 \tabularnewline
-62.5871039905745 \tabularnewline
220.191899095365 \tabularnewline
2.50157779786084 \tabularnewline
-103.75041024408 \tabularnewline
14.7443850741997 \tabularnewline
-81.1081745177341 \tabularnewline
40.2920789816482 \tabularnewline
92.4625151428086 \tabularnewline
250.329556635447 \tabularnewline
50.4814700006688 \tabularnewline
42.1925063406927 \tabularnewline
-36.3038936695002 \tabularnewline
274.596434016039 \tabularnewline
404.1211685019 \tabularnewline
-226.657729245189 \tabularnewline
-79.5753744573665 \tabularnewline
-58.3231322258994 \tabularnewline
262.498007672676 \tabularnewline
35.7469420299216 \tabularnewline
-35.1111361572163 \tabularnewline
-43.530136999888 \tabularnewline
46.8943095814215 \tabularnewline
-37.5471601497738 \tabularnewline
-70.1778341789019 \tabularnewline
52.8989258973633 \tabularnewline
258.800873803388 \tabularnewline
117.12307480946 \tabularnewline
-4.80359518163184 \tabularnewline
-146.746457950733 \tabularnewline
-223.855143722266 \tabularnewline
-113.322055312034 \tabularnewline
-179.65677226961 \tabularnewline
-268.185201594503 \tabularnewline
-205.917843786544 \tabularnewline
370.424405827145 \tabularnewline
7.36627224878793 \tabularnewline
-389.440470615099 \tabularnewline
-899.15747359663 \tabularnewline
-21.6613759480933 \tabularnewline
-162.127125006342 \tabularnewline
224.549148110105 \tabularnewline
-12.4719178042774 \tabularnewline
-146.119658742767 \tabularnewline
359.919652968698 \tabularnewline
120.82542059106 \tabularnewline
366.159260113053 \tabularnewline
-435.628170257201 \tabularnewline
-124.1643848933 \tabularnewline
301.796795685024 \tabularnewline
40.5934544926272 \tabularnewline
62.8598354413293 \tabularnewline
241.918271582112 \tabularnewline
-149.440133246571 \tabularnewline
-65.698160876867 \tabularnewline
326.878497223535 \tabularnewline
-349.806485394814 \tabularnewline
-70.2957291097391 \tabularnewline
-292.806844402801 \tabularnewline
93.9880491314838 \tabularnewline
16.4127944579054 \tabularnewline
-200.322256122914 \tabularnewline
157.282197919773 \tabularnewline
213.142165252759 \tabularnewline
88.2385778022144 \tabularnewline
58.9110409958003 \tabularnewline
-59.916179706614 \tabularnewline
-167.252506053634 \tabularnewline
19.0947292378914 \tabularnewline
-42.0564236335977 \tabularnewline
2.61661204997472 \tabularnewline
103.86974741223 \tabularnewline
108.066314831907 \tabularnewline
-138.124612464654 \tabularnewline
441.083761438255 \tabularnewline
-439.671388354014 \tabularnewline
-164.711865999194 \tabularnewline
-65.1594035749886 \tabularnewline
-51.8593284893668 \tabularnewline
-9.42361458996448 \tabularnewline
109.937514444894 \tabularnewline
48.1349189061721 \tabularnewline
120.563589356549 \tabularnewline
-123.484409750188 \tabularnewline
22.7434053257011 \tabularnewline
417.988212974113 \tabularnewline
-403.271300941336 \tabularnewline
324.911342072794 \tabularnewline
77.0476996705174 \tabularnewline
236.205779521894 \tabularnewline
334.075997676303 \tabularnewline
65.5658424382837 \tabularnewline
-9.96264588612712 \tabularnewline
179.436438201009 \tabularnewline
14.4051782256315 \tabularnewline
\hline
\end{tabular}
%Source: https://freestatistics.org/blog/index.php?pk=300314&T=2

[TABLE]
[ROW][C]Estimated ARIMA Residuals[/C][/ROW]
[ROW][C]Value[/C][/ROW]
[ROW][C]-9.56885309325788[/C][/ROW]
[ROW][C]55.8210026471968[/C][/ROW]
[ROW][C]22.8069897614696[/C][/ROW]
[ROW][C]95.3593170699496[/C][/ROW]
[ROW][C]-281.561252590192[/C][/ROW]
[ROW][C]36.90489275821[/C][/ROW]
[ROW][C]-91.2432725605946[/C][/ROW]
[ROW][C]-42.7608584106892[/C][/ROW]
[ROW][C]105.455654423521[/C][/ROW]
[ROW][C]86.8885848287309[/C][/ROW]
[ROW][C]-62.5871039905745[/C][/ROW]
[ROW][C]220.191899095365[/C][/ROW]
[ROW][C]2.50157779786084[/C][/ROW]
[ROW][C]-103.75041024408[/C][/ROW]
[ROW][C]14.7443850741997[/C][/ROW]
[ROW][C]-81.1081745177341[/C][/ROW]
[ROW][C]40.2920789816482[/C][/ROW]
[ROW][C]92.4625151428086[/C][/ROW]
[ROW][C]250.329556635447[/C][/ROW]
[ROW][C]50.4814700006688[/C][/ROW]
[ROW][C]42.1925063406927[/C][/ROW]
[ROW][C]-36.3038936695002[/C][/ROW]
[ROW][C]274.596434016039[/C][/ROW]
[ROW][C]404.1211685019[/C][/ROW]
[ROW][C]-226.657729245189[/C][/ROW]
[ROW][C]-79.5753744573665[/C][/ROW]
[ROW][C]-58.3231322258994[/C][/ROW]
[ROW][C]262.498007672676[/C][/ROW]
[ROW][C]35.7469420299216[/C][/ROW]
[ROW][C]-35.1111361572163[/C][/ROW]
[ROW][C]-43.530136999888[/C][/ROW]
[ROW][C]46.8943095814215[/C][/ROW]
[ROW][C]-37.5471601497738[/C][/ROW]
[ROW][C]-70.1778341789019[/C][/ROW]
[ROW][C]52.8989258973633[/C][/ROW]
[ROW][C]258.800873803388[/C][/ROW]
[ROW][C]117.12307480946[/C][/ROW]
[ROW][C]-4.80359518163184[/C][/ROW]
[ROW][C]-146.746457950733[/C][/ROW]
[ROW][C]-223.855143722266[/C][/ROW]
[ROW][C]-113.322055312034[/C][/ROW]
[ROW][C]-179.65677226961[/C][/ROW]
[ROW][C]-268.185201594503[/C][/ROW]
[ROW][C]-205.917843786544[/C][/ROW]
[ROW][C]370.424405827145[/C][/ROW]
[ROW][C]7.36627224878793[/C][/ROW]
[ROW][C]-389.440470615099[/C][/ROW]
[ROW][C]-899.15747359663[/C][/ROW]
[ROW][C]-21.6613759480933[/C][/ROW]
[ROW][C]-162.127125006342[/C][/ROW]
[ROW][C]224.549148110105[/C][/ROW]
[ROW][C]-12.4719178042774[/C][/ROW]
[ROW][C]-146.119658742767[/C][/ROW]
[ROW][C]359.919652968698[/C][/ROW]
[ROW][C]120.82542059106[/C][/ROW]
[ROW][C]366.159260113053[/C][/ROW]
[ROW][C]-435.628170257201[/C][/ROW]
[ROW][C]-124.1643848933[/C][/ROW]
[ROW][C]301.796795685024[/C][/ROW]
[ROW][C]40.5934544926272[/C][/ROW]
[ROW][C]62.8598354413293[/C][/ROW]
[ROW][C]241.918271582112[/C][/ROW]
[ROW][C]-149.440133246571[/C][/ROW]
[ROW][C]-65.698160876867[/C][/ROW]
[ROW][C]326.878497223535[/C][/ROW]
[ROW][C]-349.806485394814[/C][/ROW]
[ROW][C]-70.2957291097391[/C][/ROW]
[ROW][C]-292.806844402801[/C][/ROW]
[ROW][C]93.9880491314838[/C][/ROW]
[ROW][C]16.4127944579054[/C][/ROW]
[ROW][C]-200.322256122914[/C][/ROW]
[ROW][C]157.282197919773[/C][/ROW]
[ROW][C]213.142165252759[/C][/ROW]
[ROW][C]88.2385778022144[/C][/ROW]
[ROW][C]58.9110409958003[/C][/ROW]
[ROW][C]-59.916179706614[/C][/ROW]
[ROW][C]-167.252506053634[/C][/ROW]
[ROW][C]19.0947292378914[/C][/ROW]
[ROW][C]-42.0564236335977[/C][/ROW]
[ROW][C]2.61661204997472[/C][/ROW]
[ROW][C]103.86974741223[/C][/ROW]
[ROW][C]108.066314831907[/C][/ROW]
[ROW][C]-138.124612464654[/C][/ROW]
[ROW][C]441.083761438255[/C][/ROW]
[ROW][C]-439.671388354014[/C][/ROW]
[ROW][C]-164.711865999194[/C][/ROW]
[ROW][C]-65.1594035749886[/C][/ROW]
[ROW][C]-51.8593284893668[/C][/ROW]
[ROW][C]-9.42361458996448[/C][/ROW]
[ROW][C]109.937514444894[/C][/ROW]
[ROW][C]48.1349189061721[/C][/ROW]
[ROW][C]120.563589356549[/C][/ROW]
[ROW][C]-123.484409750188[/C][/ROW]
[ROW][C]22.7434053257011[/C][/ROW]
[ROW][C]417.988212974113[/C][/ROW]
[ROW][C]-403.271300941336[/C][/ROW]
[ROW][C]324.911342072794[/C][/ROW]
[ROW][C]77.0476996705174[/C][/ROW]
[ROW][C]236.205779521894[/C][/ROW]
[ROW][C]334.075997676303[/C][/ROW]
[ROW][C]65.5658424382837[/C][/ROW]
[ROW][C]-9.96264588612712[/C][/ROW]
[ROW][C]179.436438201009[/C][/ROW]
[ROW][C]14.4051782256315[/C][/ROW]
[/TABLE]
Source: https://freestatistics.org/blog/index.php?pk=300314&T=2

Globally Unique Identifier (entire table): ba.freestatistics.org/blog/index.php?pk=300314&T=2

As an alternative you can also use a QR Code:  

The GUIDs for individual cells are displayed in the table below:

Estimated ARIMA Residuals
Value
-9.56885309325788
55.8210026471968
22.8069897614696
95.3593170699496
-281.561252590192
36.90489275821
-91.2432725605946
-42.7608584106892
105.455654423521
86.8885848287309
-62.5871039905745
220.191899095365
2.50157779786084
-103.75041024408
14.7443850741997
-81.1081745177341
40.2920789816482
92.4625151428086
250.329556635447
50.4814700006688
42.1925063406927
-36.3038936695002
274.596434016039
404.1211685019
-226.657729245189
-79.5753744573665
-58.3231322258994
262.498007672676
35.7469420299216
-35.1111361572163
-43.530136999888
46.8943095814215
-37.5471601497738
-70.1778341789019
52.8989258973633
258.800873803388
117.12307480946
-4.80359518163184
-146.746457950733
-223.855143722266
-113.322055312034
-179.65677226961
-268.185201594503
-205.917843786544
370.424405827145
7.36627224878793
-389.440470615099
-899.15747359663
-21.6613759480933
-162.127125006342
224.549148110105
-12.4719178042774
-146.119658742767
359.919652968698
120.82542059106
366.159260113053
-435.628170257201
-124.1643848933
301.796795685024
40.5934544926272
62.8598354413293
241.918271582112
-149.440133246571
-65.698160876867
326.878497223535
-349.806485394814
-70.2957291097391
-292.806844402801
93.9880491314838
16.4127944579054
-200.322256122914
157.282197919773
213.142165252759
88.2385778022144
58.9110409958003
-59.916179706614
-167.252506053634
19.0947292378914
-42.0564236335977
2.61661204997472
103.86974741223
108.066314831907
-138.124612464654
441.083761438255
-439.671388354014
-164.711865999194
-65.1594035749886
-51.8593284893668
-9.42361458996448
109.937514444894
48.1349189061721
120.563589356549
-123.484409750188
22.7434053257011
417.988212974113
-403.271300941336
324.911342072794
77.0476996705174
236.205779521894
334.075997676303
65.5658424382837
-9.96264588612712
179.436438201009
14.4051782256315


Parameters (Session):
par1 = FALSE ; par2 = 1 ; par3 = 1 ; par4 = 1 ; par5 = 12 ; par6 = 3 ; par7 = 1 ; par8 = 0 ; par9 = 0 ;
Parameters (R input):
par1 = FALSE ; par2 = 1 ; par3 = 1 ; par4 = 1 ; par5 = 12 ; par6 = 3 ; par7 = 1 ; par8 = 0 ; par9 = 0 ;
R code (references can be found in the software module):
par9 <- '0'
par8 <- '0'
par7 <- '1'
par6 <- '3'
par5 <- '1'
par4 <- '1'
par3 <- '1'
par2 <- '1'
par1 <- 'FALSE'
library(lattice)
if (par1 == 'TRUE') par1 <- TRUE
if (par1 == 'FALSE') par1 <- FALSE
par2 <- as.numeric(par2) #Box-Cox lambda transformation parameter
par3 <- as.numeric(par3) #degree of non-seasonal differencing
par4 <- as.numeric(par4) #degree of seasonal differencing
par5 <- as.numeric(par5) #seasonal period
par6 <- as.numeric(par6) #degree (p) of the non-seasonal AR(p) polynomial
par7 <- as.numeric(par7) #degree (q) of the non-seasonal MA(q) polynomial
par8 <- as.numeric(par8) #degree (P) of the seasonal AR(P) polynomial
par9 <- as.numeric(par9) #degree (Q) of the seasonal MA(Q) polynomial
armaGR <- function(arima.out, names, n){
try1 <- arima.out$coef
try2 <- sqrt(diag(arima.out$var.coef))
try.data.frame <- data.frame(matrix(NA,ncol=4,nrow=length(names)))
dimnames(try.data.frame) <- list(names,c('coef','std','tstat','pv'))
try.data.frame[,1] <- try1
for(i in 1:length(try2)) try.data.frame[which(rownames(try.data.frame)==names(try2)[i]),2] <- try2[i]
try.data.frame[,3] <- try.data.frame[,1] / try.data.frame[,2]
try.data.frame[,4] <- round((1-pt(abs(try.data.frame[,3]),df=n-(length(try2)+1)))*2,5)
vector <- rep(NA,length(names))
vector[is.na(try.data.frame[,4])] <- 0
maxi <- which.max(try.data.frame[,4])
continue <- max(try.data.frame[,4],na.rm=TRUE) > .05
vector[maxi] <- 0
list(summary=try.data.frame,next.vector=vector,continue=continue)
}
arimaSelect <- function(series, order=c(13,0,0), seasonal=list(order=c(2,0,0),period=12), include.mean=F){
nrc <- order[1]+order[3]+seasonal$order[1]+seasonal$order[3]
coeff <- matrix(NA, nrow=nrc*2, ncol=nrc)
pval <- matrix(NA, nrow=nrc*2, ncol=nrc)
mylist <- rep(list(NULL), nrc)
names <- NULL
if(order[1] > 0) names <- paste('ar',1:order[1],sep='')
if(order[3] > 0) names <- c( names , paste('ma',1:order[3],sep='') )
if(seasonal$order[1] > 0) names <- c(names, paste('sar',1:seasonal$order[1],sep=''))
if(seasonal$order[3] > 0) names <- c(names, paste('sma',1:seasonal$order[3],sep=''))
arima.out <- arima(series, order=order, seasonal=seasonal, include.mean=include.mean, method='ML')
mylist[[1]] <- arima.out
last.arma <- armaGR(arima.out, names, length(series))
mystop <- FALSE
i <- 1
coeff[i,] <- last.arma[[1]][,1]
pval [i,] <- last.arma[[1]][,4]
i <- 2
aic <- arima.out$aic
while(!mystop){
mylist[[i]] <- arima.out
arima.out <- arima(series, order=order, seasonal=seasonal, include.mean=include.mean, method='ML', fixed=last.arma$next.vector)
aic <- c(aic, arima.out$aic)
last.arma <- armaGR(arima.out, names, length(series))
mystop <- !last.arma$continue
coeff[i,] <- last.arma[[1]][,1]
pval [i,] <- last.arma[[1]][,4]
i <- i+1
}
list(coeff, pval, mylist, aic=aic)
}
arimaSelectplot <- function(arimaSelect.out,noms,choix){
noms <- names(arimaSelect.out[[3]][[1]]$coef)
coeff <- arimaSelect.out[[1]]
k <- min(which(is.na(coeff[,1])))-1
coeff <- coeff[1:k,]
pval <- arimaSelect.out[[2]][1:k,]
aic <- arimaSelect.out$aic[1:k]
coeff[coeff==0] <- NA
n <- ncol(coeff)
if(missing(choix)) choix <- k
layout(matrix(c(1,1,1,2,
3,3,3,2,
3,3,3,4,
5,6,7,7),nr=4),
widths=c(10,35,45,15),
heights=c(30,30,15,15))
couleurs <- rainbow(75)[1:50]#(50)
ticks <- pretty(coeff)
par(mar=c(1,1,3,1))
plot(aic,k:1-.5,type='o',pch=21,bg='blue',cex=2,axes=F,lty=2,xpd=NA)
points(aic[choix],k-choix+.5,pch=21,cex=4,bg=2,xpd=NA)
title('aic',line=2)
par(mar=c(3,0,0,0))
plot(0,axes=F,xlab='',ylab='',xlim=range(ticks),ylim=c(.1,1))
rect(xleft = min(ticks) + (0:49)/50*(max(ticks)-min(ticks)),
xright = min(ticks) + (1:50)/50*(max(ticks)-min(ticks)),
ytop = rep(1,50),
ybottom= rep(0,50),col=couleurs,border=NA)
axis(1,ticks)
rect(xleft=min(ticks),xright=max(ticks),ytop=1,ybottom=0)
text(mean(coeff,na.rm=T),.5,'coefficients',cex=2,font=2)
par(mar=c(1,1,3,1))
image(1:n,1:k,t(coeff[k:1,]),axes=F,col=couleurs,zlim=range(ticks))
for(i in 1:n) for(j in 1:k) if(!is.na(coeff[j,i])) {
if(pval[j,i]<.01) symb = 'green'
else if( (pval[j,i]<.05) & (pval[j,i]>=.01)) symb = 'orange'
else if( (pval[j,i]<.1) & (pval[j,i]>=.05)) symb = 'red'
else symb = 'black'
polygon(c(i+.5 ,i+.2 ,i+.5 ,i+.5),
c(k-j+0.5,k-j+0.5,k-j+0.8,k-j+0.5),
col=symb)
if(j==choix) {
rect(xleft=i-.5,
xright=i+.5,
ybottom=k-j+1.5,
ytop=k-j+.5,
lwd=4)
text(i,
k-j+1,
round(coeff[j,i],2),
cex=1.2,
font=2)
}
else{
rect(xleft=i-.5,xright=i+.5,ybottom=k-j+1.5,ytop=k-j+.5)
text(i,k-j+1,round(coeff[j,i],2),cex=1.2,font=1)
}
}
axis(3,1:n,noms)
par(mar=c(0.5,0,0,0.5))
plot(0,axes=F,xlab='',ylab='',type='n',xlim=c(0,8),ylim=c(-.2,.8))
cols <- c('green','orange','red','black')
niv <- c('0','0.01','0.05','0.1')
for(i in 0:3){
polygon(c(1+2*i ,1+2*i ,1+2*i-.5 ,1+2*i),
c(.4 ,.7 , .4 , .4),
col=cols[i+1])
text(2*i,0.5,niv[i+1],cex=1.5)
}
text(8,.5,1,cex=1.5)
text(4,0,'p-value',cex=2)
box()
residus <- arimaSelect.out[[3]][[choix]]$res
par(mar=c(1,2,4,1))
acf(residus,main='')
title('acf',line=.5)
par(mar=c(1,2,4,1))
pacf(residus,main='')
title('pacf',line=.5)
par(mar=c(2,2,4,1))
qqnorm(residus,main='')
title('qq-norm',line=.5)
qqline(residus)
residus
}
if (par2 == 0) x <- log(x)
if (par2 != 0) x <- x^par2
(selection <- arimaSelect(x, order=c(par6,par3,par7), seasonal=list(order=c(par8,par4,par9), period=par5)))
bitmap(file='test1.png')
resid <- arimaSelectplot(selection)
dev.off()
resid
bitmap(file='test2.png')
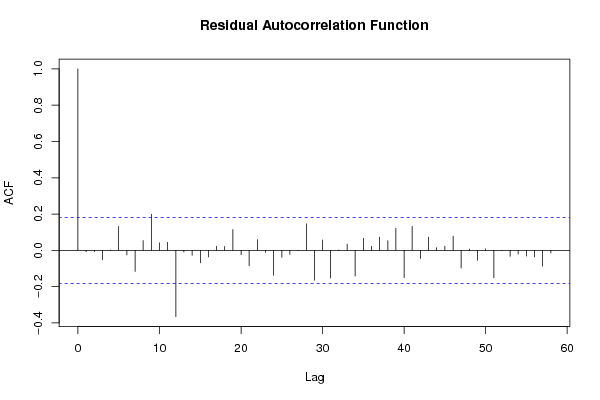
acf(resid,length(resid)/2, main='Residual Autocorrelation Function')
dev.off()
bitmap(file='test3.png')
pacf(resid,length(resid)/2, main='Residual Partial Autocorrelation Function')
dev.off()
bitmap(file='test4.png')
cpgram(resid, main='Residual Cumulative Periodogram')
dev.off()
bitmap(file='test5.png')
hist(resid, main='Residual Histogram', xlab='values of Residuals')
dev.off()
bitmap(file='test6.png')
densityplot(~resid,col='black',main='Residual Density Plot', xlab='values of Residuals')
dev.off()
bitmap(file='test7.png')
qqnorm(resid, main='Residual Normal Q-Q Plot')
qqline(resid)
dev.off()
ncols <- length(selection[[1]][1,])
nrows <- length(selection[[2]][,1])-1
load(file='createtable')
a<-table.start()
a<-table.row.start(a)
a<-table.element(a,'ARIMA Parameter Estimation and Backward Selection', ncols+1,TRUE)
a<-table.row.end(a)
a<-table.row.start(a)
a<-table.element(a,'Iteration', header=TRUE)
for (i in 1:ncols) {
a<-table.element(a,names(selection[[3]][[1]]$coef)[i],header=TRUE)
}
a<-table.row.end(a)
for (j in 1:nrows) {
a<-table.row.start(a)
mydum <- 'Estimates ('
mydum <- paste(mydum,j)
mydum <- paste(mydum,')')
a<-table.element(a,mydum, header=TRUE)
for (i in 1:ncols) {
a<-table.element(a,round(selection[[1]][j,i],4))
}
a<-table.row.end(a)
a<-table.row.start(a)
a<-table.element(a,'(p-val)', header=TRUE)
for (i in 1:ncols) {
mydum <- '('
mydum <- paste(mydum,round(selection[[2]][j,i],4),sep='')
mydum <- paste(mydum,')')
a<-table.element(a,mydum)
}
a<-table.row.end(a)
}
a<-table.end(a)
table.save(a,file='mytable.tab')
a<-table.start()
a<-table.row.start(a)
a<-table.element(a,'Estimated ARIMA Residuals', 1,TRUE)
a<-table.row.end(a)
a<-table.row.start(a)
a<-table.element(a,'Value', 1,TRUE)
a<-table.row.end(a)
for (i in (par4*par5+par3):length(resid)) {
a<-table.row.start(a)
a<-table.element(a,resid[i])
a<-table.row.end(a)
}
a<-table.end(a)
table.save(a,file='mytable1.tab')