Free Statistics

of Irreproducible Research!

Author's title

Author*The author of this computation has been verified*
R Software Modulerwasp_autocorrelation.wasp
Title produced by software(Partial) Autocorrelation Function
Date of computationFri, 16 Dec 2016 15:44:35 +0100
Cite this page as followsStatistical Computations at FreeStatistics.org, Office for Research Development and Education, URL https://freestatistics.org/blog/index.php?v=date/2016/Dec/16/t1481899495zvujqdhi8h4uye6.htm/, Retrieved Thu, 02 May 2024 21:02:51 +0000
Statistical Computations at FreeStatistics.org, Office for Research Development and Education, URL https://freestatistics.org/blog/index.php?pk=300326, Retrieved Thu, 02 May 2024 21:02:51 +0000
QR Codes:

Original text written by user:
IsPrivate?No (this computation is public)
User-defined keywords
Estimated Impact54
Family? (F = Feedback message, R = changed R code, M = changed R Module, P = changed Parameters, D = changed Data)
-     [ARIMA Backward Selection] [] [2016-12-16 13:36:55] [683f400e1b95307fc738e729f07c4fce]
-    D  [ARIMA Backward Selection] [] [2016-12-16 14:17:56] [683f400e1b95307fc738e729f07c4fce]
- RM D      [(Partial) Autocorrelation Function] [] [2016-12-16 14:44:35] [404ac5ee4f7301873f6a96ef36861981] [Current]
Feedback Forum

Post a new message
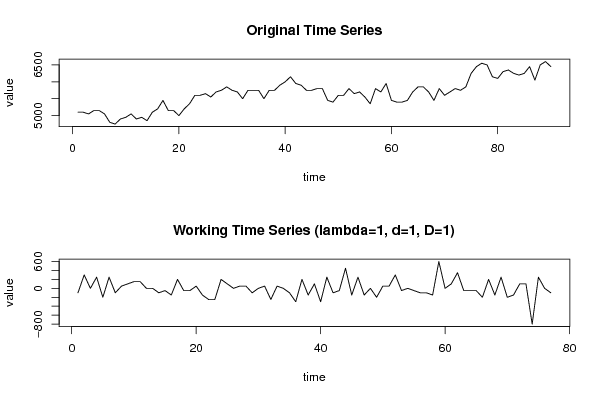
Dataseries X:
5100
5100
5050
5150
5150
5050
4800
4750
4900
4950
5050
4900
4950
4850
5100
5200
5450
5150
5150
5000
5200
5350
5600
5600
5650
5550
5700
5750
5850
5750
5700
5500
5750
5750
5750
5500
5750
5750
5900
6000
6150
5950
5900
5750
5750
5800
5800
5450
5400
5600
5600
5800
5650
5700
5550
5350
5800
5700
5950
5450
5400
5400
5450
5700
5850
5850
5700
5450
5800
5600
5700
5800
5750
5850
6250
6450
6550
6500
6150
6100
6300
6350
6250
6200
6250
6450
6050
6500
6600
6450


Summary of computational transaction
Raw Input view raw input (R code)
Raw Outputview raw output of R engine
Computing time2 seconds
R ServerBig Analytics Cloud Computing Center

\begin{tabular}{lllllllll}
\hline
Summary of computational transaction \tabularnewline
Raw Input view raw input (R code)  \tabularnewline
Raw Outputview raw output of R engine  \tabularnewline
Computing time2 seconds \tabularnewline
R ServerBig Analytics Cloud Computing Center \tabularnewline
\hline
\end{tabular}
%Source: https://freestatistics.org/blog/index.php?pk=300326&T=0

[TABLE]
[ROW]
Summary of computational transaction[/C][/ROW] [ROW]Raw Input[/C] view raw input (R code) [/C][/ROW] [ROW]Raw Output[/C]view raw output of R engine [/C][/ROW] [ROW]Computing time[/C]2 seconds[/C][/ROW] [ROW]R Server[/C]Big Analytics Cloud Computing Center[/C][/ROW] [/TABLE] Source: https://freestatistics.org/blog/index.php?pk=300326&T=0

Globally Unique Identifier (entire table): ba.freestatistics.org/blog/index.php?pk=300326&T=0

As an alternative you can also use a QR Code:  

The GUIDs for individual cells are displayed in the table below:

Summary of computational transaction
Raw Input view raw input (R code)
Raw Outputview raw output of R engine
Computing time2 seconds
R ServerBig Analytics Cloud Computing Center


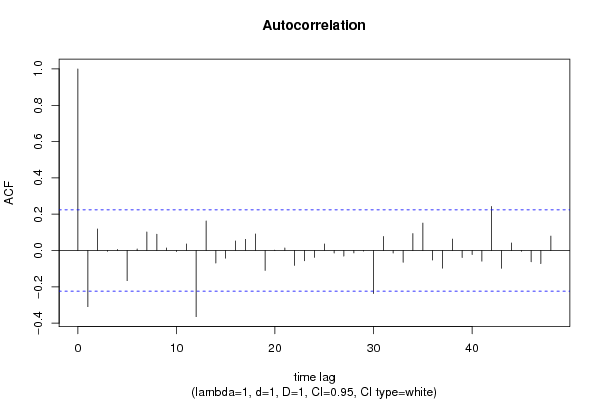
Autocorrelation Function
Time lag kACF(k)T-STATP-value
1-0.30919-2.71310.00411
20.1189321.04360.149962
3-0.004081-0.03580.485764
40.005730.05030.480014
5-0.166013-1.45680.074624
60.008350.07330.470889
70.1020480.89550.186665
80.0894180.78460.217535
90.014190.12450.450616
10-0.005075-0.04450.482299
110.0361180.31690.376077
12-0.364322-3.19690.001008
130.1624791.42570.078992
14-0.068753-0.60330.27404
15-0.041995-0.36850.356754
160.0527350.46280.322424
170.0612410.53740.296275
180.0905330.79440.214695
19-0.109404-0.960.170025
200.0019470.01710.493208
210.0135630.1190.452786
22-0.082071-0.72020.2368
23-0.056238-0.49350.311536
24-0.037725-0.3310.370757
250.0360010.31590.376464
26-0.014123-0.12390.450849
27-0.030831-0.27050.393735
28-0.013199-0.11580.454047
29-0.00328-0.02880.488558
30-0.236959-2.07930.020459
310.0770810.67640.250411
32-0.014213-0.12470.450536
33-0.064511-0.56610.286493
340.0931450.81730.208126
350.1508711.32390.094729
36-0.051992-0.45620.324754
37-0.097025-0.85140.198595
380.0627520.55060.291736
39-0.038506-0.33790.368183
40-0.021951-0.19260.423881
41-0.058609-0.51430.304261
420.2427372.130.018182
43-0.097377-0.85450.197746
440.0418530.36730.357217
45-0.004257-0.03740.48515
46-0.062049-0.54450.293844
47-0.072144-0.63310.264286
480.0794540.69720.243887

\begin{tabular}{lllllllll}
\hline
Autocorrelation Function \tabularnewline
Time lag k & ACF(k) & T-STAT & P-value \tabularnewline
1 & -0.30919 & -2.7131 & 0.00411 \tabularnewline
2 & 0.118932 & 1.0436 & 0.149962 \tabularnewline
3 & -0.004081 & -0.0358 & 0.485764 \tabularnewline
4 & 0.00573 & 0.0503 & 0.480014 \tabularnewline
5 & -0.166013 & -1.4568 & 0.074624 \tabularnewline
6 & 0.00835 & 0.0733 & 0.470889 \tabularnewline
7 & 0.102048 & 0.8955 & 0.186665 \tabularnewline
8 & 0.089418 & 0.7846 & 0.217535 \tabularnewline
9 & 0.01419 & 0.1245 & 0.450616 \tabularnewline
10 & -0.005075 & -0.0445 & 0.482299 \tabularnewline
11 & 0.036118 & 0.3169 & 0.376077 \tabularnewline
12 & -0.364322 & -3.1969 & 0.001008 \tabularnewline
13 & 0.162479 & 1.4257 & 0.078992 \tabularnewline
14 & -0.068753 & -0.6033 & 0.27404 \tabularnewline
15 & -0.041995 & -0.3685 & 0.356754 \tabularnewline
16 & 0.052735 & 0.4628 & 0.322424 \tabularnewline
17 & 0.061241 & 0.5374 & 0.296275 \tabularnewline
18 & 0.090533 & 0.7944 & 0.214695 \tabularnewline
19 & -0.109404 & -0.96 & 0.170025 \tabularnewline
20 & 0.001947 & 0.0171 & 0.493208 \tabularnewline
21 & 0.013563 & 0.119 & 0.452786 \tabularnewline
22 & -0.082071 & -0.7202 & 0.2368 \tabularnewline
23 & -0.056238 & -0.4935 & 0.311536 \tabularnewline
24 & -0.037725 & -0.331 & 0.370757 \tabularnewline
25 & 0.036001 & 0.3159 & 0.376464 \tabularnewline
26 & -0.014123 & -0.1239 & 0.450849 \tabularnewline
27 & -0.030831 & -0.2705 & 0.393735 \tabularnewline
28 & -0.013199 & -0.1158 & 0.454047 \tabularnewline
29 & -0.00328 & -0.0288 & 0.488558 \tabularnewline
30 & -0.236959 & -2.0793 & 0.020459 \tabularnewline
31 & 0.077081 & 0.6764 & 0.250411 \tabularnewline
32 & -0.014213 & -0.1247 & 0.450536 \tabularnewline
33 & -0.064511 & -0.5661 & 0.286493 \tabularnewline
34 & 0.093145 & 0.8173 & 0.208126 \tabularnewline
35 & 0.150871 & 1.3239 & 0.094729 \tabularnewline
36 & -0.051992 & -0.4562 & 0.324754 \tabularnewline
37 & -0.097025 & -0.8514 & 0.198595 \tabularnewline
38 & 0.062752 & 0.5506 & 0.291736 \tabularnewline
39 & -0.038506 & -0.3379 & 0.368183 \tabularnewline
40 & -0.021951 & -0.1926 & 0.423881 \tabularnewline
41 & -0.058609 & -0.5143 & 0.304261 \tabularnewline
42 & 0.242737 & 2.13 & 0.018182 \tabularnewline
43 & -0.097377 & -0.8545 & 0.197746 \tabularnewline
44 & 0.041853 & 0.3673 & 0.357217 \tabularnewline
45 & -0.004257 & -0.0374 & 0.48515 \tabularnewline
46 & -0.062049 & -0.5445 & 0.293844 \tabularnewline
47 & -0.072144 & -0.6331 & 0.264286 \tabularnewline
48 & 0.079454 & 0.6972 & 0.243887 \tabularnewline
\hline
\end{tabular}
%Source: https://freestatistics.org/blog/index.php?pk=300326&T=1

[TABLE]
[ROW][C]Autocorrelation Function[/C][/ROW]
[ROW][C]Time lag k[/C][C]ACF(k)[/C][C]T-STAT[/C][C]P-value[/C][/ROW]
[ROW][C]1[/C][C]-0.30919[/C][C]-2.7131[/C][C]0.00411[/C][/ROW]
[ROW][C]2[/C][C]0.118932[/C][C]1.0436[/C][C]0.149962[/C][/ROW]
[ROW][C]3[/C][C]-0.004081[/C][C]-0.0358[/C][C]0.485764[/C][/ROW]
[ROW][C]4[/C][C]0.00573[/C][C]0.0503[/C][C]0.480014[/C][/ROW]
[ROW][C]5[/C][C]-0.166013[/C][C]-1.4568[/C][C]0.074624[/C][/ROW]
[ROW][C]6[/C][C]0.00835[/C][C]0.0733[/C][C]0.470889[/C][/ROW]
[ROW][C]7[/C][C]0.102048[/C][C]0.8955[/C][C]0.186665[/C][/ROW]
[ROW][C]8[/C][C]0.089418[/C][C]0.7846[/C][C]0.217535[/C][/ROW]
[ROW][C]9[/C][C]0.01419[/C][C]0.1245[/C][C]0.450616[/C][/ROW]
[ROW][C]10[/C][C]-0.005075[/C][C]-0.0445[/C][C]0.482299[/C][/ROW]
[ROW][C]11[/C][C]0.036118[/C][C]0.3169[/C][C]0.376077[/C][/ROW]
[ROW][C]12[/C][C]-0.364322[/C][C]-3.1969[/C][C]0.001008[/C][/ROW]
[ROW][C]13[/C][C]0.162479[/C][C]1.4257[/C][C]0.078992[/C][/ROW]
[ROW][C]14[/C][C]-0.068753[/C][C]-0.6033[/C][C]0.27404[/C][/ROW]
[ROW][C]15[/C][C]-0.041995[/C][C]-0.3685[/C][C]0.356754[/C][/ROW]
[ROW][C]16[/C][C]0.052735[/C][C]0.4628[/C][C]0.322424[/C][/ROW]
[ROW][C]17[/C][C]0.061241[/C][C]0.5374[/C][C]0.296275[/C][/ROW]
[ROW][C]18[/C][C]0.090533[/C][C]0.7944[/C][C]0.214695[/C][/ROW]
[ROW][C]19[/C][C]-0.109404[/C][C]-0.96[/C][C]0.170025[/C][/ROW]
[ROW][C]20[/C][C]0.001947[/C][C]0.0171[/C][C]0.493208[/C][/ROW]
[ROW][C]21[/C][C]0.013563[/C][C]0.119[/C][C]0.452786[/C][/ROW]
[ROW][C]22[/C][C]-0.082071[/C][C]-0.7202[/C][C]0.2368[/C][/ROW]
[ROW][C]23[/C][C]-0.056238[/C][C]-0.4935[/C][C]0.311536[/C][/ROW]
[ROW][C]24[/C][C]-0.037725[/C][C]-0.331[/C][C]0.370757[/C][/ROW]
[ROW][C]25[/C][C]0.036001[/C][C]0.3159[/C][C]0.376464[/C][/ROW]
[ROW][C]26[/C][C]-0.014123[/C][C]-0.1239[/C][C]0.450849[/C][/ROW]
[ROW][C]27[/C][C]-0.030831[/C][C]-0.2705[/C][C]0.393735[/C][/ROW]
[ROW][C]28[/C][C]-0.013199[/C][C]-0.1158[/C][C]0.454047[/C][/ROW]
[ROW][C]29[/C][C]-0.00328[/C][C]-0.0288[/C][C]0.488558[/C][/ROW]
[ROW][C]30[/C][C]-0.236959[/C][C]-2.0793[/C][C]0.020459[/C][/ROW]
[ROW][C]31[/C][C]0.077081[/C][C]0.6764[/C][C]0.250411[/C][/ROW]
[ROW][C]32[/C][C]-0.014213[/C][C]-0.1247[/C][C]0.450536[/C][/ROW]
[ROW][C]33[/C][C]-0.064511[/C][C]-0.5661[/C][C]0.286493[/C][/ROW]
[ROW][C]34[/C][C]0.093145[/C][C]0.8173[/C][C]0.208126[/C][/ROW]
[ROW][C]35[/C][C]0.150871[/C][C]1.3239[/C][C]0.094729[/C][/ROW]
[ROW][C]36[/C][C]-0.051992[/C][C]-0.4562[/C][C]0.324754[/C][/ROW]
[ROW][C]37[/C][C]-0.097025[/C][C]-0.8514[/C][C]0.198595[/C][/ROW]
[ROW][C]38[/C][C]0.062752[/C][C]0.5506[/C][C]0.291736[/C][/ROW]
[ROW][C]39[/C][C]-0.038506[/C][C]-0.3379[/C][C]0.368183[/C][/ROW]
[ROW][C]40[/C][C]-0.021951[/C][C]-0.1926[/C][C]0.423881[/C][/ROW]
[ROW][C]41[/C][C]-0.058609[/C][C]-0.5143[/C][C]0.304261[/C][/ROW]
[ROW][C]42[/C][C]0.242737[/C][C]2.13[/C][C]0.018182[/C][/ROW]
[ROW][C]43[/C][C]-0.097377[/C][C]-0.8545[/C][C]0.197746[/C][/ROW]
[ROW][C]44[/C][C]0.041853[/C][C]0.3673[/C][C]0.357217[/C][/ROW]
[ROW][C]45[/C][C]-0.004257[/C][C]-0.0374[/C][C]0.48515[/C][/ROW]
[ROW][C]46[/C][C]-0.062049[/C][C]-0.5445[/C][C]0.293844[/C][/ROW]
[ROW][C]47[/C][C]-0.072144[/C][C]-0.6331[/C][C]0.264286[/C][/ROW]
[ROW][C]48[/C][C]0.079454[/C][C]0.6972[/C][C]0.243887[/C][/ROW]
[/TABLE]
Source: https://freestatistics.org/blog/index.php?pk=300326&T=1

Globally Unique Identifier (entire table): ba.freestatistics.org/blog/index.php?pk=300326&T=1

As an alternative you can also use a QR Code:  

The GUIDs for individual cells are displayed in the table below:

Autocorrelation Function
Time lag kACF(k)T-STATP-value
1-0.30919-2.71310.00411
20.1189321.04360.149962
3-0.004081-0.03580.485764
40.005730.05030.480014
5-0.166013-1.45680.074624
60.008350.07330.470889
70.1020480.89550.186665
80.0894180.78460.217535
90.014190.12450.450616
10-0.005075-0.04450.482299
110.0361180.31690.376077
12-0.364322-3.19690.001008
130.1624791.42570.078992
14-0.068753-0.60330.27404
15-0.041995-0.36850.356754
160.0527350.46280.322424
170.0612410.53740.296275
180.0905330.79440.214695
19-0.109404-0.960.170025
200.0019470.01710.493208
210.0135630.1190.452786
22-0.082071-0.72020.2368
23-0.056238-0.49350.311536
24-0.037725-0.3310.370757
250.0360010.31590.376464
26-0.014123-0.12390.450849
27-0.030831-0.27050.393735
28-0.013199-0.11580.454047
29-0.00328-0.02880.488558
30-0.236959-2.07930.020459
310.0770810.67640.250411
32-0.014213-0.12470.450536
33-0.064511-0.56610.286493
340.0931450.81730.208126
350.1508711.32390.094729
36-0.051992-0.45620.324754
37-0.097025-0.85140.198595
380.0627520.55060.291736
39-0.038506-0.33790.368183
40-0.021951-0.19260.423881
41-0.058609-0.51430.304261
420.2427372.130.018182
43-0.097377-0.85450.197746
440.0418530.36730.357217
45-0.004257-0.03740.48515
46-0.062049-0.54450.293844
47-0.072144-0.63310.264286
480.0794540.69720.243887


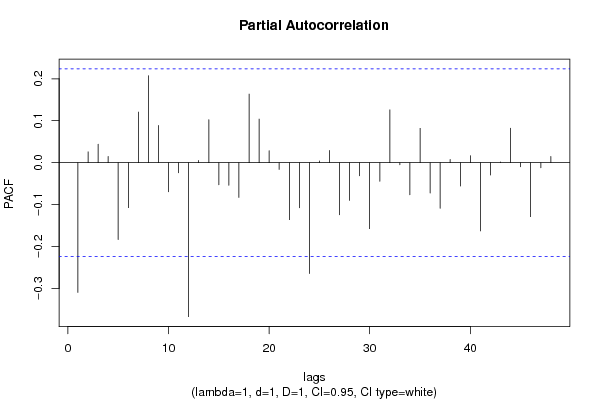
Partial Autocorrelation Function
Time lag kPACF(k)T-STATP-value
1-0.30919-2.71310.00411
20.02580.22640.410747
30.0439480.38560.350412
40.0149010.13080.448154
5-0.183262-1.60810.055951
6-0.107134-0.94010.175054
70.1205421.05780.146738
80.2071211.81750.036517
90.0885370.77690.219797
10-0.069427-0.60920.272087
11-0.023894-0.20970.417241
12-0.367033-3.22070.000937
130.0052020.04560.481856
140.1024740.89920.185674
15-0.052695-0.46240.32255
16-0.053976-0.47360.318549
17-0.082733-0.7260.235026
180.1633471.43340.077901
190.1038630.91140.182466
200.0282730.24810.402361
21-0.015967-0.14010.444468
22-0.135853-1.19210.118441
23-0.107426-0.94270.174402
24-0.264397-2.32010.011494
250.0039710.03480.486147
260.0289950.25440.399921
27-0.124344-1.09110.139312
28-0.089832-0.78830.216478
29-0.031222-0.2740.39242
30-0.157245-1.37980.085818
31-0.044286-0.38860.349318
320.1259241.1050.136304
33-0.004867-0.04270.483023
34-0.076393-0.67030.25232
350.0818340.71810.237436
36-0.072298-0.63440.263845
37-0.108794-0.95470.171368
380.0076330.0670.473387
39-0.055559-0.48750.313634
400.016660.14620.442078
41-0.162546-1.42630.078907
42-0.029233-0.25650.399117
430.0014740.01290.494858
440.082230.72160.236373
45-0.009971-0.08750.465253
46-0.128603-1.12850.13131
47-0.012255-0.10750.457323
480.0148320.13010.448394

\begin{tabular}{lllllllll}
\hline
Partial Autocorrelation Function \tabularnewline
Time lag k & PACF(k) & T-STAT & P-value \tabularnewline
1 & -0.30919 & -2.7131 & 0.00411 \tabularnewline
2 & 0.0258 & 0.2264 & 0.410747 \tabularnewline
3 & 0.043948 & 0.3856 & 0.350412 \tabularnewline
4 & 0.014901 & 0.1308 & 0.448154 \tabularnewline
5 & -0.183262 & -1.6081 & 0.055951 \tabularnewline
6 & -0.107134 & -0.9401 & 0.175054 \tabularnewline
7 & 0.120542 & 1.0578 & 0.146738 \tabularnewline
8 & 0.207121 & 1.8175 & 0.036517 \tabularnewline
9 & 0.088537 & 0.7769 & 0.219797 \tabularnewline
10 & -0.069427 & -0.6092 & 0.272087 \tabularnewline
11 & -0.023894 & -0.2097 & 0.417241 \tabularnewline
12 & -0.367033 & -3.2207 & 0.000937 \tabularnewline
13 & 0.005202 & 0.0456 & 0.481856 \tabularnewline
14 & 0.102474 & 0.8992 & 0.185674 \tabularnewline
15 & -0.052695 & -0.4624 & 0.32255 \tabularnewline
16 & -0.053976 & -0.4736 & 0.318549 \tabularnewline
17 & -0.082733 & -0.726 & 0.235026 \tabularnewline
18 & 0.163347 & 1.4334 & 0.077901 \tabularnewline
19 & 0.103863 & 0.9114 & 0.182466 \tabularnewline
20 & 0.028273 & 0.2481 & 0.402361 \tabularnewline
21 & -0.015967 & -0.1401 & 0.444468 \tabularnewline
22 & -0.135853 & -1.1921 & 0.118441 \tabularnewline
23 & -0.107426 & -0.9427 & 0.174402 \tabularnewline
24 & -0.264397 & -2.3201 & 0.011494 \tabularnewline
25 & 0.003971 & 0.0348 & 0.486147 \tabularnewline
26 & 0.028995 & 0.2544 & 0.399921 \tabularnewline
27 & -0.124344 & -1.0911 & 0.139312 \tabularnewline
28 & -0.089832 & -0.7883 & 0.216478 \tabularnewline
29 & -0.031222 & -0.274 & 0.39242 \tabularnewline
30 & -0.157245 & -1.3798 & 0.085818 \tabularnewline
31 & -0.044286 & -0.3886 & 0.349318 \tabularnewline
32 & 0.125924 & 1.105 & 0.136304 \tabularnewline
33 & -0.004867 & -0.0427 & 0.483023 \tabularnewline
34 & -0.076393 & -0.6703 & 0.25232 \tabularnewline
35 & 0.081834 & 0.7181 & 0.237436 \tabularnewline
36 & -0.072298 & -0.6344 & 0.263845 \tabularnewline
37 & -0.108794 & -0.9547 & 0.171368 \tabularnewline
38 & 0.007633 & 0.067 & 0.473387 \tabularnewline
39 & -0.055559 & -0.4875 & 0.313634 \tabularnewline
40 & 0.01666 & 0.1462 & 0.442078 \tabularnewline
41 & -0.162546 & -1.4263 & 0.078907 \tabularnewline
42 & -0.029233 & -0.2565 & 0.399117 \tabularnewline
43 & 0.001474 & 0.0129 & 0.494858 \tabularnewline
44 & 0.08223 & 0.7216 & 0.236373 \tabularnewline
45 & -0.009971 & -0.0875 & 0.465253 \tabularnewline
46 & -0.128603 & -1.1285 & 0.13131 \tabularnewline
47 & -0.012255 & -0.1075 & 0.457323 \tabularnewline
48 & 0.014832 & 0.1301 & 0.448394 \tabularnewline
\hline
\end{tabular}
%Source: https://freestatistics.org/blog/index.php?pk=300326&T=2

[TABLE]
[ROW][C]Partial Autocorrelation Function[/C][/ROW]
[ROW][C]Time lag k[/C][C]PACF(k)[/C][C]T-STAT[/C][C]P-value[/C][/ROW]
[ROW][C]1[/C][C]-0.30919[/C][C]-2.7131[/C][C]0.00411[/C][/ROW]
[ROW][C]2[/C][C]0.0258[/C][C]0.2264[/C][C]0.410747[/C][/ROW]
[ROW][C]3[/C][C]0.043948[/C][C]0.3856[/C][C]0.350412[/C][/ROW]
[ROW][C]4[/C][C]0.014901[/C][C]0.1308[/C][C]0.448154[/C][/ROW]
[ROW][C]5[/C][C]-0.183262[/C][C]-1.6081[/C][C]0.055951[/C][/ROW]
[ROW][C]6[/C][C]-0.107134[/C][C]-0.9401[/C][C]0.175054[/C][/ROW]
[ROW][C]7[/C][C]0.120542[/C][C]1.0578[/C][C]0.146738[/C][/ROW]
[ROW][C]8[/C][C]0.207121[/C][C]1.8175[/C][C]0.036517[/C][/ROW]
[ROW][C]9[/C][C]0.088537[/C][C]0.7769[/C][C]0.219797[/C][/ROW]
[ROW][C]10[/C][C]-0.069427[/C][C]-0.6092[/C][C]0.272087[/C][/ROW]
[ROW][C]11[/C][C]-0.023894[/C][C]-0.2097[/C][C]0.417241[/C][/ROW]
[ROW][C]12[/C][C]-0.367033[/C][C]-3.2207[/C][C]0.000937[/C][/ROW]
[ROW][C]13[/C][C]0.005202[/C][C]0.0456[/C][C]0.481856[/C][/ROW]
[ROW][C]14[/C][C]0.102474[/C][C]0.8992[/C][C]0.185674[/C][/ROW]
[ROW][C]15[/C][C]-0.052695[/C][C]-0.4624[/C][C]0.32255[/C][/ROW]
[ROW][C]16[/C][C]-0.053976[/C][C]-0.4736[/C][C]0.318549[/C][/ROW]
[ROW][C]17[/C][C]-0.082733[/C][C]-0.726[/C][C]0.235026[/C][/ROW]
[ROW][C]18[/C][C]0.163347[/C][C]1.4334[/C][C]0.077901[/C][/ROW]
[ROW][C]19[/C][C]0.103863[/C][C]0.9114[/C][C]0.182466[/C][/ROW]
[ROW][C]20[/C][C]0.028273[/C][C]0.2481[/C][C]0.402361[/C][/ROW]
[ROW][C]21[/C][C]-0.015967[/C][C]-0.1401[/C][C]0.444468[/C][/ROW]
[ROW][C]22[/C][C]-0.135853[/C][C]-1.1921[/C][C]0.118441[/C][/ROW]
[ROW][C]23[/C][C]-0.107426[/C][C]-0.9427[/C][C]0.174402[/C][/ROW]
[ROW][C]24[/C][C]-0.264397[/C][C]-2.3201[/C][C]0.011494[/C][/ROW]
[ROW][C]25[/C][C]0.003971[/C][C]0.0348[/C][C]0.486147[/C][/ROW]
[ROW][C]26[/C][C]0.028995[/C][C]0.2544[/C][C]0.399921[/C][/ROW]
[ROW][C]27[/C][C]-0.124344[/C][C]-1.0911[/C][C]0.139312[/C][/ROW]
[ROW][C]28[/C][C]-0.089832[/C][C]-0.7883[/C][C]0.216478[/C][/ROW]
[ROW][C]29[/C][C]-0.031222[/C][C]-0.274[/C][C]0.39242[/C][/ROW]
[ROW][C]30[/C][C]-0.157245[/C][C]-1.3798[/C][C]0.085818[/C][/ROW]
[ROW][C]31[/C][C]-0.044286[/C][C]-0.3886[/C][C]0.349318[/C][/ROW]
[ROW][C]32[/C][C]0.125924[/C][C]1.105[/C][C]0.136304[/C][/ROW]
[ROW][C]33[/C][C]-0.004867[/C][C]-0.0427[/C][C]0.483023[/C][/ROW]
[ROW][C]34[/C][C]-0.076393[/C][C]-0.6703[/C][C]0.25232[/C][/ROW]
[ROW][C]35[/C][C]0.081834[/C][C]0.7181[/C][C]0.237436[/C][/ROW]
[ROW][C]36[/C][C]-0.072298[/C][C]-0.6344[/C][C]0.263845[/C][/ROW]
[ROW][C]37[/C][C]-0.108794[/C][C]-0.9547[/C][C]0.171368[/C][/ROW]
[ROW][C]38[/C][C]0.007633[/C][C]0.067[/C][C]0.473387[/C][/ROW]
[ROW][C]39[/C][C]-0.055559[/C][C]-0.4875[/C][C]0.313634[/C][/ROW]
[ROW][C]40[/C][C]0.01666[/C][C]0.1462[/C][C]0.442078[/C][/ROW]
[ROW][C]41[/C][C]-0.162546[/C][C]-1.4263[/C][C]0.078907[/C][/ROW]
[ROW][C]42[/C][C]-0.029233[/C][C]-0.2565[/C][C]0.399117[/C][/ROW]
[ROW][C]43[/C][C]0.001474[/C][C]0.0129[/C][C]0.494858[/C][/ROW]
[ROW][C]44[/C][C]0.08223[/C][C]0.7216[/C][C]0.236373[/C][/ROW]
[ROW][C]45[/C][C]-0.009971[/C][C]-0.0875[/C][C]0.465253[/C][/ROW]
[ROW][C]46[/C][C]-0.128603[/C][C]-1.1285[/C][C]0.13131[/C][/ROW]
[ROW][C]47[/C][C]-0.012255[/C][C]-0.1075[/C][C]0.457323[/C][/ROW]
[ROW][C]48[/C][C]0.014832[/C][C]0.1301[/C][C]0.448394[/C][/ROW]
[/TABLE]
Source: https://freestatistics.org/blog/index.php?pk=300326&T=2

Globally Unique Identifier (entire table): ba.freestatistics.org/blog/index.php?pk=300326&T=2

As an alternative you can also use a QR Code:  

The GUIDs for individual cells are displayed in the table below:

Partial Autocorrelation Function
Time lag kPACF(k)T-STATP-value
1-0.30919-2.71310.00411
20.02580.22640.410747
30.0439480.38560.350412
40.0149010.13080.448154
5-0.183262-1.60810.055951
6-0.107134-0.94010.175054
70.1205421.05780.146738
80.2071211.81750.036517
90.0885370.77690.219797
10-0.069427-0.60920.272087
11-0.023894-0.20970.417241
12-0.367033-3.22070.000937
130.0052020.04560.481856
140.1024740.89920.185674
15-0.052695-0.46240.32255
16-0.053976-0.47360.318549
17-0.082733-0.7260.235026
180.1633471.43340.077901
190.1038630.91140.182466
200.0282730.24810.402361
21-0.015967-0.14010.444468
22-0.135853-1.19210.118441
23-0.107426-0.94270.174402
24-0.264397-2.32010.011494
250.0039710.03480.486147
260.0289950.25440.399921
27-0.124344-1.09110.139312
28-0.089832-0.78830.216478
29-0.031222-0.2740.39242
30-0.157245-1.37980.085818
31-0.044286-0.38860.349318
320.1259241.1050.136304
33-0.004867-0.04270.483023
34-0.076393-0.67030.25232
350.0818340.71810.237436
36-0.072298-0.63440.263845
37-0.108794-0.95470.171368
380.0076330.0670.473387
39-0.055559-0.48750.313634
400.016660.14620.442078
41-0.162546-1.42630.078907
42-0.029233-0.25650.399117
430.0014740.01290.494858
440.082230.72160.236373
45-0.009971-0.08750.465253
46-0.128603-1.12850.13131
47-0.012255-0.10750.457323
480.0148320.13010.448394


Parameters (Session):
par1 = FALSE ; par2 = 1 ; par3 = 2 ; par4 = 0 ; par5 = 1 ; par6 = 3 ; par7 = 1 ; par8 = 2 ; par9 = 0 ;
Parameters (R input):
par1 = 48 ; par2 = 1 ; par3 = 1 ; par4 = 1 ; par5 = 12 ; par6 = White Noise ; par7 = 0.95 ; par8 = ;
R code (references can be found in the software module):
par8 <- ''
par7 <- '0.95'
par6 <- 'White Noise'
par5 <- '12'
par4 <- '0'
par3 <- '1'
par2 <- '1'
par1 <- '48'
if (par1 == 'Default') {
par1 = 10*log10(length(x))
} else {
par1 <- as.numeric(par1)
}
par2 <- as.numeric(par2)
par3 <- as.numeric(par3)
par4 <- as.numeric(par4)
par5 <- as.numeric(par5)
if (par6 == 'White Noise') par6 <- 'white' else par6 <- 'ma'
par7 <- as.numeric(par7)
if (par8 != '') par8 <- as.numeric(par8)
x <- na.omit(x)
ox <- x
if (par8 == '') {
if (par2 == 0) {
x <- log(x)
} else {
x <- (x ^ par2 - 1) / par2
}
} else {
x <- log(x,base=par8)
}
if (par3 > 0) x <- diff(x,lag=1,difference=par3)
if (par4 > 0) x <- diff(x,lag=par5,difference=par4)
bitmap(file='picts.png')
op <- par(mfrow=c(2,1))
plot(ox,type='l',main='Original Time Series',xlab='time',ylab='value')
if (par8=='') {
mytitle <- paste('Working Time Series (lambda=',par2,', d=',par3,', D=',par4,')',sep='')
mysub <- paste('(lambda=',par2,', d=',par3,', D=',par4,', CI=', par7, ', CI type=',par6,')',sep='')
} else {
mytitle <- paste('Working Time Series (base=',par8,', d=',par3,', D=',par4,')',sep='')
mysub <- paste('(base=',par8,', d=',par3,', D=',par4,', CI=', par7, ', CI type=',par6,')',sep='')
}
plot(x,type='l', main=mytitle,xlab='time',ylab='value')
par(op)
dev.off()
bitmap(file='pic1.png')
racf <- acf(x, par1, main='Autocorrelation', xlab='time lag', ylab='ACF', ci.type=par6, ci=par7, sub=mysub)
dev.off()
bitmap(file='pic2.png')
rpacf <- pacf(x,par1,main='Partial Autocorrelation',xlab='lags',ylab='PACF',sub=mysub)
dev.off()
(myacf <- c(racf$acf))
(mypacf <- c(rpacf$acf))
lengthx <- length(x)
sqrtn <- sqrt(lengthx)
load(file='createtable')
a<-table.start()
a<-table.row.start(a)
a<-table.element(a,'Autocorrelation Function',4,TRUE)
a<-table.row.end(a)
a<-table.row.start(a)
a<-table.element(a,'Time lag k',header=TRUE)
a<-table.element(a,'ACF(k)',header=TRUE)
a<-table.element(a,'T-STAT',header=TRUE)
a<-table.element(a,'P-value',header=TRUE)
a<-table.row.end(a)
for (i in 2:(par1+1)) {
a<-table.row.start(a)
a<-table.element(a,i-1,header=TRUE)
a<-table.element(a,round(myacf[i],6))
mytstat <- myacf[i]*sqrtn
a<-table.element(a,round(mytstat,4))
a<-table.element(a,round(1-pt(abs(mytstat),lengthx),6))
a<-table.row.end(a)
}
a<-table.end(a)
table.save(a,file='mytable.tab')
a<-table.start()
a<-table.row.start(a)
a<-table.element(a,'Partial Autocorrelation Function',4,TRUE)
a<-table.row.end(a)
a<-table.row.start(a)
a<-table.element(a,'Time lag k',header=TRUE)
a<-table.element(a,'PACF(k)',header=TRUE)
a<-table.element(a,'T-STAT',header=TRUE)
a<-table.element(a,'P-value',header=TRUE)
a<-table.row.end(a)
for (i in 1:par1) {
a<-table.row.start(a)
a<-table.element(a,i,header=TRUE)
a<-table.element(a,round(mypacf[i],6))
mytstat <- mypacf[i]*sqrtn
a<-table.element(a,round(mytstat,4))
a<-table.element(a,round(1-pt(abs(mytstat),lengthx),6))
a<-table.row.end(a)
}
a<-table.end(a)
table.save(a,file='mytable1.tab')