Free Statistics

of Irreproducible Research!

Author's title

Author*The author of this computation has been verified*
R Software Modulerwasp_autocorrelation.wasp
Title produced by software(Partial) Autocorrelation Function
Date of computationFri, 16 Dec 2016 16:11:19 +0100
Cite this page as followsStatistical Computations at FreeStatistics.org, Office for Research Development and Education, URL https://freestatistics.org/blog/index.php?v=date/2016/Dec/16/t1481901089tovkqm8tjrsp6i9.htm/, Retrieved Thu, 02 May 2024 21:32:16 +0000
Statistical Computations at FreeStatistics.org, Office for Research Development and Education, URL https://freestatistics.org/blog/index.php?pk=300345, Retrieved Thu, 02 May 2024 21:32:16 +0000
QR Codes:

Original text written by user:
IsPrivate?No (this computation is public)
User-defined keywords
Estimated Impact62
Family? (F = Feedback message, R = changed R code, M = changed R Module, P = changed Parameters, D = changed Data)
-     [ARIMA Backward Selection] [] [2016-12-16 13:36:55] [683f400e1b95307fc738e729f07c4fce]
-    D  [ARIMA Backward Selection] [] [2016-12-16 14:17:56] [683f400e1b95307fc738e729f07c4fce]
- R  D    [ARIMA Backward Selection] [] [2016-12-16 14:51:40] [683f400e1b95307fc738e729f07c4fce]
- RM D        [(Partial) Autocorrelation Function] [] [2016-12-16 15:11:19] [404ac5ee4f7301873f6a96ef36861981] [Current]
Feedback Forum

Post a new message
Dataseries X:
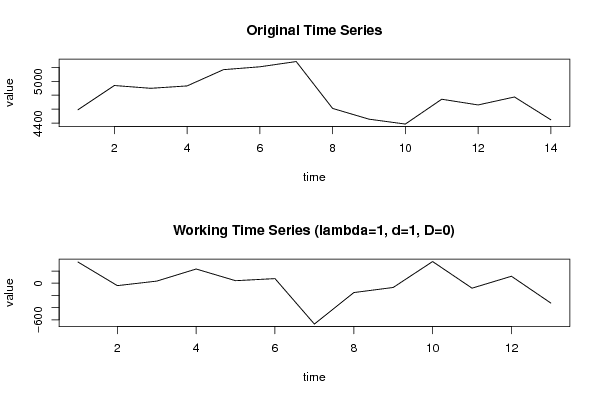
4591.48
4939.08
4898.89
4933.19
5165.89
5206.79
5282.09
4611.29
4457.38
4387.3
4742.6
4660.88
4774.8
4448.5


Summary of computational transaction
Raw Input view raw input (R code)
Raw Outputview raw output of R engine
Computing time2 seconds
R ServerBig Analytics Cloud Computing Center

\begin{tabular}{lllllllll}
\hline
Summary of computational transaction \tabularnewline
Raw Input view raw input (R code)  \tabularnewline
Raw Outputview raw output of R engine  \tabularnewline
Computing time2 seconds \tabularnewline
R ServerBig Analytics Cloud Computing Center \tabularnewline
\hline
\end{tabular}
%Source: https://freestatistics.org/blog/index.php?pk=300345&T=0

[TABLE]
[ROW]
Summary of computational transaction[/C][/ROW] [ROW]Raw Input[/C] view raw input (R code) [/C][/ROW] [ROW]Raw Output[/C]view raw output of R engine [/C][/ROW] [ROW]Computing time[/C]2 seconds[/C][/ROW] [ROW]R Server[/C]Big Analytics Cloud Computing Center[/C][/ROW] [/TABLE] Source: https://freestatistics.org/blog/index.php?pk=300345&T=0

Globally Unique Identifier (entire table): ba.freestatistics.org/blog/index.php?pk=300345&T=0

As an alternative you can also use a QR Code:  

The GUIDs for individual cells are displayed in the table below:

Summary of computational transaction
Raw Input view raw input (R code)
Raw Outputview raw output of R engine
Computing time2 seconds
R ServerBig Analytics Cloud Computing Center


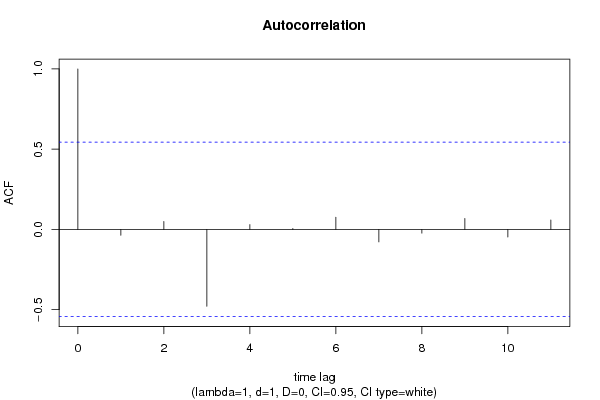
Autocorrelation Function
Time lag kACF(k)T-STATP-value
1-0.036738-0.13250.448324
20.0489940.17670.431252
3-0.478937-1.72680.053933
40.0299180.10790.457872
50.0053380.01920.492469
60.0757860.27330.394477
7-0.077522-0.27950.392125
8-0.022969-0.08280.46763
90.0680590.24540.404992
10-0.047338-0.17070.433551
110.059050.21290.417351

\begin{tabular}{lllllllll}
\hline
Autocorrelation Function \tabularnewline
Time lag k & ACF(k) & T-STAT & P-value \tabularnewline
1 & -0.036738 & -0.1325 & 0.448324 \tabularnewline
2 & 0.048994 & 0.1767 & 0.431252 \tabularnewline
3 & -0.478937 & -1.7268 & 0.053933 \tabularnewline
4 & 0.029918 & 0.1079 & 0.457872 \tabularnewline
5 & 0.005338 & 0.0192 & 0.492469 \tabularnewline
6 & 0.075786 & 0.2733 & 0.394477 \tabularnewline
7 & -0.077522 & -0.2795 & 0.392125 \tabularnewline
8 & -0.022969 & -0.0828 & 0.46763 \tabularnewline
9 & 0.068059 & 0.2454 & 0.404992 \tabularnewline
10 & -0.047338 & -0.1707 & 0.433551 \tabularnewline
11 & 0.05905 & 0.2129 & 0.417351 \tabularnewline
\hline
\end{tabular}
%Source: https://freestatistics.org/blog/index.php?pk=300345&T=1

[TABLE]
[ROW][C]Autocorrelation Function[/C][/ROW]
[ROW][C]Time lag k[/C][C]ACF(k)[/C][C]T-STAT[/C][C]P-value[/C][/ROW]
[ROW][C]1[/C][C]-0.036738[/C][C]-0.1325[/C][C]0.448324[/C][/ROW]
[ROW][C]2[/C][C]0.048994[/C][C]0.1767[/C][C]0.431252[/C][/ROW]
[ROW][C]3[/C][C]-0.478937[/C][C]-1.7268[/C][C]0.053933[/C][/ROW]
[ROW][C]4[/C][C]0.029918[/C][C]0.1079[/C][C]0.457872[/C][/ROW]
[ROW][C]5[/C][C]0.005338[/C][C]0.0192[/C][C]0.492469[/C][/ROW]
[ROW][C]6[/C][C]0.075786[/C][C]0.2733[/C][C]0.394477[/C][/ROW]
[ROW][C]7[/C][C]-0.077522[/C][C]-0.2795[/C][C]0.392125[/C][/ROW]
[ROW][C]8[/C][C]-0.022969[/C][C]-0.0828[/C][C]0.46763[/C][/ROW]
[ROW][C]9[/C][C]0.068059[/C][C]0.2454[/C][C]0.404992[/C][/ROW]
[ROW][C]10[/C][C]-0.047338[/C][C]-0.1707[/C][C]0.433551[/C][/ROW]
[ROW][C]11[/C][C]0.05905[/C][C]0.2129[/C][C]0.417351[/C][/ROW]
[/TABLE]
Source: https://freestatistics.org/blog/index.php?pk=300345&T=1

Globally Unique Identifier (entire table): ba.freestatistics.org/blog/index.php?pk=300345&T=1

As an alternative you can also use a QR Code:  

The GUIDs for individual cells are displayed in the table below:

Autocorrelation Function
Time lag kACF(k)T-STATP-value
1-0.036738-0.13250.448324
20.0489940.17670.431252
3-0.478937-1.72680.053933
40.0299180.10790.457872
50.0053380.01920.492469
60.0757860.27330.394477
7-0.077522-0.27950.392125
8-0.022969-0.08280.46763
90.0680590.24540.404992
10-0.047338-0.17070.433551
110.059050.21290.417351


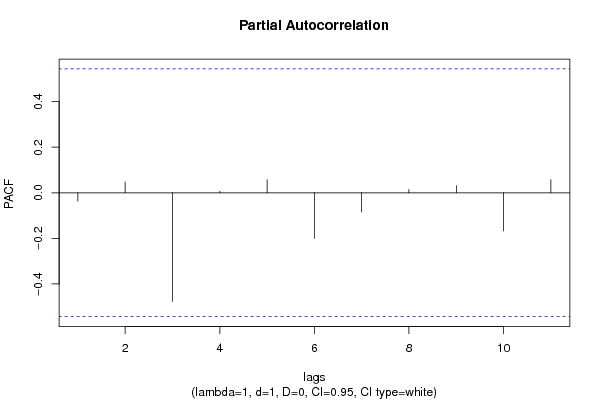
Partial Autocorrelation Function
Time lag kPACF(k)T-STATP-value
1-0.036738-0.13250.448324
20.0477090.1720.433036
3-0.477199-1.72060.054514
40.0065180.02350.490804
50.0571620.20610.419953
6-0.200147-0.72160.241647
7-0.0841-0.30320.383258
80.0144150.0520.47967
90.0314270.11330.455758
10-0.167183-0.60280.27851
110.0576860.2080.41923

\begin{tabular}{lllllllll}
\hline
Partial Autocorrelation Function \tabularnewline
Time lag k & PACF(k) & T-STAT & P-value \tabularnewline
1 & -0.036738 & -0.1325 & 0.448324 \tabularnewline
2 & 0.047709 & 0.172 & 0.433036 \tabularnewline
3 & -0.477199 & -1.7206 & 0.054514 \tabularnewline
4 & 0.006518 & 0.0235 & 0.490804 \tabularnewline
5 & 0.057162 & 0.2061 & 0.419953 \tabularnewline
6 & -0.200147 & -0.7216 & 0.241647 \tabularnewline
7 & -0.0841 & -0.3032 & 0.383258 \tabularnewline
8 & 0.014415 & 0.052 & 0.47967 \tabularnewline
9 & 0.031427 & 0.1133 & 0.455758 \tabularnewline
10 & -0.167183 & -0.6028 & 0.27851 \tabularnewline
11 & 0.057686 & 0.208 & 0.41923 \tabularnewline
\hline
\end{tabular}
%Source: https://freestatistics.org/blog/index.php?pk=300345&T=2

[TABLE]
[ROW][C]Partial Autocorrelation Function[/C][/ROW]
[ROW][C]Time lag k[/C][C]PACF(k)[/C][C]T-STAT[/C][C]P-value[/C][/ROW]
[ROW][C]1[/C][C]-0.036738[/C][C]-0.1325[/C][C]0.448324[/C][/ROW]
[ROW][C]2[/C][C]0.047709[/C][C]0.172[/C][C]0.433036[/C][/ROW]
[ROW][C]3[/C][C]-0.477199[/C][C]-1.7206[/C][C]0.054514[/C][/ROW]
[ROW][C]4[/C][C]0.006518[/C][C]0.0235[/C][C]0.490804[/C][/ROW]
[ROW][C]5[/C][C]0.057162[/C][C]0.2061[/C][C]0.419953[/C][/ROW]
[ROW][C]6[/C][C]-0.200147[/C][C]-0.7216[/C][C]0.241647[/C][/ROW]
[ROW][C]7[/C][C]-0.0841[/C][C]-0.3032[/C][C]0.383258[/C][/ROW]
[ROW][C]8[/C][C]0.014415[/C][C]0.052[/C][C]0.47967[/C][/ROW]
[ROW][C]9[/C][C]0.031427[/C][C]0.1133[/C][C]0.455758[/C][/ROW]
[ROW][C]10[/C][C]-0.167183[/C][C]-0.6028[/C][C]0.27851[/C][/ROW]
[ROW][C]11[/C][C]0.057686[/C][C]0.208[/C][C]0.41923[/C][/ROW]
[/TABLE]
Source: https://freestatistics.org/blog/index.php?pk=300345&T=2

Globally Unique Identifier (entire table): ba.freestatistics.org/blog/index.php?pk=300345&T=2

As an alternative you can also use a QR Code:  

The GUIDs for individual cells are displayed in the table below:

Partial Autocorrelation Function
Time lag kPACF(k)T-STATP-value
1-0.036738-0.13250.448324
20.0477090.1720.433036
3-0.477199-1.72060.054514
40.0065180.02350.490804
50.0571620.20610.419953
6-0.200147-0.72160.241647
7-0.0841-0.30320.383258
80.0144150.0520.47967
90.0314270.11330.455758
10-0.167183-0.60280.27851
110.0576860.2080.41923


Parameters (Session):
par1 = FALSE ; par2 = 1 ; par3 = 2 ; par4 = 0 ; par5 = 1 ; par6 = 3 ; par7 = 1 ; par8 = 2 ; par9 = 0 ;
Parameters (R input):
par1 = Default ; par2 = 1 ; par3 = 1 ; par4 = 0 ; par5 = 12 ; par6 = White Noise ; par7 = 0.95 ; par8 = ;
R code (references can be found in the software module):
par8 <- ''
par7 <- '0.95'
par6 <- 'White Noise'
par5 <- '12'
par4 <- '0'
par3 <- '1'
par2 <- '1'
par1 <- '6'
if (par1 == 'Default') {
par1 = 10*log10(length(x))
} else {
par1 <- as.numeric(par1)
}
par2 <- as.numeric(par2)
par3 <- as.numeric(par3)
par4 <- as.numeric(par4)
par5 <- as.numeric(par5)
if (par6 == 'White Noise') par6 <- 'white' else par6 <- 'ma'
par7 <- as.numeric(par7)
if (par8 != '') par8 <- as.numeric(par8)
x <- na.omit(x)
ox <- x
if (par8 == '') {
if (par2 == 0) {
x <- log(x)
} else {
x <- (x ^ par2 - 1) / par2
}
} else {
x <- log(x,base=par8)
}
if (par3 > 0) x <- diff(x,lag=1,difference=par3)
if (par4 > 0) x <- diff(x,lag=par5,difference=par4)
bitmap(file='picts.png')
op <- par(mfrow=c(2,1))
plot(ox,type='l',main='Original Time Series',xlab='time',ylab='value')
if (par8=='') {
mytitle <- paste('Working Time Series (lambda=',par2,', d=',par3,', D=',par4,')',sep='')
mysub <- paste('(lambda=',par2,', d=',par3,', D=',par4,', CI=', par7, ', CI type=',par6,')',sep='')
} else {
mytitle <- paste('Working Time Series (base=',par8,', d=',par3,', D=',par4,')',sep='')
mysub <- paste('(base=',par8,', d=',par3,', D=',par4,', CI=', par7, ', CI type=',par6,')',sep='')
}
plot(x,type='l', main=mytitle,xlab='time',ylab='value')
par(op)
dev.off()
bitmap(file='pic1.png')
racf <- acf(x, par1, main='Autocorrelation', xlab='time lag', ylab='ACF', ci.type=par6, ci=par7, sub=mysub)
dev.off()
bitmap(file='pic2.png')
rpacf <- pacf(x,par1,main='Partial Autocorrelation',xlab='lags',ylab='PACF',sub=mysub)
dev.off()
(myacf <- c(racf$acf))
(mypacf <- c(rpacf$acf))
lengthx <- length(x)
sqrtn <- sqrt(lengthx)
load(file='createtable')
a<-table.start()
a<-table.row.start(a)
a<-table.element(a,'Autocorrelation Function',4,TRUE)
a<-table.row.end(a)
a<-table.row.start(a)
a<-table.element(a,'Time lag k',header=TRUE)
a<-table.element(a,'ACF(k)',header=TRUE)
a<-table.element(a,'T-STAT',header=TRUE)
a<-table.element(a,'P-value',header=TRUE)
a<-table.row.end(a)
for (i in 2:(par1+1)) {
a<-table.row.start(a)
a<-table.element(a,i-1,header=TRUE)
a<-table.element(a,round(myacf[i],6))
mytstat <- myacf[i]*sqrtn
a<-table.element(a,round(mytstat,4))
a<-table.element(a,round(1-pt(abs(mytstat),lengthx),6))
a<-table.row.end(a)
}
a<-table.end(a)
table.save(a,file='mytable.tab')
a<-table.start()
a<-table.row.start(a)
a<-table.element(a,'Partial Autocorrelation Function',4,TRUE)
a<-table.row.end(a)
a<-table.row.start(a)
a<-table.element(a,'Time lag k',header=TRUE)
a<-table.element(a,'PACF(k)',header=TRUE)
a<-table.element(a,'T-STAT',header=TRUE)
a<-table.element(a,'P-value',header=TRUE)
a<-table.row.end(a)
for (i in 1:par1) {
a<-table.row.start(a)
a<-table.element(a,i,header=TRUE)
a<-table.element(a,round(mypacf[i],6))
mytstat <- mypacf[i]*sqrtn
a<-table.element(a,round(mytstat,4))
a<-table.element(a,round(1-pt(abs(mytstat),lengthx),6))
a<-table.row.end(a)
}
a<-table.end(a)
table.save(a,file='mytable1.tab')