Free Statistics

of Irreproducible Research!

Author's title

Author*The author of this computation has been verified*
R Software Modulerwasp_exponentialsmoothing.wasp
Title produced by softwareExponential Smoothing
Date of computationFri, 16 Dec 2016 16:22:42 +0100
Cite this page as followsStatistical Computations at FreeStatistics.org, Office for Research Development and Education, URL https://freestatistics.org/blog/index.php?v=date/2016/Dec/16/t14819017761co3mn63tq5cote.htm/, Retrieved Fri, 03 May 2024 02:40:29 +0000
Statistical Computations at FreeStatistics.org, Office for Research Development and Education, URL https://freestatistics.org/blog/index.php?pk=300359, Retrieved Fri, 03 May 2024 02:40:29 +0000
QR Codes:

Original text written by user:
IsPrivate?No (this computation is public)
User-defined keywords
Estimated Impact67
Family? (F = Feedback message, R = changed R code, M = changed R Module, P = changed Parameters, D = changed Data)
-     [ARIMA Backward Selection] [] [2016-12-16 13:36:55] [683f400e1b95307fc738e729f07c4fce]
-    D  [ARIMA Backward Selection] [] [2016-12-16 14:17:56] [683f400e1b95307fc738e729f07c4fce]
- R  D    [ARIMA Backward Selection] [] [2016-12-16 14:51:40] [683f400e1b95307fc738e729f07c4fce]
- RM D        [Exponential Smoothing] [] [2016-12-16 15:22:42] [404ac5ee4f7301873f6a96ef36861981] [Current]
Feedback Forum

Post a new message
Dataseries X:
4591.48
4939.08
4898.89
4933.19
5165.89
5206.79
5282.09
4611.29
4457.38
4387.3
4742.6
4660.88
4774.8
4448.5


Summary of computational transaction
Raw Input view raw input (R code)
Raw Outputview raw output of R engine
Computing time1 seconds
R ServerBig Analytics Cloud Computing Center

\begin{tabular}{lllllllll}
\hline
Summary of computational transaction \tabularnewline
Raw Input view raw input (R code)  \tabularnewline
Raw Outputview raw output of R engine  \tabularnewline
Computing time1 seconds \tabularnewline
R ServerBig Analytics Cloud Computing Center \tabularnewline
\hline
\end{tabular}
%Source: https://freestatistics.org/blog/index.php?pk=300359&T=0

[TABLE]
[ROW]
Summary of computational transaction[/C][/ROW] [ROW]Raw Input[/C] view raw input (R code) [/C][/ROW] [ROW]Raw Output[/C]view raw output of R engine [/C][/ROW] [ROW]Computing time[/C]1 seconds[/C][/ROW] [ROW]R Server[/C]Big Analytics Cloud Computing Center[/C][/ROW] [/TABLE] Source: https://freestatistics.org/blog/index.php?pk=300359&T=0

Globally Unique Identifier (entire table): ba.freestatistics.org/blog/index.php?pk=300359&T=0

As an alternative you can also use a QR Code:  

The GUIDs for individual cells are displayed in the table below:

Summary of computational transaction
Raw Input view raw input (R code)
Raw Outputview raw output of R engine
Computing time1 seconds
R ServerBig Analytics Cloud Computing Center


Estimated Parameters of Exponential Smoothing
ParameterValue
alpha1
beta0.331348940076878
gammaFALSE

\begin{tabular}{lllllllll}
\hline
Estimated Parameters of Exponential Smoothing \tabularnewline
Parameter & Value \tabularnewline
alpha & 1 \tabularnewline
beta & 0.331348940076878 \tabularnewline
gamma & FALSE \tabularnewline
\hline
\end{tabular}
%Source: https://freestatistics.org/blog/index.php?pk=300359&T=1

[TABLE]
[ROW][C]Estimated Parameters of Exponential Smoothing[/C][/ROW]
[ROW][C]Parameter[/C][C]Value[/C][/ROW]
[ROW][C]alpha[/C][C]1[/C][/ROW]
[ROW][C]beta[/C][C]0.331348940076878[/C][/ROW]
[ROW][C]gamma[/C][C]FALSE[/C][/ROW]
[/TABLE]
Source: https://freestatistics.org/blog/index.php?pk=300359&T=1

Globally Unique Identifier (entire table): ba.freestatistics.org/blog/index.php?pk=300359&T=1

As an alternative you can also use a QR Code:  

The GUIDs for individual cells are displayed in the table below:

Estimated Parameters of Exponential Smoothing
ParameterValue
alpha1
beta0.331348940076878
gammaFALSE


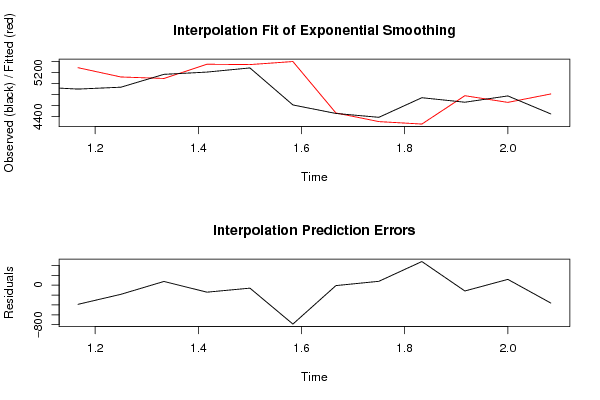
Interpolation Forecasts of Exponential Smoothing
tObservedFittedResiduals
34898.895286.68-387.79
44933.195117.99619452759-184.806194527589
55165.895091.0608578512374.8291421487711
65206.795348.55541478909-141.765414789087
75282.095342.48159485916-60.3915948591639
84611.295397.77090391303-786.480903913028
94457.384466.37129001074-8.99129001074016
104387.34309.4820355957677.817964404242
114742.64265.18693562004477.413064379956
124660.884778.6772484812-117.797248481197
134774.84657.92525505298116.87474494702
144448.54810.57157791293-362.07157791293

\begin{tabular}{lllllllll}
\hline
Interpolation Forecasts of Exponential Smoothing \tabularnewline
t & Observed & Fitted & Residuals \tabularnewline
3 & 4898.89 & 5286.68 & -387.79 \tabularnewline
4 & 4933.19 & 5117.99619452759 & -184.806194527589 \tabularnewline
5 & 5165.89 & 5091.06085785123 & 74.8291421487711 \tabularnewline
6 & 5206.79 & 5348.55541478909 & -141.765414789087 \tabularnewline
7 & 5282.09 & 5342.48159485916 & -60.3915948591639 \tabularnewline
8 & 4611.29 & 5397.77090391303 & -786.480903913028 \tabularnewline
9 & 4457.38 & 4466.37129001074 & -8.99129001074016 \tabularnewline
10 & 4387.3 & 4309.48203559576 & 77.817964404242 \tabularnewline
11 & 4742.6 & 4265.18693562004 & 477.413064379956 \tabularnewline
12 & 4660.88 & 4778.6772484812 & -117.797248481197 \tabularnewline
13 & 4774.8 & 4657.92525505298 & 116.87474494702 \tabularnewline
14 & 4448.5 & 4810.57157791293 & -362.07157791293 \tabularnewline
\hline
\end{tabular}
%Source: https://freestatistics.org/blog/index.php?pk=300359&T=2

[TABLE]
[ROW][C]Interpolation Forecasts of Exponential Smoothing[/C][/ROW]
[ROW][C]t[/C][C]Observed[/C][C]Fitted[/C][C]Residuals[/C][/ROW]
[ROW][C]3[/C][C]4898.89[/C][C]5286.68[/C][C]-387.79[/C][/ROW]
[ROW][C]4[/C][C]4933.19[/C][C]5117.99619452759[/C][C]-184.806194527589[/C][/ROW]
[ROW][C]5[/C][C]5165.89[/C][C]5091.06085785123[/C][C]74.8291421487711[/C][/ROW]
[ROW][C]6[/C][C]5206.79[/C][C]5348.55541478909[/C][C]-141.765414789087[/C][/ROW]
[ROW][C]7[/C][C]5282.09[/C][C]5342.48159485916[/C][C]-60.3915948591639[/C][/ROW]
[ROW][C]8[/C][C]4611.29[/C][C]5397.77090391303[/C][C]-786.480903913028[/C][/ROW]
[ROW][C]9[/C][C]4457.38[/C][C]4466.37129001074[/C][C]-8.99129001074016[/C][/ROW]
[ROW][C]10[/C][C]4387.3[/C][C]4309.48203559576[/C][C]77.817964404242[/C][/ROW]
[ROW][C]11[/C][C]4742.6[/C][C]4265.18693562004[/C][C]477.413064379956[/C][/ROW]
[ROW][C]12[/C][C]4660.88[/C][C]4778.6772484812[/C][C]-117.797248481197[/C][/ROW]
[ROW][C]13[/C][C]4774.8[/C][C]4657.92525505298[/C][C]116.87474494702[/C][/ROW]
[ROW][C]14[/C][C]4448.5[/C][C]4810.57157791293[/C][C]-362.07157791293[/C][/ROW]
[/TABLE]
Source: https://freestatistics.org/blog/index.php?pk=300359&T=2

Globally Unique Identifier (entire table): ba.freestatistics.org/blog/index.php?pk=300359&T=2

As an alternative you can also use a QR Code:  

The GUIDs for individual cells are displayed in the table below:

Interpolation Forecasts of Exponential Smoothing
tObservedFittedResiduals
34898.895286.68-387.79
44933.195117.99619452759-184.806194527589
55165.895091.0608578512374.8291421487711
65206.795348.55541478909-141.765414789087
75282.095342.48159485916-60.3915948591639
84611.295397.77090391303-786.480903913028
94457.384466.37129001074-8.99129001074016
104387.34309.4820355957677.817964404242
114742.64265.18693562004477.413064379956
124660.884778.6772484812-117.797248481197
134774.84657.92525505298116.87474494702
144448.54810.57157791293-362.07157791293


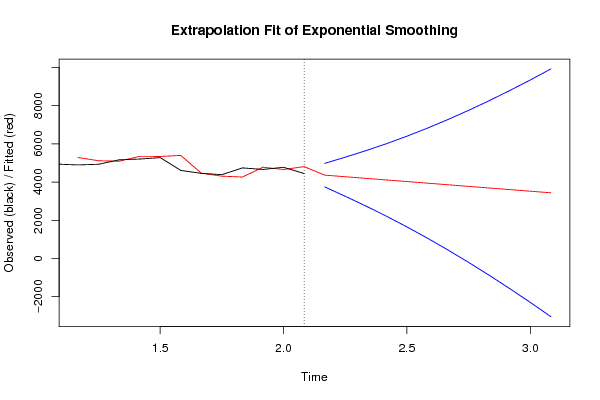
Extrapolation Forecasts of Exponential Smoothing
tForecast95% Lower Bound95% Upper Bound
154364.299544339523749.141199161674979.45788951737
164280.099088679043255.811491040235304.38668631784
174195.898633018552748.372847036895643.42441900022
184111.698177358072214.328348664926009.06800605123
194027.497721697591651.302401040196403.69304235499
203943.297266037111059.324012295586827.27051977864
213859.09681037662439.1406896113337279.05293114192
223774.89635471614-208.2925239189357758.08523335122
233690.69589905566-881.9923775537058263.38417566503
243606.49544339518-1581.01341793838794.00430472865
253522.2949877347-2304.470753135429349.06072860481
263438.09453207421-3051.545329637019927.73439378544

\begin{tabular}{lllllllll}
\hline
Extrapolation Forecasts of Exponential Smoothing \tabularnewline
t & Forecast & 95% Lower Bound & 95% Upper Bound \tabularnewline
15 & 4364.29954433952 & 3749.14119916167 & 4979.45788951737 \tabularnewline
16 & 4280.09908867904 & 3255.81149104023 & 5304.38668631784 \tabularnewline
17 & 4195.89863301855 & 2748.37284703689 & 5643.42441900022 \tabularnewline
18 & 4111.69817735807 & 2214.32834866492 & 6009.06800605123 \tabularnewline
19 & 4027.49772169759 & 1651.30240104019 & 6403.69304235499 \tabularnewline
20 & 3943.29726603711 & 1059.32401229558 & 6827.27051977864 \tabularnewline
21 & 3859.09681037662 & 439.140689611333 & 7279.05293114192 \tabularnewline
22 & 3774.89635471614 & -208.292523918935 & 7758.08523335122 \tabularnewline
23 & 3690.69589905566 & -881.992377553705 & 8263.38417566503 \tabularnewline
24 & 3606.49544339518 & -1581.0134179383 & 8794.00430472865 \tabularnewline
25 & 3522.2949877347 & -2304.47075313542 & 9349.06072860481 \tabularnewline
26 & 3438.09453207421 & -3051.54532963701 & 9927.73439378544 \tabularnewline
\hline
\end{tabular}
%Source: https://freestatistics.org/blog/index.php?pk=300359&T=3

[TABLE]
[ROW][C]Extrapolation Forecasts of Exponential Smoothing[/C][/ROW]
[ROW][C]t[/C][C]Forecast[/C][C]95% Lower Bound[/C][C]95% Upper Bound[/C][/ROW]
[ROW][C]15[/C][C]4364.29954433952[/C][C]3749.14119916167[/C][C]4979.45788951737[/C][/ROW]
[ROW][C]16[/C][C]4280.09908867904[/C][C]3255.81149104023[/C][C]5304.38668631784[/C][/ROW]
[ROW][C]17[/C][C]4195.89863301855[/C][C]2748.37284703689[/C][C]5643.42441900022[/C][/ROW]
[ROW][C]18[/C][C]4111.69817735807[/C][C]2214.32834866492[/C][C]6009.06800605123[/C][/ROW]
[ROW][C]19[/C][C]4027.49772169759[/C][C]1651.30240104019[/C][C]6403.69304235499[/C][/ROW]
[ROW][C]20[/C][C]3943.29726603711[/C][C]1059.32401229558[/C][C]6827.27051977864[/C][/ROW]
[ROW][C]21[/C][C]3859.09681037662[/C][C]439.140689611333[/C][C]7279.05293114192[/C][/ROW]
[ROW][C]22[/C][C]3774.89635471614[/C][C]-208.292523918935[/C][C]7758.08523335122[/C][/ROW]
[ROW][C]23[/C][C]3690.69589905566[/C][C]-881.992377553705[/C][C]8263.38417566503[/C][/ROW]
[ROW][C]24[/C][C]3606.49544339518[/C][C]-1581.0134179383[/C][C]8794.00430472865[/C][/ROW]
[ROW][C]25[/C][C]3522.2949877347[/C][C]-2304.47075313542[/C][C]9349.06072860481[/C][/ROW]
[ROW][C]26[/C][C]3438.09453207421[/C][C]-3051.54532963701[/C][C]9927.73439378544[/C][/ROW]
[/TABLE]
Source: https://freestatistics.org/blog/index.php?pk=300359&T=3

Globally Unique Identifier (entire table): ba.freestatistics.org/blog/index.php?pk=300359&T=3

As an alternative you can also use a QR Code:  

The GUIDs for individual cells are displayed in the table below:

Extrapolation Forecasts of Exponential Smoothing
tForecast95% Lower Bound95% Upper Bound
154364.299544339523749.141199161674979.45788951737
164280.099088679043255.811491040235304.38668631784
174195.898633018552748.372847036895643.42441900022
184111.698177358072214.328348664926009.06800605123
194027.497721697591651.302401040196403.69304235499
203943.297266037111059.324012295586827.27051977864
213859.09681037662439.1406896113337279.05293114192
223774.89635471614-208.2925239189357758.08523335122
233690.69589905566-881.9923775537058263.38417566503
243606.49544339518-1581.01341793838794.00430472865
253522.2949877347-2304.470753135429349.06072860481
263438.09453207421-3051.545329637019927.73439378544


Parameters (Session):
par1 = FALSE ; par2 = 1 ; par3 = 2 ; par4 = 0 ; par5 = 1 ; par6 = 3 ; par7 = 1 ; par8 = 2 ; par9 = 0 ;
Parameters (R input):
par1 = 12 ; par2 = Double ; par3 = additive ; par4 = 12 ;
R code (references can be found in the software module):
par1 <- as.numeric(par1)
par4 <- as.numeric(par4)
if (par2 == 'Single') K <- 1
if (par2 == 'Double') K <- 2
if (par2 == 'Triple') K <- par1
nx <- length(x)
nxmK <- nx - K
x <- ts(x, frequency = par1)
if (par2 == 'Single') fit <- HoltWinters(x, gamma=F, beta=F)
if (par2 == 'Double') fit <- HoltWinters(x, gamma=F)
if (par2 == 'Triple') fit <- HoltWinters(x, seasonal=par3)
fit
myresid <- x - fit$fitted[,'xhat']
bitmap(file='test1.png')
op <- par(mfrow=c(2,1))
plot(fit,ylab='Observed (black) / Fitted (red)',main='Interpolation Fit of Exponential Smoothing')
plot(myresid,ylab='Residuals',main='Interpolation Prediction Errors')
par(op)
dev.off()
bitmap(file='test2.png')
p <- predict(fit, par4, prediction.interval=TRUE)
np <- length(p[,1])
plot(fit,p,ylab='Observed (black) / Fitted (red)',main='Extrapolation Fit of Exponential Smoothing')
dev.off()
bitmap(file='test3.png')
op <- par(mfrow = c(2,2))
acf(as.numeric(myresid),lag.max = nx/2,main='Residual ACF')
spectrum(myresid,main='Residals Periodogram')
cpgram(myresid,main='Residal Cumulative Periodogram')
qqnorm(myresid,main='Residual Normal QQ Plot')
qqline(myresid)
par(op)
dev.off()
load(file='createtable')
a<-table.start()
a<-table.row.start(a)
a<-table.element(a,'Estimated Parameters of Exponential Smoothing',2,TRUE)
a<-table.row.end(a)
a<-table.row.start(a)
a<-table.element(a,'Parameter',header=TRUE)
a<-table.element(a,'Value',header=TRUE)
a<-table.row.end(a)
a<-table.row.start(a)
a<-table.element(a,'alpha',header=TRUE)
a<-table.element(a,fit$alpha)
a<-table.row.end(a)
a<-table.row.start(a)
a<-table.element(a,'beta',header=TRUE)
a<-table.element(a,fit$beta)
a<-table.row.end(a)
a<-table.row.start(a)
a<-table.element(a,'gamma',header=TRUE)
a<-table.element(a,fit$gamma)
a<-table.row.end(a)
a<-table.end(a)
table.save(a,file='mytable.tab')
a<-table.start()
a<-table.row.start(a)
a<-table.element(a,'Interpolation Forecasts of Exponential Smoothing',4,TRUE)
a<-table.row.end(a)
a<-table.row.start(a)
a<-table.element(a,'t',header=TRUE)
a<-table.element(a,'Observed',header=TRUE)
a<-table.element(a,'Fitted',header=TRUE)
a<-table.element(a,'Residuals',header=TRUE)
a<-table.row.end(a)
for (i in 1:nxmK) {
a<-table.row.start(a)
a<-table.element(a,i+K,header=TRUE)
a<-table.element(a,x[i+K])
a<-table.element(a,fit$fitted[i,'xhat'])
a<-table.element(a,myresid[i])
a<-table.row.end(a)
}
a<-table.end(a)
table.save(a,file='mytable1.tab')
a<-table.start()
a<-table.row.start(a)
a<-table.element(a,'Extrapolation Forecasts of Exponential Smoothing',4,TRUE)
a<-table.row.end(a)
a<-table.row.start(a)
a<-table.element(a,'t',header=TRUE)
a<-table.element(a,'Forecast',header=TRUE)
a<-table.element(a,'95% Lower Bound',header=TRUE)
a<-table.element(a,'95% Upper Bound',header=TRUE)
a<-table.row.end(a)
for (i in 1:np) {
a<-table.row.start(a)
a<-table.element(a,nx+i,header=TRUE)
a<-table.element(a,p[i,'fit'])
a<-table.element(a,p[i,'lwr'])
a<-table.element(a,p[i,'upr'])
a<-table.row.end(a)
}
a<-table.end(a)
table.save(a,file='mytable2.tab')