Free Statistics

of Irreproducible Research!

Author's title

Author*The author of this computation has been verified*
R Software Modulerwasp_autocorrelation.wasp
Title produced by software(Partial) Autocorrelation Function
Date of computationFri, 16 Dec 2016 16:30:48 +0100
Cite this page as followsStatistical Computations at FreeStatistics.org, Office for Research Development and Education, URL https://freestatistics.org/blog/index.php?v=date/2016/Dec/16/t1481902336tf75jcl5mz2nflp.htm/, Retrieved Thu, 02 May 2024 14:07:32 +0000
Statistical Computations at FreeStatistics.org, Office for Research Development and Education, URL https://freestatistics.org/blog/index.php?pk=300367, Retrieved Thu, 02 May 2024 14:07:32 +0000
QR Codes:

Original text written by user:
IsPrivate?No (this computation is public)
User-defined keywords
Estimated Impact64
Family? (F = Feedback message, R = changed R code, M = changed R Module, P = changed Parameters, D = changed Data)
-     [ARIMA Backward Selection] [] [2016-12-16 13:36:55] [683f400e1b95307fc738e729f07c4fce]
-    D  [ARIMA Backward Selection] [] [2016-12-16 14:17:56] [683f400e1b95307fc738e729f07c4fce]
- R  D    [ARIMA Backward Selection] [] [2016-12-16 14:51:40] [683f400e1b95307fc738e729f07c4fce]
- RM D        [(Partial) Autocorrelation Function] [] [2016-12-16 15:30:48] [404ac5ee4f7301873f6a96ef36861981] [Current]
Feedback Forum

Post a new message
Dataseries X:
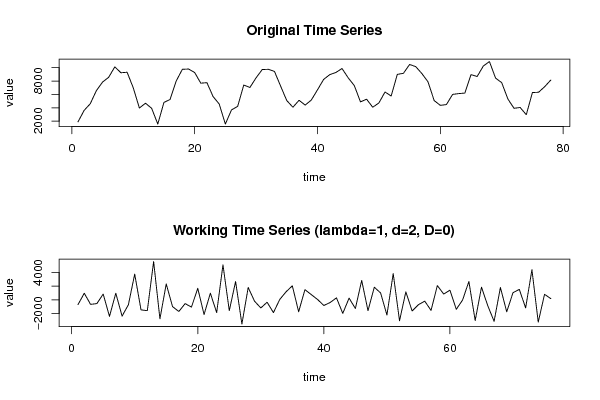
1880
3600
4600
6560
7840
8560
10120
9240
9320
7000
3960
4680
3920
1560
4800
5240
8000
9760
9800
9280
7680
7760
5680
4560
1560
3680
4200
7400
7040
8480
9720
9760
9440
7240
5080
4080
5120
4400
5160
6680
8240
8960
9280
9880
8480
7320
4880
5280
4080
4720
6360
5760
9000
9160
10480
10160
9120
7880
5080
4360
4480
6000
6120
6200
8960
8680
10240
10920
8440
7760
5320
3920
4040
2960
6280
6320
7160
8160


Summary of computational transaction
Raw Input view raw input (R code)
Raw Outputview raw output of R engine
Computing time1 seconds
R ServerBig Analytics Cloud Computing Center

\begin{tabular}{lllllllll}
\hline
Summary of computational transaction \tabularnewline
Raw Input view raw input (R code)  \tabularnewline
Raw Outputview raw output of R engine  \tabularnewline
Computing time1 seconds \tabularnewline
R ServerBig Analytics Cloud Computing Center \tabularnewline
\hline
\end{tabular}
%Source: https://freestatistics.org/blog/index.php?pk=300367&T=0

[TABLE]
[ROW]
Summary of computational transaction[/C][/ROW] [ROW]Raw Input[/C] view raw input (R code) [/C][/ROW] [ROW]Raw Output[/C]view raw output of R engine [/C][/ROW] [ROW]Computing time[/C]1 seconds[/C][/ROW] [ROW]R Server[/C]Big Analytics Cloud Computing Center[/C][/ROW] [/TABLE] Source: https://freestatistics.org/blog/index.php?pk=300367&T=0

Globally Unique Identifier (entire table): ba.freestatistics.org/blog/index.php?pk=300367&T=0

As an alternative you can also use a QR Code:  

The GUIDs for individual cells are displayed in the table below:

Summary of computational transaction
Raw Input view raw input (R code)
Raw Outputview raw output of R engine
Computing time1 seconds
R ServerBig Analytics Cloud Computing Center


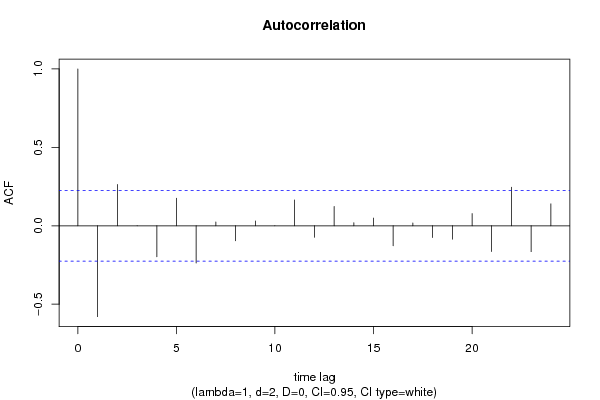
Autocorrelation Function
Time lag kACF(k)T-STATP-value
1-0.579429-5.05131e-06
20.2629522.29240.012327
30.0001150.0010.499601
4-0.19714-1.71860.044877
50.1751571.5270.065459
6-0.237605-2.07140.020858
70.024330.21210.416295
8-0.0954-0.83170.204098
90.030280.2640.396256
10-0.000246-0.00210.499148
110.1648911.43750.077342
12-0.073329-0.63930.262285
130.1234011.07580.142713
140.0193650.16880.433192
150.0488250.42560.335786
16-0.127874-1.11480.134229
170.0181180.15790.437458
18-0.075134-0.6550.25722
19-0.085379-0.74430.229491
200.0774550.67520.250788
21-0.163977-1.42950.078477
220.245762.14250.017678
23-0.164742-1.43620.077526
240.1399811.22030.113057

\begin{tabular}{lllllllll}
\hline
Autocorrelation Function \tabularnewline
Time lag k & ACF(k) & T-STAT & P-value \tabularnewline
1 & -0.579429 & -5.0513 & 1e-06 \tabularnewline
2 & 0.262952 & 2.2924 & 0.012327 \tabularnewline
3 & 0.000115 & 0.001 & 0.499601 \tabularnewline
4 & -0.19714 & -1.7186 & 0.044877 \tabularnewline
5 & 0.175157 & 1.527 & 0.065459 \tabularnewline
6 & -0.237605 & -2.0714 & 0.020858 \tabularnewline
7 & 0.02433 & 0.2121 & 0.416295 \tabularnewline
8 & -0.0954 & -0.8317 & 0.204098 \tabularnewline
9 & 0.03028 & 0.264 & 0.396256 \tabularnewline
10 & -0.000246 & -0.0021 & 0.499148 \tabularnewline
11 & 0.164891 & 1.4375 & 0.077342 \tabularnewline
12 & -0.073329 & -0.6393 & 0.262285 \tabularnewline
13 & 0.123401 & 1.0758 & 0.142713 \tabularnewline
14 & 0.019365 & 0.1688 & 0.433192 \tabularnewline
15 & 0.048825 & 0.4256 & 0.335786 \tabularnewline
16 & -0.127874 & -1.1148 & 0.134229 \tabularnewline
17 & 0.018118 & 0.1579 & 0.437458 \tabularnewline
18 & -0.075134 & -0.655 & 0.25722 \tabularnewline
19 & -0.085379 & -0.7443 & 0.229491 \tabularnewline
20 & 0.077455 & 0.6752 & 0.250788 \tabularnewline
21 & -0.163977 & -1.4295 & 0.078477 \tabularnewline
22 & 0.24576 & 2.1425 & 0.017678 \tabularnewline
23 & -0.164742 & -1.4362 & 0.077526 \tabularnewline
24 & 0.139981 & 1.2203 & 0.113057 \tabularnewline
\hline
\end{tabular}
%Source: https://freestatistics.org/blog/index.php?pk=300367&T=1

[TABLE]
[ROW][C]Autocorrelation Function[/C][/ROW]
[ROW][C]Time lag k[/C][C]ACF(k)[/C][C]T-STAT[/C][C]P-value[/C][/ROW]
[ROW][C]1[/C][C]-0.579429[/C][C]-5.0513[/C][C]1e-06[/C][/ROW]
[ROW][C]2[/C][C]0.262952[/C][C]2.2924[/C][C]0.012327[/C][/ROW]
[ROW][C]3[/C][C]0.000115[/C][C]0.001[/C][C]0.499601[/C][/ROW]
[ROW][C]4[/C][C]-0.19714[/C][C]-1.7186[/C][C]0.044877[/C][/ROW]
[ROW][C]5[/C][C]0.175157[/C][C]1.527[/C][C]0.065459[/C][/ROW]
[ROW][C]6[/C][C]-0.237605[/C][C]-2.0714[/C][C]0.020858[/C][/ROW]
[ROW][C]7[/C][C]0.02433[/C][C]0.2121[/C][C]0.416295[/C][/ROW]
[ROW][C]8[/C][C]-0.0954[/C][C]-0.8317[/C][C]0.204098[/C][/ROW]
[ROW][C]9[/C][C]0.03028[/C][C]0.264[/C][C]0.396256[/C][/ROW]
[ROW][C]10[/C][C]-0.000246[/C][C]-0.0021[/C][C]0.499148[/C][/ROW]
[ROW][C]11[/C][C]0.164891[/C][C]1.4375[/C][C]0.077342[/C][/ROW]
[ROW][C]12[/C][C]-0.073329[/C][C]-0.6393[/C][C]0.262285[/C][/ROW]
[ROW][C]13[/C][C]0.123401[/C][C]1.0758[/C][C]0.142713[/C][/ROW]
[ROW][C]14[/C][C]0.019365[/C][C]0.1688[/C][C]0.433192[/C][/ROW]
[ROW][C]15[/C][C]0.048825[/C][C]0.4256[/C][C]0.335786[/C][/ROW]
[ROW][C]16[/C][C]-0.127874[/C][C]-1.1148[/C][C]0.134229[/C][/ROW]
[ROW][C]17[/C][C]0.018118[/C][C]0.1579[/C][C]0.437458[/C][/ROW]
[ROW][C]18[/C][C]-0.075134[/C][C]-0.655[/C][C]0.25722[/C][/ROW]
[ROW][C]19[/C][C]-0.085379[/C][C]-0.7443[/C][C]0.229491[/C][/ROW]
[ROW][C]20[/C][C]0.077455[/C][C]0.6752[/C][C]0.250788[/C][/ROW]
[ROW][C]21[/C][C]-0.163977[/C][C]-1.4295[/C][C]0.078477[/C][/ROW]
[ROW][C]22[/C][C]0.24576[/C][C]2.1425[/C][C]0.017678[/C][/ROW]
[ROW][C]23[/C][C]-0.164742[/C][C]-1.4362[/C][C]0.077526[/C][/ROW]
[ROW][C]24[/C][C]0.139981[/C][C]1.2203[/C][C]0.113057[/C][/ROW]
[/TABLE]
Source: https://freestatistics.org/blog/index.php?pk=300367&T=1

Globally Unique Identifier (entire table): ba.freestatistics.org/blog/index.php?pk=300367&T=1

As an alternative you can also use a QR Code:  

The GUIDs for individual cells are displayed in the table below:

Autocorrelation Function
Time lag kACF(k)T-STATP-value
1-0.579429-5.05131e-06
20.2629522.29240.012327
30.0001150.0010.499601
4-0.19714-1.71860.044877
50.1751571.5270.065459
6-0.237605-2.07140.020858
70.024330.21210.416295
8-0.0954-0.83170.204098
90.030280.2640.396256
10-0.000246-0.00210.499148
110.1648911.43750.077342
12-0.073329-0.63930.262285
130.1234011.07580.142713
140.0193650.16880.433192
150.0488250.42560.335786
16-0.127874-1.11480.134229
170.0181180.15790.437458
18-0.075134-0.6550.25722
19-0.085379-0.74430.229491
200.0774550.67520.250788
21-0.163977-1.42950.078477
220.245762.14250.017678
23-0.164742-1.43620.077526
240.1399811.22030.113057


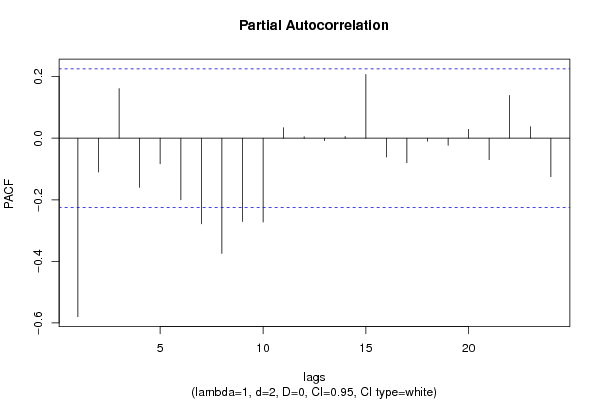
Partial Autocorrelation Function
Time lag kPACF(k)T-STATP-value
1-0.579429-5.05131e-06
2-0.109576-0.95530.171238
30.1610281.40380.082224
4-0.159829-1.39340.083787
5-0.083009-0.72370.235751
6-0.19986-1.74230.042747
7-0.277767-2.42150.00892
8-0.374068-3.26110.000831
9-0.270512-2.35830.010466
10-0.272106-2.37220.010108
110.0340210.29660.383794
120.0045210.03940.484333
13-0.007958-0.06940.472437
140.0055220.04810.480866
150.206851.80330.037654
16-0.061248-0.53390.297469
17-0.079821-0.69590.244318
18-0.009707-0.08460.466391
19-0.022925-0.19990.421063
200.0287450.25060.401404
21-0.069532-0.60620.273106
220.1386781.2090.115211
230.0373220.32540.3729
24-0.124909-1.08890.139813

\begin{tabular}{lllllllll}
\hline
Partial Autocorrelation Function \tabularnewline
Time lag k & PACF(k) & T-STAT & P-value \tabularnewline
1 & -0.579429 & -5.0513 & 1e-06 \tabularnewline
2 & -0.109576 & -0.9553 & 0.171238 \tabularnewline
3 & 0.161028 & 1.4038 & 0.082224 \tabularnewline
4 & -0.159829 & -1.3934 & 0.083787 \tabularnewline
5 & -0.083009 & -0.7237 & 0.235751 \tabularnewline
6 & -0.19986 & -1.7423 & 0.042747 \tabularnewline
7 & -0.277767 & -2.4215 & 0.00892 \tabularnewline
8 & -0.374068 & -3.2611 & 0.000831 \tabularnewline
9 & -0.270512 & -2.3583 & 0.010466 \tabularnewline
10 & -0.272106 & -2.3722 & 0.010108 \tabularnewline
11 & 0.034021 & 0.2966 & 0.383794 \tabularnewline
12 & 0.004521 & 0.0394 & 0.484333 \tabularnewline
13 & -0.007958 & -0.0694 & 0.472437 \tabularnewline
14 & 0.005522 & 0.0481 & 0.480866 \tabularnewline
15 & 0.20685 & 1.8033 & 0.037654 \tabularnewline
16 & -0.061248 & -0.5339 & 0.297469 \tabularnewline
17 & -0.079821 & -0.6959 & 0.244318 \tabularnewline
18 & -0.009707 & -0.0846 & 0.466391 \tabularnewline
19 & -0.022925 & -0.1999 & 0.421063 \tabularnewline
20 & 0.028745 & 0.2506 & 0.401404 \tabularnewline
21 & -0.069532 & -0.6062 & 0.273106 \tabularnewline
22 & 0.138678 & 1.209 & 0.115211 \tabularnewline
23 & 0.037322 & 0.3254 & 0.3729 \tabularnewline
24 & -0.124909 & -1.0889 & 0.139813 \tabularnewline
\hline
\end{tabular}
%Source: https://freestatistics.org/blog/index.php?pk=300367&T=2

[TABLE]
[ROW][C]Partial Autocorrelation Function[/C][/ROW]
[ROW][C]Time lag k[/C][C]PACF(k)[/C][C]T-STAT[/C][C]P-value[/C][/ROW]
[ROW][C]1[/C][C]-0.579429[/C][C]-5.0513[/C][C]1e-06[/C][/ROW]
[ROW][C]2[/C][C]-0.109576[/C][C]-0.9553[/C][C]0.171238[/C][/ROW]
[ROW][C]3[/C][C]0.161028[/C][C]1.4038[/C][C]0.082224[/C][/ROW]
[ROW][C]4[/C][C]-0.159829[/C][C]-1.3934[/C][C]0.083787[/C][/ROW]
[ROW][C]5[/C][C]-0.083009[/C][C]-0.7237[/C][C]0.235751[/C][/ROW]
[ROW][C]6[/C][C]-0.19986[/C][C]-1.7423[/C][C]0.042747[/C][/ROW]
[ROW][C]7[/C][C]-0.277767[/C][C]-2.4215[/C][C]0.00892[/C][/ROW]
[ROW][C]8[/C][C]-0.374068[/C][C]-3.2611[/C][C]0.000831[/C][/ROW]
[ROW][C]9[/C][C]-0.270512[/C][C]-2.3583[/C][C]0.010466[/C][/ROW]
[ROW][C]10[/C][C]-0.272106[/C][C]-2.3722[/C][C]0.010108[/C][/ROW]
[ROW][C]11[/C][C]0.034021[/C][C]0.2966[/C][C]0.383794[/C][/ROW]
[ROW][C]12[/C][C]0.004521[/C][C]0.0394[/C][C]0.484333[/C][/ROW]
[ROW][C]13[/C][C]-0.007958[/C][C]-0.0694[/C][C]0.472437[/C][/ROW]
[ROW][C]14[/C][C]0.005522[/C][C]0.0481[/C][C]0.480866[/C][/ROW]
[ROW][C]15[/C][C]0.20685[/C][C]1.8033[/C][C]0.037654[/C][/ROW]
[ROW][C]16[/C][C]-0.061248[/C][C]-0.5339[/C][C]0.297469[/C][/ROW]
[ROW][C]17[/C][C]-0.079821[/C][C]-0.6959[/C][C]0.244318[/C][/ROW]
[ROW][C]18[/C][C]-0.009707[/C][C]-0.0846[/C][C]0.466391[/C][/ROW]
[ROW][C]19[/C][C]-0.022925[/C][C]-0.1999[/C][C]0.421063[/C][/ROW]
[ROW][C]20[/C][C]0.028745[/C][C]0.2506[/C][C]0.401404[/C][/ROW]
[ROW][C]21[/C][C]-0.069532[/C][C]-0.6062[/C][C]0.273106[/C][/ROW]
[ROW][C]22[/C][C]0.138678[/C][C]1.209[/C][C]0.115211[/C][/ROW]
[ROW][C]23[/C][C]0.037322[/C][C]0.3254[/C][C]0.3729[/C][/ROW]
[ROW][C]24[/C][C]-0.124909[/C][C]-1.0889[/C][C]0.139813[/C][/ROW]
[/TABLE]
Source: https://freestatistics.org/blog/index.php?pk=300367&T=2

Globally Unique Identifier (entire table): ba.freestatistics.org/blog/index.php?pk=300367&T=2

As an alternative you can also use a QR Code:  

The GUIDs for individual cells are displayed in the table below:

Partial Autocorrelation Function
Time lag kPACF(k)T-STATP-value
1-0.579429-5.05131e-06
2-0.109576-0.95530.171238
30.1610281.40380.082224
4-0.159829-1.39340.083787
5-0.083009-0.72370.235751
6-0.19986-1.74230.042747
7-0.277767-2.42150.00892
8-0.374068-3.26110.000831
9-0.270512-2.35830.010466
10-0.272106-2.37220.010108
110.0340210.29660.383794
120.0045210.03940.484333
13-0.007958-0.06940.472437
140.0055220.04810.480866
150.206851.80330.037654
16-0.061248-0.53390.297469
17-0.079821-0.69590.244318
18-0.009707-0.08460.466391
19-0.022925-0.19990.421063
200.0287450.25060.401404
21-0.069532-0.60620.273106
220.1386781.2090.115211
230.0373220.32540.3729
24-0.124909-1.08890.139813


Parameters (Session):
par1 = FALSE ; par2 = 1 ; par3 = 2 ; par4 = 0 ; par5 = 1 ; par6 = 3 ; par7 = 1 ; par8 = 2 ; par9 = 0 ;
Parameters (R input):
par1 = 24 ; par2 = 1 ; par3 = 2 ; par4 = 0 ; par5 = 1 ; par6 = White Noise ; par7 = 0.95 ; par8 = ;
R code (references can be found in the software module):
par8 <- ''
par7 <- '0.95'
par6 <- 'White Noise'
par5 <- '1'
par4 <- '0'
par3 <- '2'
par2 <- '1'
par1 <- '48'
if (par1 == 'Default') {
par1 = 10*log10(length(x))
} else {
par1 <- as.numeric(par1)
}
par2 <- as.numeric(par2)
par3 <- as.numeric(par3)
par4 <- as.numeric(par4)
par5 <- as.numeric(par5)
if (par6 == 'White Noise') par6 <- 'white' else par6 <- 'ma'
par7 <- as.numeric(par7)
if (par8 != '') par8 <- as.numeric(par8)
x <- na.omit(x)
ox <- x
if (par8 == '') {
if (par2 == 0) {
x <- log(x)
} else {
x <- (x ^ par2 - 1) / par2
}
} else {
x <- log(x,base=par8)
}
if (par3 > 0) x <- diff(x,lag=1,difference=par3)
if (par4 > 0) x <- diff(x,lag=par5,difference=par4)
bitmap(file='picts.png')
op <- par(mfrow=c(2,1))
plot(ox,type='l',main='Original Time Series',xlab='time',ylab='value')
if (par8=='') {
mytitle <- paste('Working Time Series (lambda=',par2,', d=',par3,', D=',par4,')',sep='')
mysub <- paste('(lambda=',par2,', d=',par3,', D=',par4,', CI=', par7, ', CI type=',par6,')',sep='')
} else {
mytitle <- paste('Working Time Series (base=',par8,', d=',par3,', D=',par4,')',sep='')
mysub <- paste('(base=',par8,', d=',par3,', D=',par4,', CI=', par7, ', CI type=',par6,')',sep='')
}
plot(x,type='l', main=mytitle,xlab='time',ylab='value')
par(op)
dev.off()
bitmap(file='pic1.png')
racf <- acf(x, par1, main='Autocorrelation', xlab='time lag', ylab='ACF', ci.type=par6, ci=par7, sub=mysub)
dev.off()
bitmap(file='pic2.png')
rpacf <- pacf(x,par1,main='Partial Autocorrelation',xlab='lags',ylab='PACF',sub=mysub)
dev.off()
(myacf <- c(racf$acf))
(mypacf <- c(rpacf$acf))
lengthx <- length(x)
sqrtn <- sqrt(lengthx)
load(file='createtable')
a<-table.start()
a<-table.row.start(a)
a<-table.element(a,'Autocorrelation Function',4,TRUE)
a<-table.row.end(a)
a<-table.row.start(a)
a<-table.element(a,'Time lag k',header=TRUE)
a<-table.element(a,'ACF(k)',header=TRUE)
a<-table.element(a,'T-STAT',header=TRUE)
a<-table.element(a,'P-value',header=TRUE)
a<-table.row.end(a)
for (i in 2:(par1+1)) {
a<-table.row.start(a)
a<-table.element(a,i-1,header=TRUE)
a<-table.element(a,round(myacf[i],6))
mytstat <- myacf[i]*sqrtn
a<-table.element(a,round(mytstat,4))
a<-table.element(a,round(1-pt(abs(mytstat),lengthx),6))
a<-table.row.end(a)
}
a<-table.end(a)
table.save(a,file='mytable.tab')
a<-table.start()
a<-table.row.start(a)
a<-table.element(a,'Partial Autocorrelation Function',4,TRUE)
a<-table.row.end(a)
a<-table.row.start(a)
a<-table.element(a,'Time lag k',header=TRUE)
a<-table.element(a,'PACF(k)',header=TRUE)
a<-table.element(a,'T-STAT',header=TRUE)
a<-table.element(a,'P-value',header=TRUE)
a<-table.row.end(a)
for (i in 1:par1) {
a<-table.row.start(a)
a<-table.element(a,i,header=TRUE)
a<-table.element(a,round(mypacf[i],6))
mytstat <- mypacf[i]*sqrtn
a<-table.element(a,round(mytstat,4))
a<-table.element(a,round(1-pt(abs(mytstat),lengthx),6))
a<-table.row.end(a)
}
a<-table.end(a)
table.save(a,file='mytable1.tab')