Free Statistics

of Irreproducible Research!

Author's title

Author*The author of this computation has been verified*
R Software Modulerwasp_arimabackwardselection.wasp
Title produced by softwareARIMA Backward Selection
Date of computationFri, 16 Dec 2016 16:39:24 +0100
Cite this page as followsStatistical Computations at FreeStatistics.org, Office for Research Development and Education, URL https://freestatistics.org/blog/index.php?v=date/2016/Dec/16/t14819029311q5uqocguh9f35y.htm/, Retrieved Thu, 02 May 2024 14:43:17 +0000
Statistical Computations at FreeStatistics.org, Office for Research Development and Education, URL https://freestatistics.org/blog/index.php?pk=300380, Retrieved Thu, 02 May 2024 14:43:17 +0000
QR Codes:

Original text written by user:
IsPrivate?No (this computation is public)
User-defined keywords
Estimated Impact45
Family? (F = Feedback message, R = changed R code, M = changed R Module, P = changed Parameters, D = changed Data)
-       [ARIMA Backward Selection] [] [2016-12-16 15:39:24] [9b171b8beffcb53bb49a1e7c02b89c12] [Current]
Feedback Forum

Post a new message
Dataseries X:
4865
5025
5135
5235
5290
5335
5350
5360
5350
5320
5285
5235
5185
5120
5065
4995
4990
4960
4955
4960
4965
4980
5005
5040
5095
5165
5215
5275
5320
5370
5445
5535
5585
5650
5695
5715
5935
6010
6085
6155
6210
6270
6370
6440
6490
6580
6655
6695
6905
7070
7200
7315
7225
7300
7335
7340
7320
7275
7220
7160
7015
6870
6610
6430
6330
6240
6210
6185
6185
6185
6205
6250
6310
6405
6515
6655
6795
6945
7100
7260


Summary of computational transaction
Raw Input view raw input (R code)
Raw Outputview raw output of R engine
Computing time3 seconds
R ServerBig Analytics Cloud Computing Center

\begin{tabular}{lllllllll}
\hline
Summary of computational transaction \tabularnewline
Raw Input view raw input (R code)  \tabularnewline
Raw Outputview raw output of R engine  \tabularnewline
Computing time3 seconds \tabularnewline
R ServerBig Analytics Cloud Computing Center \tabularnewline
\hline
\end{tabular}
%Source: https://freestatistics.org/blog/index.php?pk=300380&T=0

[TABLE]
[ROW]
Summary of computational transaction[/C][/ROW] [ROW]Raw Input[/C] view raw input (R code) [/C][/ROW] [ROW]Raw Output[/C]view raw output of R engine [/C][/ROW] [ROW]Computing time[/C]3 seconds[/C][/ROW] [ROW]R Server[/C]Big Analytics Cloud Computing Center[/C][/ROW] [/TABLE] Source: https://freestatistics.org/blog/index.php?pk=300380&T=0

Globally Unique Identifier (entire table): ba.freestatistics.org/blog/index.php?pk=300380&T=0

As an alternative you can also use a QR Code:  

The GUIDs for individual cells are displayed in the table below:

Summary of computational transaction
Raw Input view raw input (R code)
Raw Outputview raw output of R engine
Computing time3 seconds
R ServerBig Analytics Cloud Computing Center


ARIMA Parameter Estimation and Backward Selection
Iterationar1ar2ar3ma1
Estimates ( 1 )-0.7683-0.12350.16430.4358
(p-val)(0.0142 )(0.496 )(0.1666 )(0.1451 )
Estimates ( 2 )-0.603600.21090.3011
(p-val)(0.0113 )(NA )(0.0408 )(0.2863 )
Estimates ( 3 )-0.35800.14870
(p-val)(0.001 )(NA )(0.1566 )(NA )
Estimates ( 4 )-0.3464000
(p-val)(0.0016 )(NA )(NA )(NA )
Estimates ( 5 )NANANANA
(p-val)(NA )(NA )(NA )(NA )
Estimates ( 6 )NANANANA
(p-val)(NA )(NA )(NA )(NA )
Estimates ( 7 )NANANANA
(p-val)(NA )(NA )(NA )(NA )

\begin{tabular}{lllllllll}
\hline
ARIMA Parameter Estimation and Backward Selection \tabularnewline
Iteration & ar1 & ar2 & ar3 & ma1 \tabularnewline
Estimates ( 1 ) & -0.7683 & -0.1235 & 0.1643 & 0.4358 \tabularnewline
(p-val) & (0.0142 ) & (0.496 ) & (0.1666 ) & (0.1451 ) \tabularnewline
Estimates ( 2 ) & -0.6036 & 0 & 0.2109 & 0.3011 \tabularnewline
(p-val) & (0.0113 ) & (NA ) & (0.0408 ) & (0.2863 ) \tabularnewline
Estimates ( 3 ) & -0.358 & 0 & 0.1487 & 0 \tabularnewline
(p-val) & (0.001 ) & (NA ) & (0.1566 ) & (NA ) \tabularnewline
Estimates ( 4 ) & -0.3464 & 0 & 0 & 0 \tabularnewline
(p-val) & (0.0016 ) & (NA ) & (NA ) & (NA ) \tabularnewline
Estimates ( 5 ) & NA & NA & NA & NA \tabularnewline
(p-val) & (NA ) & (NA ) & (NA ) & (NA ) \tabularnewline
Estimates ( 6 ) & NA & NA & NA & NA \tabularnewline
(p-val) & (NA ) & (NA ) & (NA ) & (NA ) \tabularnewline
Estimates ( 7 ) & NA & NA & NA & NA \tabularnewline
(p-val) & (NA ) & (NA ) & (NA ) & (NA ) \tabularnewline
\hline
\end{tabular}
%Source: https://freestatistics.org/blog/index.php?pk=300380&T=1

[TABLE]
[ROW][C]ARIMA Parameter Estimation and Backward Selection[/C][/ROW]
[ROW][C]Iteration[/C][C]ar1[/C][C]ar2[/C][C]ar3[/C][C]ma1[/C][/ROW]
[ROW][C]Estimates ( 1 )[/C][C]-0.7683[/C][C]-0.1235[/C][C]0.1643[/C][C]0.4358[/C][/ROW]
[ROW][C](p-val)[/C][C](0.0142 )[/C][C](0.496 )[/C][C](0.1666 )[/C][C](0.1451 )[/C][/ROW]
[ROW][C]Estimates ( 2 )[/C][C]-0.6036[/C][C]0[/C][C]0.2109[/C][C]0.3011[/C][/ROW]
[ROW][C](p-val)[/C][C](0.0113 )[/C][C](NA )[/C][C](0.0408 )[/C][C](0.2863 )[/C][/ROW]
[ROW][C]Estimates ( 3 )[/C][C]-0.358[/C][C]0[/C][C]0.1487[/C][C]0[/C][/ROW]
[ROW][C](p-val)[/C][C](0.001 )[/C][C](NA )[/C][C](0.1566 )[/C][C](NA )[/C][/ROW]
[ROW][C]Estimates ( 4 )[/C][C]-0.3464[/C][C]0[/C][C]0[/C][C]0[/C][/ROW]
[ROW][C](p-val)[/C][C](0.0016 )[/C][C](NA )[/C][C](NA )[/C][C](NA )[/C][/ROW]
[ROW][C]Estimates ( 5 )[/C][C]NA[/C][C]NA[/C][C]NA[/C][C]NA[/C][/ROW]
[ROW][C](p-val)[/C][C](NA )[/C][C](NA )[/C][C](NA )[/C][C](NA )[/C][/ROW]
[ROW][C]Estimates ( 6 )[/C][C]NA[/C][C]NA[/C][C]NA[/C][C]NA[/C][/ROW]
[ROW][C](p-val)[/C][C](NA )[/C][C](NA )[/C][C](NA )[/C][C](NA )[/C][/ROW]
[ROW][C]Estimates ( 7 )[/C][C]NA[/C][C]NA[/C][C]NA[/C][C]NA[/C][/ROW]
[ROW][C](p-val)[/C][C](NA )[/C][C](NA )[/C][C](NA )[/C][C](NA )[/C][/ROW]
[/TABLE]
Source: https://freestatistics.org/blog/index.php?pk=300380&T=1

Globally Unique Identifier (entire table): ba.freestatistics.org/blog/index.php?pk=300380&T=1

As an alternative you can also use a QR Code:  

The GUIDs for individual cells are displayed in the table below:

ARIMA Parameter Estimation and Backward Selection
Iterationar1ar2ar3ma1
Estimates ( 1 )-0.7683-0.12350.16430.4358
(p-val)(0.0142 )(0.496 )(0.1666 )(0.1451 )
Estimates ( 2 )-0.603600.21090.3011
(p-val)(0.0113 )(NA )(0.0408 )(0.2863 )
Estimates ( 3 )-0.35800.14870
(p-val)(0.001 )(NA )(0.1566 )(NA )
Estimates ( 4 )-0.3464000
(p-val)(0.0016 )(NA )(NA )(NA )
Estimates ( 5 )NANANANA
(p-val)(NA )(NA )(NA )(NA )
Estimates ( 6 )NANANANA
(p-val)(NA )(NA )(NA )(NA )
Estimates ( 7 )NANANANA
(p-val)(NA )(NA )(NA )(NA )


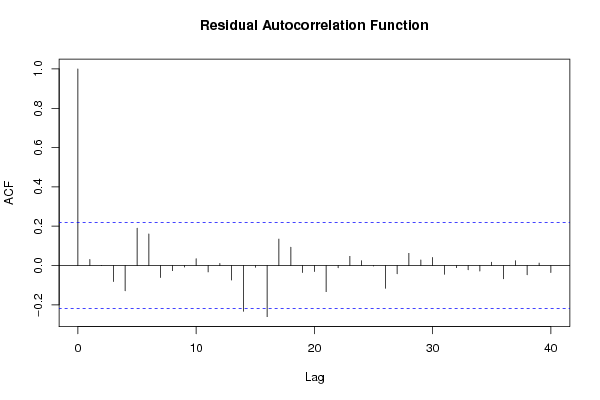
Estimated ARIMA Residuals
Value
-6.1692958151469
-46.30436733359
-27.0167870984052
-50.8096247654628
-18.678474281423
-32.0937194873647
-9.05136824213878
-20.3035963372386
-22.7009121614256
-11.4172291926079
-13.8170695247654
-2.3973158241879
-14.2567365937639
6.85942076957599
-11.4197537005775
61.859420769576
-3.21492586622753
18.2791744701535
9.28819146748174
7.29656333060484
6.28368296881763
12.0937194869493
13.5802462994225
22.0937194869493
20.6739657863718
-16.116157363339
-0.13354622379029
-13.6495439192868
2.6026841758121
25.3035963372377
26.180405967265
-35.3728939571029
-3.03730222887225
-16.859420769576
-26.2143853489533
188.819594032734
-70.4220203866062
-48.1972543104421
-34.7305362494599
4.76451563114643
-0.37036944913325
42.5333865559478
-13.4492245836009
-31.4840023045035
26.8934001512634
3.78056563510836
-37.3973158241879
151.523030702129
18.0939773088894
-45.9082645037452
-52.8018178600187
-203.680998793006
96.8077947054962
21.3038541591786
-13.8471855419939
-60.2684313040709
-28.0045084986641
-14.4910353111372
-4.8639292682401
-83.0738061185284
-28.9455667326174
-114.256736593764
51.4626454626632
108.641970395379
55.7370287388185
51.6880317996384
14.5892632967507
25.3035963372386
0.0314548737178484
19.256736593763
28.4441755676626
23.9506157485557
37.3973158241879
23.8145450167958
33.140579230424
5.53789505461191
7.77020978129076
4.12066586200308
6.79012314971078

\begin{tabular}{lllllllll}
\hline
Estimated ARIMA Residuals \tabularnewline
Value \tabularnewline
-6.1692958151469 \tabularnewline
-46.30436733359 \tabularnewline
-27.0167870984052 \tabularnewline
-50.8096247654628 \tabularnewline
-18.678474281423 \tabularnewline
-32.0937194873647 \tabularnewline
-9.05136824213878 \tabularnewline
-20.3035963372386 \tabularnewline
-22.7009121614256 \tabularnewline
-11.4172291926079 \tabularnewline
-13.8170695247654 \tabularnewline
-2.3973158241879 \tabularnewline
-14.2567365937639 \tabularnewline
6.85942076957599 \tabularnewline
-11.4197537005775 \tabularnewline
61.859420769576 \tabularnewline
-3.21492586622753 \tabularnewline
18.2791744701535 \tabularnewline
9.28819146748174 \tabularnewline
7.29656333060484 \tabularnewline
6.28368296881763 \tabularnewline
12.0937194869493 \tabularnewline
13.5802462994225 \tabularnewline
22.0937194869493 \tabularnewline
20.6739657863718 \tabularnewline
-16.116157363339 \tabularnewline
-0.13354622379029 \tabularnewline
-13.6495439192868 \tabularnewline
2.6026841758121 \tabularnewline
25.3035963372377 \tabularnewline
26.180405967265 \tabularnewline
-35.3728939571029 \tabularnewline
-3.03730222887225 \tabularnewline
-16.859420769576 \tabularnewline
-26.2143853489533 \tabularnewline
188.819594032734 \tabularnewline
-70.4220203866062 \tabularnewline
-48.1972543104421 \tabularnewline
-34.7305362494599 \tabularnewline
4.76451563114643 \tabularnewline
-0.37036944913325 \tabularnewline
42.5333865559478 \tabularnewline
-13.4492245836009 \tabularnewline
-31.4840023045035 \tabularnewline
26.8934001512634 \tabularnewline
3.78056563510836 \tabularnewline
-37.3973158241879 \tabularnewline
151.523030702129 \tabularnewline
18.0939773088894 \tabularnewline
-45.9082645037452 \tabularnewline
-52.8018178600187 \tabularnewline
-203.680998793006 \tabularnewline
96.8077947054962 \tabularnewline
21.3038541591786 \tabularnewline
-13.8471855419939 \tabularnewline
-60.2684313040709 \tabularnewline
-28.0045084986641 \tabularnewline
-14.4910353111372 \tabularnewline
-4.8639292682401 \tabularnewline
-83.0738061185284 \tabularnewline
-28.9455667326174 \tabularnewline
-114.256736593764 \tabularnewline
51.4626454626632 \tabularnewline
108.641970395379 \tabularnewline
55.7370287388185 \tabularnewline
51.6880317996384 \tabularnewline
14.5892632967507 \tabularnewline
25.3035963372386 \tabularnewline
0.0314548737178484 \tabularnewline
19.256736593763 \tabularnewline
28.4441755676626 \tabularnewline
23.9506157485557 \tabularnewline
37.3973158241879 \tabularnewline
23.8145450167958 \tabularnewline
33.140579230424 \tabularnewline
5.53789505461191 \tabularnewline
7.77020978129076 \tabularnewline
4.12066586200308 \tabularnewline
6.79012314971078 \tabularnewline
\hline
\end{tabular}
%Source: https://freestatistics.org/blog/index.php?pk=300380&T=2

[TABLE]
[ROW][C]Estimated ARIMA Residuals[/C][/ROW]
[ROW][C]Value[/C][/ROW]
[ROW][C]-6.1692958151469[/C][/ROW]
[ROW][C]-46.30436733359[/C][/ROW]
[ROW][C]-27.0167870984052[/C][/ROW]
[ROW][C]-50.8096247654628[/C][/ROW]
[ROW][C]-18.678474281423[/C][/ROW]
[ROW][C]-32.0937194873647[/C][/ROW]
[ROW][C]-9.05136824213878[/C][/ROW]
[ROW][C]-20.3035963372386[/C][/ROW]
[ROW][C]-22.7009121614256[/C][/ROW]
[ROW][C]-11.4172291926079[/C][/ROW]
[ROW][C]-13.8170695247654[/C][/ROW]
[ROW][C]-2.3973158241879[/C][/ROW]
[ROW][C]-14.2567365937639[/C][/ROW]
[ROW][C]6.85942076957599[/C][/ROW]
[ROW][C]-11.4197537005775[/C][/ROW]
[ROW][C]61.859420769576[/C][/ROW]
[ROW][C]-3.21492586622753[/C][/ROW]
[ROW][C]18.2791744701535[/C][/ROW]
[ROW][C]9.28819146748174[/C][/ROW]
[ROW][C]7.29656333060484[/C][/ROW]
[ROW][C]6.28368296881763[/C][/ROW]
[ROW][C]12.0937194869493[/C][/ROW]
[ROW][C]13.5802462994225[/C][/ROW]
[ROW][C]22.0937194869493[/C][/ROW]
[ROW][C]20.6739657863718[/C][/ROW]
[ROW][C]-16.116157363339[/C][/ROW]
[ROW][C]-0.13354622379029[/C][/ROW]
[ROW][C]-13.6495439192868[/C][/ROW]
[ROW][C]2.6026841758121[/C][/ROW]
[ROW][C]25.3035963372377[/C][/ROW]
[ROW][C]26.180405967265[/C][/ROW]
[ROW][C]-35.3728939571029[/C][/ROW]
[ROW][C]-3.03730222887225[/C][/ROW]
[ROW][C]-16.859420769576[/C][/ROW]
[ROW][C]-26.2143853489533[/C][/ROW]
[ROW][C]188.819594032734[/C][/ROW]
[ROW][C]-70.4220203866062[/C][/ROW]
[ROW][C]-48.1972543104421[/C][/ROW]
[ROW][C]-34.7305362494599[/C][/ROW]
[ROW][C]4.76451563114643[/C][/ROW]
[ROW][C]-0.37036944913325[/C][/ROW]
[ROW][C]42.5333865559478[/C][/ROW]
[ROW][C]-13.4492245836009[/C][/ROW]
[ROW][C]-31.4840023045035[/C][/ROW]
[ROW][C]26.8934001512634[/C][/ROW]
[ROW][C]3.78056563510836[/C][/ROW]
[ROW][C]-37.3973158241879[/C][/ROW]
[ROW][C]151.523030702129[/C][/ROW]
[ROW][C]18.0939773088894[/C][/ROW]
[ROW][C]-45.9082645037452[/C][/ROW]
[ROW][C]-52.8018178600187[/C][/ROW]
[ROW][C]-203.680998793006[/C][/ROW]
[ROW][C]96.8077947054962[/C][/ROW]
[ROW][C]21.3038541591786[/C][/ROW]
[ROW][C]-13.8471855419939[/C][/ROW]
[ROW][C]-60.2684313040709[/C][/ROW]
[ROW][C]-28.0045084986641[/C][/ROW]
[ROW][C]-14.4910353111372[/C][/ROW]
[ROW][C]-4.8639292682401[/C][/ROW]
[ROW][C]-83.0738061185284[/C][/ROW]
[ROW][C]-28.9455667326174[/C][/ROW]
[ROW][C]-114.256736593764[/C][/ROW]
[ROW][C]51.4626454626632[/C][/ROW]
[ROW][C]108.641970395379[/C][/ROW]
[ROW][C]55.7370287388185[/C][/ROW]
[ROW][C]51.6880317996384[/C][/ROW]
[ROW][C]14.5892632967507[/C][/ROW]
[ROW][C]25.3035963372386[/C][/ROW]
[ROW][C]0.0314548737178484[/C][/ROW]
[ROW][C]19.256736593763[/C][/ROW]
[ROW][C]28.4441755676626[/C][/ROW]
[ROW][C]23.9506157485557[/C][/ROW]
[ROW][C]37.3973158241879[/C][/ROW]
[ROW][C]23.8145450167958[/C][/ROW]
[ROW][C]33.140579230424[/C][/ROW]
[ROW][C]5.53789505461191[/C][/ROW]
[ROW][C]7.77020978129076[/C][/ROW]
[ROW][C]4.12066586200308[/C][/ROW]
[ROW][C]6.79012314971078[/C][/ROW]
[/TABLE]
Source: https://freestatistics.org/blog/index.php?pk=300380&T=2

Globally Unique Identifier (entire table): ba.freestatistics.org/blog/index.php?pk=300380&T=2

As an alternative you can also use a QR Code:  

The GUIDs for individual cells are displayed in the table below:

Estimated ARIMA Residuals
Value
-6.1692958151469
-46.30436733359
-27.0167870984052
-50.8096247654628
-18.678474281423
-32.0937194873647
-9.05136824213878
-20.3035963372386
-22.7009121614256
-11.4172291926079
-13.8170695247654
-2.3973158241879
-14.2567365937639
6.85942076957599
-11.4197537005775
61.859420769576
-3.21492586622753
18.2791744701535
9.28819146748174
7.29656333060484
6.28368296881763
12.0937194869493
13.5802462994225
22.0937194869493
20.6739657863718
-16.116157363339
-0.13354622379029
-13.6495439192868
2.6026841758121
25.3035963372377
26.180405967265
-35.3728939571029
-3.03730222887225
-16.859420769576
-26.2143853489533
188.819594032734
-70.4220203866062
-48.1972543104421
-34.7305362494599
4.76451563114643
-0.37036944913325
42.5333865559478
-13.4492245836009
-31.4840023045035
26.8934001512634
3.78056563510836
-37.3973158241879
151.523030702129
18.0939773088894
-45.9082645037452
-52.8018178600187
-203.680998793006
96.8077947054962
21.3038541591786
-13.8471855419939
-60.2684313040709
-28.0045084986641
-14.4910353111372
-4.8639292682401
-83.0738061185284
-28.9455667326174
-114.256736593764
51.4626454626632
108.641970395379
55.7370287388185
51.6880317996384
14.5892632967507
25.3035963372386
0.0314548737178484
19.256736593763
28.4441755676626
23.9506157485557
37.3973158241879
23.8145450167958
33.140579230424
5.53789505461191
7.77020978129076
4.12066586200308
6.79012314971078


Parameters (Session):
par1 = Default ; par2 = 1 ; par3 = 1 ; par4 = 0 ; par5 = 12 ; par6 = White Noise ; par7 = 0.95 ;
Parameters (R input):
par1 = FALSE ; par2 = 1 ; par3 = 2 ; par4 = 0 ; par5 = 1 ; par6 = 3 ; par7 = 1 ; par8 = 0 ; par9 = 0 ;
R code (references can be found in the software module):
library(lattice)
if (par1 == 'TRUE') par1 <- TRUE
if (par1 == 'FALSE') par1 <- FALSE
par2 <- as.numeric(par2) #Box-Cox lambda transformation parameter
par3 <- as.numeric(par3) #degree of non-seasonal differencing
par4 <- as.numeric(par4) #degree of seasonal differencing
par5 <- as.numeric(par5) #seasonal period
par6 <- as.numeric(par6) #degree (p) of the non-seasonal AR(p) polynomial
par7 <- as.numeric(par7) #degree (q) of the non-seasonal MA(q) polynomial
par8 <- as.numeric(par8) #degree (P) of the seasonal AR(P) polynomial
par9 <- as.numeric(par9) #degree (Q) of the seasonal MA(Q) polynomial
armaGR <- function(arima.out, names, n){
try1 <- arima.out$coef
try2 <- sqrt(diag(arima.out$var.coef))
try.data.frame <- data.frame(matrix(NA,ncol=4,nrow=length(names)))
dimnames(try.data.frame) <- list(names,c('coef','std','tstat','pv'))
try.data.frame[,1] <- try1
for(i in 1:length(try2)) try.data.frame[which(rownames(try.data.frame)==names(try2)[i]),2] <- try2[i]
try.data.frame[,3] <- try.data.frame[,1] / try.data.frame[,2]
try.data.frame[,4] <- round((1-pt(abs(try.data.frame[,3]),df=n-(length(try2)+1)))*2,5)
vector <- rep(NA,length(names))
vector[is.na(try.data.frame[,4])] <- 0
maxi <- which.max(try.data.frame[,4])
continue <- max(try.data.frame[,4],na.rm=TRUE) > .05
vector[maxi] <- 0
list(summary=try.data.frame,next.vector=vector,continue=continue)
}
arimaSelect <- function(series, order=c(13,0,0), seasonal=list(order=c(2,0,0),period=12), include.mean=F){
nrc <- order[1]+order[3]+seasonal$order[1]+seasonal$order[3]
coeff <- matrix(NA, nrow=nrc*2, ncol=nrc)
pval <- matrix(NA, nrow=nrc*2, ncol=nrc)
mylist <- rep(list(NULL), nrc)
names <- NULL
if(order[1] > 0) names <- paste('ar',1:order[1],sep='')
if(order[3] > 0) names <- c( names , paste('ma',1:order[3],sep='') )
if(seasonal$order[1] > 0) names <- c(names, paste('sar',1:seasonal$order[1],sep=''))
if(seasonal$order[3] > 0) names <- c(names, paste('sma',1:seasonal$order[3],sep=''))
arima.out <- arima(series, order=order, seasonal=seasonal, include.mean=include.mean, method='ML')
mylist[[1]] <- arima.out
last.arma <- armaGR(arima.out, names, length(series))
mystop <- FALSE
i <- 1
coeff[i,] <- last.arma[[1]][,1]
pval [i,] <- last.arma[[1]][,4]
i <- 2
aic <- arima.out$aic
while(!mystop){
mylist[[i]] <- arima.out
arima.out <- arima(series, order=order, seasonal=seasonal, include.mean=include.mean, method='ML', fixed=last.arma$next.vector)
aic <- c(aic, arima.out$aic)
last.arma <- armaGR(arima.out, names, length(series))
mystop <- !last.arma$continue
coeff[i,] <- last.arma[[1]][,1]
pval [i,] <- last.arma[[1]][,4]
i <- i+1
}
list(coeff, pval, mylist, aic=aic)
}
arimaSelectplot <- function(arimaSelect.out,noms,choix){
noms <- names(arimaSelect.out[[3]][[1]]$coef)
coeff <- arimaSelect.out[[1]]
k <- min(which(is.na(coeff[,1])))-1
coeff <- coeff[1:k,]
pval <- arimaSelect.out[[2]][1:k,]
aic <- arimaSelect.out$aic[1:k]
coeff[coeff==0] <- NA
n <- ncol(coeff)
if(missing(choix)) choix <- k
layout(matrix(c(1,1,1,2,
3,3,3,2,
3,3,3,4,
5,6,7,7),nr=4),
widths=c(10,35,45,15),
heights=c(30,30,15,15))
couleurs <- rainbow(75)[1:50]#(50)
ticks <- pretty(coeff)
par(mar=c(1,1,3,1))
plot(aic,k:1-.5,type='o',pch=21,bg='blue',cex=2,axes=F,lty=2,xpd=NA)
points(aic[choix],k-choix+.5,pch=21,cex=4,bg=2,xpd=NA)
title('aic',line=2)
par(mar=c(3,0,0,0))
plot(0,axes=F,xlab='',ylab='',xlim=range(ticks),ylim=c(.1,1))
rect(xleft = min(ticks) + (0:49)/50*(max(ticks)-min(ticks)),
xright = min(ticks) + (1:50)/50*(max(ticks)-min(ticks)),
ytop = rep(1,50),
ybottom= rep(0,50),col=couleurs,border=NA)
axis(1,ticks)
rect(xleft=min(ticks),xright=max(ticks),ytop=1,ybottom=0)
text(mean(coeff,na.rm=T),.5,'coefficients',cex=2,font=2)
par(mar=c(1,1,3,1))
image(1:n,1:k,t(coeff[k:1,]),axes=F,col=couleurs,zlim=range(ticks))
for(i in 1:n) for(j in 1:k) if(!is.na(coeff[j,i])) {
if(pval[j,i]<.01) symb = 'green'
else if( (pval[j,i]<.05) & (pval[j,i]>=.01)) symb = 'orange'
else if( (pval[j,i]<.1) & (pval[j,i]>=.05)) symb = 'red'
else symb = 'black'
polygon(c(i+.5 ,i+.2 ,i+.5 ,i+.5),
c(k-j+0.5,k-j+0.5,k-j+0.8,k-j+0.5),
col=symb)
if(j==choix) {
rect(xleft=i-.5,
xright=i+.5,
ybottom=k-j+1.5,
ytop=k-j+.5,
lwd=4)
text(i,
k-j+1,
round(coeff[j,i],2),
cex=1.2,
font=2)
}
else{
rect(xleft=i-.5,xright=i+.5,ybottom=k-j+1.5,ytop=k-j+.5)
text(i,k-j+1,round(coeff[j,i],2),cex=1.2,font=1)
}
}
axis(3,1:n,noms)
par(mar=c(0.5,0,0,0.5))
plot(0,axes=F,xlab='',ylab='',type='n',xlim=c(0,8),ylim=c(-.2,.8))
cols <- c('green','orange','red','black')
niv <- c('0','0.01','0.05','0.1')
for(i in 0:3){
polygon(c(1+2*i ,1+2*i ,1+2*i-.5 ,1+2*i),
c(.4 ,.7 , .4 , .4),
col=cols[i+1])
text(2*i,0.5,niv[i+1],cex=1.5)
}
text(8,.5,1,cex=1.5)
text(4,0,'p-value',cex=2)
box()
residus <- arimaSelect.out[[3]][[choix]]$res
par(mar=c(1,2,4,1))
acf(residus,main='')
title('acf',line=.5)
par(mar=c(1,2,4,1))
pacf(residus,main='')
title('pacf',line=.5)
par(mar=c(2,2,4,1))
qqnorm(residus,main='')
title('qq-norm',line=.5)
qqline(residus)
residus
}
if (par2 == 0) x <- log(x)
if (par2 != 0) x <- x^par2
(selection <- arimaSelect(x, order=c(par6,par3,par7), seasonal=list(order=c(par8,par4,par9), period=par5)))
bitmap(file='test1.png')
resid <- arimaSelectplot(selection)
dev.off()
resid
bitmap(file='test2.png')
acf(resid,length(resid)/2, main='Residual Autocorrelation Function')
dev.off()
bitmap(file='test3.png')
pacf(resid,length(resid)/2, main='Residual Partial Autocorrelation Function')
dev.off()
bitmap(file='test4.png')
cpgram(resid, main='Residual Cumulative Periodogram')
dev.off()
bitmap(file='test5.png')
hist(resid, main='Residual Histogram', xlab='values of Residuals')
dev.off()
bitmap(file='test6.png')
densityplot(~resid,col='black',main='Residual Density Plot', xlab='values of Residuals')
dev.off()
bitmap(file='test7.png')
qqnorm(resid, main='Residual Normal Q-Q Plot')
qqline(resid)
dev.off()
ncols <- length(selection[[1]][1,])
nrows <- length(selection[[2]][,1])-1
load(file='createtable')
a<-table.start()
a<-table.row.start(a)
a<-table.element(a,'ARIMA Parameter Estimation and Backward Selection', ncols+1,TRUE)
a<-table.row.end(a)
a<-table.row.start(a)
a<-table.element(a,'Iteration', header=TRUE)
for (i in 1:ncols) {
a<-table.element(a,names(selection[[3]][[1]]$coef)[i],header=TRUE)
}
a<-table.row.end(a)
for (j in 1:nrows) {
a<-table.row.start(a)
mydum <- 'Estimates ('
mydum <- paste(mydum,j)
mydum <- paste(mydum,')')
a<-table.element(a,mydum, header=TRUE)
for (i in 1:ncols) {
a<-table.element(a,round(selection[[1]][j,i],4))
}
a<-table.row.end(a)
a<-table.row.start(a)
a<-table.element(a,'(p-val)', header=TRUE)
for (i in 1:ncols) {
mydum <- '('
mydum <- paste(mydum,round(selection[[2]][j,i],4),sep='')
mydum <- paste(mydum,')')
a<-table.element(a,mydum)
}
a<-table.row.end(a)
}
a<-table.end(a)
table.save(a,file='mytable.tab')
a<-table.start()
a<-table.row.start(a)
a<-table.element(a,'Estimated ARIMA Residuals', 1,TRUE)
a<-table.row.end(a)
a<-table.row.start(a)
a<-table.element(a,'Value', 1,TRUE)
a<-table.row.end(a)
for (i in (par4*par5+par3):length(resid)) {
a<-table.row.start(a)
a<-table.element(a,resid[i])
a<-table.row.end(a)
}
a<-table.end(a)
table.save(a,file='mytable1.tab')