Free Statistics

of Irreproducible Research!

Author's title

Author*The author of this computation has been verified*
R Software Modulerwasp_smp.wasp
Title produced by softwareStandard Deviation-Mean Plot
Date of computationFri, 16 Dec 2016 16:41:10 +0100
Cite this page as followsStatistical Computations at FreeStatistics.org, Office for Research Development and Education, URL https://freestatistics.org/blog/index.php?v=date/2016/Dec/16/t1481902973qieyivnay7edyw9.htm/, Retrieved Thu, 02 May 2024 17:09:28 +0000
Statistical Computations at FreeStatistics.org, Office for Research Development and Education, URL https://freestatistics.org/blog/index.php?pk=300383, Retrieved Thu, 02 May 2024 17:09:28 +0000
QR Codes:

Original text written by user:
IsPrivate?No (this computation is public)
User-defined keywords
Estimated Impact71
Family? (F = Feedback message, R = changed R code, M = changed R Module, P = changed Parameters, D = changed Data)
-     [ARIMA Forecasting] [Arima forecast 3e] [2016-12-14 14:39:22] [5f979cb1c6fa86b57093c7542788c28c]
- RMPD    [Standard Deviation-Mean Plot] [gqsdhjflkf] [2016-12-16 15:41:10] [4c05fa0998bf98e29c2e453b139976f4] [Current]
Feedback Forum

Post a new message
Dataseries X:
5345
5245
5100
5070
5035
5050
5065
5255
5335
5440
5490
5445
5675
5615
5545
5510
5570
5610
5555
5630
5685
5545
5625
5570
5555
5635
5535
5430
5400
5410
5255
5350
5405
5420
5430
5580
5595
5485
5295
5055
4975
4895
4795
4855
4785
4875
5010
4970
4995
5020
4950
4880
4850
4885
4785
5025
5030
5160
5240
5175
5130
5140
5140
5055
5015
5015
4920
5095
5010
5100
5115
5060
5035
5005
4960
5035
4980
4940
4810
5025
5035
5060
5140
4955
5135
5135
5070
5070
5005
5045
4975
5080
5125
5225
5240
5090
5105
5200
5115
4990
4905
4980
4840
4960
4970
5035
5030
4965
4925
4920
4895
4890
4895
4850
4830
4870


Summary of computational transaction
Raw Input view raw input (R code)
Raw Outputview raw output of R engine
Computing time1 seconds
R ServerBig Analytics Cloud Computing Center

\begin{tabular}{lllllllll}
\hline
Summary of computational transaction \tabularnewline
Raw Input view raw input (R code)  \tabularnewline
Raw Outputview raw output of R engine  \tabularnewline
Computing time1 seconds \tabularnewline
R ServerBig Analytics Cloud Computing Center \tabularnewline
\hline
\end{tabular}
%Source: https://freestatistics.org/blog/index.php?pk=300383&T=0

[TABLE]
[ROW]
Summary of computational transaction[/C][/ROW] [ROW]Raw Input[/C] view raw input (R code) [/C][/ROW] [ROW]Raw Output[/C]view raw output of R engine [/C][/ROW] [ROW]Computing time[/C]1 seconds[/C][/ROW] [ROW]R Server[/C]Big Analytics Cloud Computing Center[/C][/ROW] [/TABLE] Source: https://freestatistics.org/blog/index.php?pk=300383&T=0

Globally Unique Identifier (entire table): ba.freestatistics.org/blog/index.php?pk=300383&T=0

As an alternative you can also use a QR Code:  

The GUIDs for individual cells are displayed in the table below:

Summary of computational transaction
Raw Input view raw input (R code)
Raw Outputview raw output of R engine
Computing time1 seconds
R ServerBig Analytics Cloud Computing Center


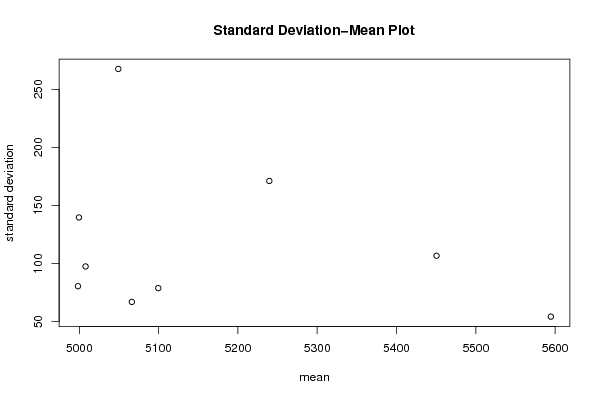
Standard Deviation-Mean Plot
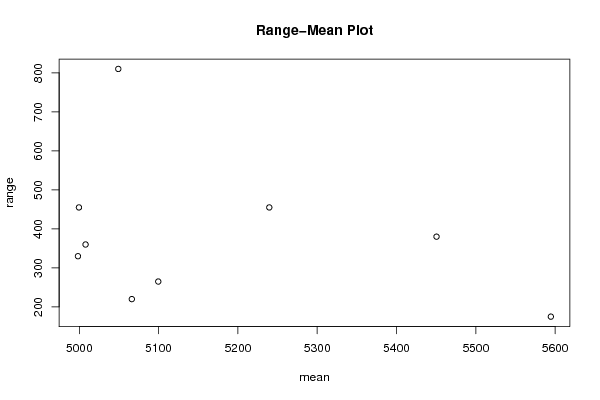
SectionMeanStandard DeviationRange
15239.58333333333171.112115469963455
25594.5833333333354.2074438587264175
35450.41666666667106.695367824248380
45049.16666666667267.622812362791810
54999.58333333333139.682404913519455
65066.2566.9166713838256220
74998.3333333333380.4626772127452330
85099.5833333333378.7821603402622265
95007.9166666666797.4553122143061360

\begin{tabular}{lllllllll}
\hline
Standard Deviation-Mean Plot \tabularnewline
Section & Mean & Standard Deviation & Range \tabularnewline
1 & 5239.58333333333 & 171.112115469963 & 455 \tabularnewline
2 & 5594.58333333333 & 54.2074438587264 & 175 \tabularnewline
3 & 5450.41666666667 & 106.695367824248 & 380 \tabularnewline
4 & 5049.16666666667 & 267.622812362791 & 810 \tabularnewline
5 & 4999.58333333333 & 139.682404913519 & 455 \tabularnewline
6 & 5066.25 & 66.9166713838256 & 220 \tabularnewline
7 & 4998.33333333333 & 80.4626772127452 & 330 \tabularnewline
8 & 5099.58333333333 & 78.7821603402622 & 265 \tabularnewline
9 & 5007.91666666667 & 97.4553122143061 & 360 \tabularnewline
\hline
\end{tabular}
%Source: https://freestatistics.org/blog/index.php?pk=300383&T=1

[TABLE]
[ROW][C]Standard Deviation-Mean Plot[/C][/ROW]
[ROW][C]Section[/C][C]Mean[/C][C]Standard Deviation[/C][C]Range[/C][/ROW]
[ROW][C]1[/C][C]5239.58333333333[/C][C]171.112115469963[/C][C]455[/C][/ROW]
[ROW][C]2[/C][C]5594.58333333333[/C][C]54.2074438587264[/C][C]175[/C][/ROW]
[ROW][C]3[/C][C]5450.41666666667[/C][C]106.695367824248[/C][C]380[/C][/ROW]
[ROW][C]4[/C][C]5049.16666666667[/C][C]267.622812362791[/C][C]810[/C][/ROW]
[ROW][C]5[/C][C]4999.58333333333[/C][C]139.682404913519[/C][C]455[/C][/ROW]
[ROW][C]6[/C][C]5066.25[/C][C]66.9166713838256[/C][C]220[/C][/ROW]
[ROW][C]7[/C][C]4998.33333333333[/C][C]80.4626772127452[/C][C]330[/C][/ROW]
[ROW][C]8[/C][C]5099.58333333333[/C][C]78.7821603402622[/C][C]265[/C][/ROW]
[ROW][C]9[/C][C]5007.91666666667[/C][C]97.4553122143061[/C][C]360[/C][/ROW]
[/TABLE]
Source: https://freestatistics.org/blog/index.php?pk=300383&T=1

Globally Unique Identifier (entire table): ba.freestatistics.org/blog/index.php?pk=300383&T=1

As an alternative you can also use a QR Code:  

The GUIDs for individual cells are displayed in the table below:

Standard Deviation-Mean Plot
SectionMeanStandard DeviationRange
15239.58333333333171.112115469963455
25594.5833333333354.2074438587264175
35450.41666666667106.695367824248380
45049.16666666667267.622812362791810
54999.58333333333139.682404913519455
65066.2566.9166713838256220
74998.3333333333380.4626772127452330
85099.5833333333378.7821603402622265
95007.9166666666797.4553122143061360


Regression: S.E.(k) = alpha + beta * Mean(k)
alpha534.122912737484
beta-0.0805103903464358
S.D.0.11223259753324
T-STAT-0.717352998290814
p-value0.496390428580569

\begin{tabular}{lllllllll}
\hline
Regression: S.E.(k) = alpha + beta * Mean(k) \tabularnewline
alpha & 534.122912737484 \tabularnewline
beta & -0.0805103903464358 \tabularnewline
S.D. & 0.11223259753324 \tabularnewline
T-STAT & -0.717352998290814 \tabularnewline
p-value & 0.496390428580569 \tabularnewline
\hline
\end{tabular}
%Source: https://freestatistics.org/blog/index.php?pk=300383&T=2

[TABLE]
[ROW][C]Regression: S.E.(k) = alpha + beta * Mean(k)[/C][/ROW]
[ROW][C]alpha[/C][C]534.122912737484[/C][/ROW]
[ROW][C]beta[/C][C]-0.0805103903464358[/C][/ROW]
[ROW][C]S.D.[/C][C]0.11223259753324[/C][/ROW]
[ROW][C]T-STAT[/C][C]-0.717352998290814[/C][/ROW]
[ROW][C]p-value[/C][C]0.496390428580569[/C][/ROW]
[/TABLE]
Source: https://freestatistics.org/blog/index.php?pk=300383&T=2

Globally Unique Identifier (entire table): ba.freestatistics.org/blog/index.php?pk=300383&T=2

As an alternative you can also use a QR Code:  

The GUIDs for individual cells are displayed in the table below:

Regression: S.E.(k) = alpha + beta * Mean(k)
alpha534.122912737484
beta-0.0805103903464358
S.D.0.11223259753324
T-STAT-0.717352998290814
p-value0.496390428580569


Regression: ln S.E.(k) = alpha + beta * ln Mean(k)
alpha37.3460859893794
beta-3.82412424365339
S.D.4.3396090613423
T-STAT-0.881213996375641
p-value0.407439135155993
Lambda4.82412424365339

\begin{tabular}{lllllllll}
\hline
Regression: ln S.E.(k) = alpha + beta * ln Mean(k) \tabularnewline
alpha & 37.3460859893794 \tabularnewline
beta & -3.82412424365339 \tabularnewline
S.D. & 4.3396090613423 \tabularnewline
T-STAT & -0.881213996375641 \tabularnewline
p-value & 0.407439135155993 \tabularnewline
Lambda & 4.82412424365339 \tabularnewline
\hline
\end{tabular}
%Source: https://freestatistics.org/blog/index.php?pk=300383&T=3

[TABLE]
[ROW][C]Regression: ln S.E.(k) = alpha + beta * ln Mean(k)[/C][/ROW]
[ROW][C]alpha[/C][C]37.3460859893794[/C][/ROW]
[ROW][C]beta[/C][C]-3.82412424365339[/C][/ROW]
[ROW][C]S.D.[/C][C]4.3396090613423[/C][/ROW]
[ROW][C]T-STAT[/C][C]-0.881213996375641[/C][/ROW]
[ROW][C]p-value[/C][C]0.407439135155993[/C][/ROW]
[ROW][C]Lambda[/C][C]4.82412424365339[/C][/ROW]
[/TABLE]
Source: https://freestatistics.org/blog/index.php?pk=300383&T=3

Globally Unique Identifier (entire table): ba.freestatistics.org/blog/index.php?pk=300383&T=3

As an alternative you can also use a QR Code:  

The GUIDs for individual cells are displayed in the table below:

Regression: ln S.E.(k) = alpha + beta * ln Mean(k)
alpha37.3460859893794
beta-3.82412424365339
S.D.4.3396090613423
T-STAT-0.881213996375641
p-value0.407439135155993
Lambda4.82412424365339


Parameters (Session):
par1 = 1 ; par2 = 12 ; par3 = BFGS ;
Parameters (R input):
par1 = 12 ;
R code (references can be found in the software module):
par1 <- '1'
par1 <- as.numeric(par1)
(n <- length(x))
(np <- floor(n / par1))
arr <- array(NA,dim=c(par1,np))
j <- 0
k <- 1
for (i in 1:(np*par1))
{
j = j + 1
arr[j,k] <- x[i]
if (j == par1) {
j = 0
k=k+1
}
}
arr
arr.mean <- array(NA,dim=np)
arr.sd <- array(NA,dim=np)
arr.range <- array(NA,dim=np)
for (j in 1:np)
{
arr.mean[j] <- mean(arr[,j],na.rm=TRUE)
arr.sd[j] <- sd(arr[,j],na.rm=TRUE)
arr.range[j] <- max(arr[,j],na.rm=TRUE) - min(arr[,j],na.rm=TRUE)
}
arr.mean
arr.sd
arr.range
(lm1 <- lm(arr.sd~arr.mean))
(lnlm1 <- lm(log(arr.sd)~log(arr.mean)))
(lm2 <- lm(arr.range~arr.mean))
bitmap(file='test1.png')
plot(arr.mean,arr.sd,main='Standard Deviation-Mean Plot',xlab='mean',ylab='standard deviation')
dev.off()
bitmap(file='test2.png')
plot(arr.mean,arr.range,main='Range-Mean Plot',xlab='mean',ylab='range')
dev.off()
load(file='createtable')
a<-table.start()
a<-table.row.start(a)
a<-table.element(a,'Standard Deviation-Mean Plot',4,TRUE)
a<-table.row.end(a)
a<-table.row.start(a)
a<-table.element(a,'Section',header=TRUE)
a<-table.element(a,'Mean',header=TRUE)
a<-table.element(a,'Standard Deviation',header=TRUE)
a<-table.element(a,'Range',header=TRUE)
a<-table.row.end(a)
for (j in 1:np) {
a<-table.row.start(a)
a<-table.element(a,j,header=TRUE)
a<-table.element(a,arr.mean[j])
a<-table.element(a,arr.sd[j] )
a<-table.element(a,arr.range[j] )
a<-table.row.end(a)
}
a<-table.end(a)
table.save(a,file='mytable.tab')
a<-table.start()
a<-table.row.start(a)
a<-table.element(a,'Regression: S.E.(k) = alpha + beta * Mean(k)',2,TRUE)
a<-table.row.end(a)
a<-table.row.start(a)
a<-table.element(a,'alpha',header=TRUE)
a<-table.element(a,lm1$coefficients[[1]])
a<-table.row.end(a)
a<-table.row.start(a)
a<-table.element(a,'beta',header=TRUE)
a<-table.element(a,lm1$coefficients[[2]])
a<-table.row.end(a)
a<-table.row.start(a)
a<-table.element(a,'S.D.',header=TRUE)
a<-table.element(a,summary(lm1)$coefficients[2,2])
a<-table.row.end(a)
a<-table.row.start(a)
a<-table.element(a,'T-STAT',header=TRUE)
a<-table.element(a,summary(lm1)$coefficients[2,3])
a<-table.row.end(a)
a<-table.row.start(a)
a<-table.element(a,'p-value',header=TRUE)
a<-table.element(a,summary(lm1)$coefficients[2,4])
a<-table.row.end(a)
a<-table.end(a)
table.save(a,file='mytable1.tab')
a<-table.start()
a<-table.row.start(a)
a<-table.element(a,'Regression: ln S.E.(k) = alpha + beta * ln Mean(k)',2,TRUE)
a<-table.row.end(a)
a<-table.row.start(a)
a<-table.element(a,'alpha',header=TRUE)
a<-table.element(a,lnlm1$coefficients[[1]])
a<-table.row.end(a)
a<-table.row.start(a)
a<-table.element(a,'beta',header=TRUE)
a<-table.element(a,lnlm1$coefficients[[2]])
a<-table.row.end(a)
a<-table.row.start(a)
a<-table.element(a,'S.D.',header=TRUE)
a<-table.element(a,summary(lnlm1)$coefficients[2,2])
a<-table.row.end(a)
a<-table.row.start(a)
a<-table.element(a,'T-STAT',header=TRUE)
a<-table.element(a,summary(lnlm1)$coefficients[2,3])
a<-table.row.end(a)
a<-table.row.start(a)
a<-table.element(a,'p-value',header=TRUE)
a<-table.element(a,summary(lnlm1)$coefficients[2,4])
a<-table.row.end(a)
a<-table.row.start(a)
a<-table.element(a,'Lambda',header=TRUE)
a<-table.element(a,1-lnlm1$coefficients[[2]])
a<-table.row.end(a)
a<-table.end(a)
table.save(a,file='mytable2.tab')