Free Statistics

of Irreproducible Research!

Author's title

Author*The author of this computation has been verified*
R Software Modulerwasp_arimabackwardselection.wasp
Title produced by softwareARIMA Backward Selection
Date of computationFri, 16 Dec 2016 16:45:16 +0100
Cite this page as followsStatistical Computations at FreeStatistics.org, Office for Research Development and Education, URL https://freestatistics.org/blog/index.php?v=date/2016/Dec/16/t1481903135ni3t4rtxmj6c7e2.htm/, Retrieved Thu, 02 May 2024 23:32:07 +0000
Statistical Computations at FreeStatistics.org, Office for Research Development and Education, URL https://freestatistics.org/blog/index.php?pk=300388, Retrieved Thu, 02 May 2024 23:32:07 +0000
QR Codes:

Original text written by user:
IsPrivate?No (this computation is public)
User-defined keywords
Estimated Impact70
Family? (F = Feedback message, R = changed R code, M = changed R Module, P = changed Parameters, D = changed Data)
-     [ARIMA Backward Selection] [] [2016-12-16 13:36:55] [683f400e1b95307fc738e729f07c4fce]
-    D  [ARIMA Backward Selection] [] [2016-12-16 14:17:56] [683f400e1b95307fc738e729f07c4fce]
- R  D    [ARIMA Backward Selection] [] [2016-12-16 14:51:40] [683f400e1b95307fc738e729f07c4fce]
- R  D        [ARIMA Backward Selection] [] [2016-12-16 15:45:16] [404ac5ee4f7301873f6a96ef36861981] [Current]
Feedback Forum

Post a new message
Dataseries X:
1880
3600
4600
6560
7840
8560
10120
9240
9320
7000
3960
4680
3920
1560
4800
5240
8000
9760
9800
9280
7680
7760
5680
4560
1560
3680
4200
7400
7040
8480
9720
9760
9440
7240
5080
4080
5120
4400
5160
6680
8240
8960
9280
9880
8480
7320
4880
5280
4080
4720
6360
5760
9000
9160
10480
10160
9120
7880
5080
4360
4480
6000
6120
6200
8960
8680
10240
10920
8440
7760
5320
3920
4040
2960
6280
6320
7160
8160


Summary of computational transaction
Raw Input view raw input (R code)
Raw Outputview raw output of R engine
Computing time5 seconds
R ServerBig Analytics Cloud Computing Center

\begin{tabular}{lllllllll}
\hline
Summary of computational transaction \tabularnewline
Raw Input view raw input (R code)  \tabularnewline
Raw Outputview raw output of R engine  \tabularnewline
Computing time5 seconds \tabularnewline
R ServerBig Analytics Cloud Computing Center \tabularnewline
\hline
\end{tabular}
%Source: https://freestatistics.org/blog/index.php?pk=300388&T=0

[TABLE]
[ROW]
Summary of computational transaction[/C][/ROW] [ROW]Raw Input[/C] view raw input (R code) [/C][/ROW] [ROW]Raw Output[/C]view raw output of R engine [/C][/ROW] [ROW]Computing time[/C]5 seconds[/C][/ROW] [ROW]R Server[/C]Big Analytics Cloud Computing Center[/C][/ROW] [/TABLE] Source: https://freestatistics.org/blog/index.php?pk=300388&T=0

Globally Unique Identifier (entire table): ba.freestatistics.org/blog/index.php?pk=300388&T=0

As an alternative you can also use a QR Code:  

The GUIDs for individual cells are displayed in the table below:

Summary of computational transaction
Raw Input view raw input (R code)
Raw Outputview raw output of R engine
Computing time5 seconds
R ServerBig Analytics Cloud Computing Center


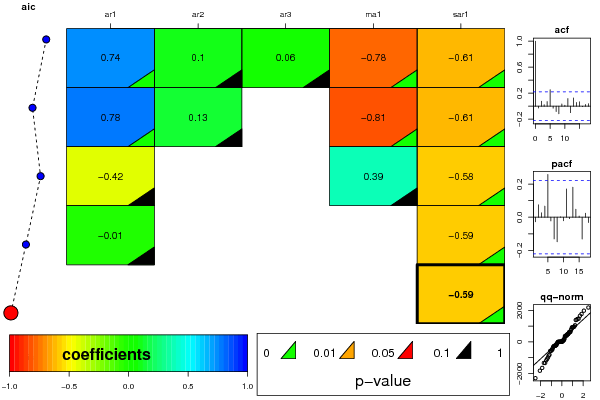
ARIMA Parameter Estimation and Backward Selection
Iterationar1ar2ar3ma1sar1
Estimates ( 1 )0.73990.09750.0605-0.778-0.6092
(p-val)(0.0016 )(0.5288 )(0.6761 )(1e-04 )(0 )
Estimates ( 2 )0.78330.13120-0.8136-0.6147
(p-val)(0 )(0.3252 )(NA )(0 )(0 )
Estimates ( 3 )-0.4188000.3929-0.5823
(p-val)(0.7382 )(NA )(NA )(0.7533 )(0 )
Estimates ( 4 )-0.0057000-0.5857
(p-val)(0.9649 )(NA )(NA )(NA )(0 )
Estimates ( 5 )0000-0.587
(p-val)(NA )(NA )(NA )(NA )(0 )
Estimates ( 6 )NANANANANA
(p-val)(NA )(NA )(NA )(NA )(NA )
Estimates ( 7 )NANANANANA
(p-val)(NA )(NA )(NA )(NA )(NA )
Estimates ( 8 )NANANANANA
(p-val)(NA )(NA )(NA )(NA )(NA )
Estimates ( 9 )NANANANANA
(p-val)(NA )(NA )(NA )(NA )(NA )

\begin{tabular}{lllllllll}
\hline
ARIMA Parameter Estimation and Backward Selection \tabularnewline
Iteration & ar1 & ar2 & ar3 & ma1 & sar1 \tabularnewline
Estimates ( 1 ) & 0.7399 & 0.0975 & 0.0605 & -0.778 & -0.6092 \tabularnewline
(p-val) & (0.0016 ) & (0.5288 ) & (0.6761 ) & (1e-04 ) & (0 ) \tabularnewline
Estimates ( 2 ) & 0.7833 & 0.1312 & 0 & -0.8136 & -0.6147 \tabularnewline
(p-val) & (0 ) & (0.3252 ) & (NA ) & (0 ) & (0 ) \tabularnewline
Estimates ( 3 ) & -0.4188 & 0 & 0 & 0.3929 & -0.5823 \tabularnewline
(p-val) & (0.7382 ) & (NA ) & (NA ) & (0.7533 ) & (0 ) \tabularnewline
Estimates ( 4 ) & -0.0057 & 0 & 0 & 0 & -0.5857 \tabularnewline
(p-val) & (0.9649 ) & (NA ) & (NA ) & (NA ) & (0 ) \tabularnewline
Estimates ( 5 ) & 0 & 0 & 0 & 0 & -0.587 \tabularnewline
(p-val) & (NA ) & (NA ) & (NA ) & (NA ) & (0 ) \tabularnewline
Estimates ( 6 ) & NA & NA & NA & NA & NA \tabularnewline
(p-val) & (NA ) & (NA ) & (NA ) & (NA ) & (NA ) \tabularnewline
Estimates ( 7 ) & NA & NA & NA & NA & NA \tabularnewline
(p-val) & (NA ) & (NA ) & (NA ) & (NA ) & (NA ) \tabularnewline
Estimates ( 8 ) & NA & NA & NA & NA & NA \tabularnewline
(p-val) & (NA ) & (NA ) & (NA ) & (NA ) & (NA ) \tabularnewline
Estimates ( 9 ) & NA & NA & NA & NA & NA \tabularnewline
(p-val) & (NA ) & (NA ) & (NA ) & (NA ) & (NA ) \tabularnewline
\hline
\end{tabular}
%Source: https://freestatistics.org/blog/index.php?pk=300388&T=1

[TABLE]
[ROW][C]ARIMA Parameter Estimation and Backward Selection[/C][/ROW]
[ROW][C]Iteration[/C][C]ar1[/C][C]ar2[/C][C]ar3[/C][C]ma1[/C][C]sar1[/C][/ROW]
[ROW][C]Estimates ( 1 )[/C][C]0.7399[/C][C]0.0975[/C][C]0.0605[/C][C]-0.778[/C][C]-0.6092[/C][/ROW]
[ROW][C](p-val)[/C][C](0.0016 )[/C][C](0.5288 )[/C][C](0.6761 )[/C][C](1e-04 )[/C][C](0 )[/C][/ROW]
[ROW][C]Estimates ( 2 )[/C][C]0.7833[/C][C]0.1312[/C][C]0[/C][C]-0.8136[/C][C]-0.6147[/C][/ROW]
[ROW][C](p-val)[/C][C](0 )[/C][C](0.3252 )[/C][C](NA )[/C][C](0 )[/C][C](0 )[/C][/ROW]
[ROW][C]Estimates ( 3 )[/C][C]-0.4188[/C][C]0[/C][C]0[/C][C]0.3929[/C][C]-0.5823[/C][/ROW]
[ROW][C](p-val)[/C][C](0.7382 )[/C][C](NA )[/C][C](NA )[/C][C](0.7533 )[/C][C](0 )[/C][/ROW]
[ROW][C]Estimates ( 4 )[/C][C]-0.0057[/C][C]0[/C][C]0[/C][C]0[/C][C]-0.5857[/C][/ROW]
[ROW][C](p-val)[/C][C](0.9649 )[/C][C](NA )[/C][C](NA )[/C][C](NA )[/C][C](0 )[/C][/ROW]
[ROW][C]Estimates ( 5 )[/C][C]0[/C][C]0[/C][C]0[/C][C]0[/C][C]-0.587[/C][/ROW]
[ROW][C](p-val)[/C][C](NA )[/C][C](NA )[/C][C](NA )[/C][C](NA )[/C][C](0 )[/C][/ROW]
[ROW][C]Estimates ( 6 )[/C][C]NA[/C][C]NA[/C][C]NA[/C][C]NA[/C][C]NA[/C][/ROW]
[ROW][C](p-val)[/C][C](NA )[/C][C](NA )[/C][C](NA )[/C][C](NA )[/C][C](NA )[/C][/ROW]
[ROW][C]Estimates ( 7 )[/C][C]NA[/C][C]NA[/C][C]NA[/C][C]NA[/C][C]NA[/C][/ROW]
[ROW][C](p-val)[/C][C](NA )[/C][C](NA )[/C][C](NA )[/C][C](NA )[/C][C](NA )[/C][/ROW]
[ROW][C]Estimates ( 8 )[/C][C]NA[/C][C]NA[/C][C]NA[/C][C]NA[/C][C]NA[/C][/ROW]
[ROW][C](p-val)[/C][C](NA )[/C][C](NA )[/C][C](NA )[/C][C](NA )[/C][C](NA )[/C][/ROW]
[ROW][C]Estimates ( 9 )[/C][C]NA[/C][C]NA[/C][C]NA[/C][C]NA[/C][C]NA[/C][/ROW]
[ROW][C](p-val)[/C][C](NA )[/C][C](NA )[/C][C](NA )[/C][C](NA )[/C][C](NA )[/C][/ROW]
[/TABLE]
Source: https://freestatistics.org/blog/index.php?pk=300388&T=1

Globally Unique Identifier (entire table): ba.freestatistics.org/blog/index.php?pk=300388&T=1

As an alternative you can also use a QR Code:  

The GUIDs for individual cells are displayed in the table below:

ARIMA Parameter Estimation and Backward Selection
Iterationar1ar2ar3ma1sar1
Estimates ( 1 )0.73990.09750.0605-0.778-0.6092
(p-val)(0.0016 )(0.5288 )(0.6761 )(1e-04 )(0 )
Estimates ( 2 )0.78330.13120-0.8136-0.6147
(p-val)(0 )(0.3252 )(NA )(0 )(0 )
Estimates ( 3 )-0.4188000.3929-0.5823
(p-val)(0.7382 )(NA )(NA )(0.7533 )(0 )
Estimates ( 4 )-0.0057000-0.5857
(p-val)(0.9649 )(NA )(NA )(NA )(0 )
Estimates ( 5 )0000-0.587
(p-val)(NA )(NA )(NA )(NA )(0 )
Estimates ( 6 )NANANANANA
(p-val)(NA )(NA )(NA )(NA )(NA )
Estimates ( 7 )NANANANANA
(p-val)(NA )(NA )(NA )(NA )(NA )
Estimates ( 8 )NANANANANA
(p-val)(NA )(NA )(NA )(NA )(NA )
Estimates ( 9 )NANANANANA
(p-val)(NA )(NA )(NA )(NA )(NA )


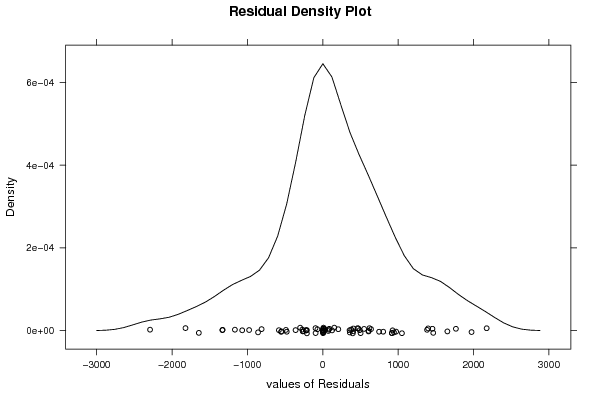
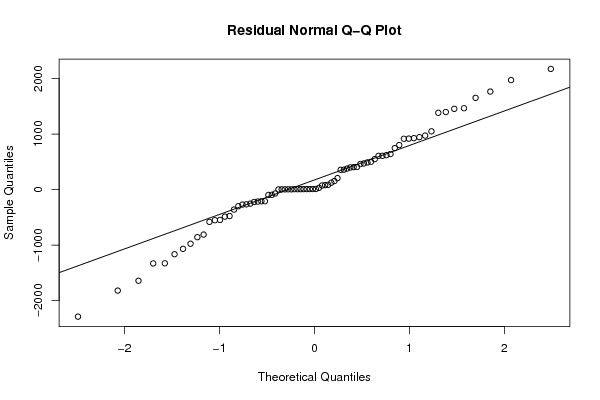
Estimated ARIMA Residuals
Value
4.67999646209505
1653.38434872282
-1644.05312346987
152.748537653718
-1068.93142005244
123.632392641718
973.333552954375
-253.848785217222
30.9591146413556
-1329.02138660942
608.46131100592
1397.56964161416
-94.8488916989166
-1165.54262166547
918.486837416038
-477.617395194639
1384.08354895989
-858.435082467477
-582.005436683973
-270.703569346857
501.916879566028
802.224420605739
-70.3107036355306
407.059941315846
-547.984302306998
2174.52608968119
1974.10114929826
619.650604911449
548.654297162131
640.768136596947
-266.147477886077
-488.385755831672
398.403846630335
73.1825796323301
-224.186798748218
-552.718206356607
915.7222027684
1050.45421622262
747.65045220866
1766.51243739142
-1331.76735032337
1455.30479291242
489.434072529815
944.99374222426
355.620186095241
79.6654164426873
607.299163217001
86.2839293300103
-216.635975497999
-210.404154888809
1466.25539361797
471.196966616935
-96.2677020184274
404.607610894715
-360.558654445207
460.842585201664
926.627615994685
-299.895159803189
206.291664833689
358.326025721124
-976.865932744446
-211.239352951545
-2291.40869657178
6.46447798383451
377.838152108839
-1821.29294556421
-811.47370174142

\begin{tabular}{lllllllll}
\hline
Estimated ARIMA Residuals \tabularnewline
Value \tabularnewline
4.67999646209505 \tabularnewline
1653.38434872282 \tabularnewline
-1644.05312346987 \tabularnewline
152.748537653718 \tabularnewline
-1068.93142005244 \tabularnewline
123.632392641718 \tabularnewline
973.333552954375 \tabularnewline
-253.848785217222 \tabularnewline
30.9591146413556 \tabularnewline
-1329.02138660942 \tabularnewline
608.46131100592 \tabularnewline
1397.56964161416 \tabularnewline
-94.8488916989166 \tabularnewline
-1165.54262166547 \tabularnewline
918.486837416038 \tabularnewline
-477.617395194639 \tabularnewline
1384.08354895989 \tabularnewline
-858.435082467477 \tabularnewline
-582.005436683973 \tabularnewline
-270.703569346857 \tabularnewline
501.916879566028 \tabularnewline
802.224420605739 \tabularnewline
-70.3107036355306 \tabularnewline
407.059941315846 \tabularnewline
-547.984302306998 \tabularnewline
2174.52608968119 \tabularnewline
1974.10114929826 \tabularnewline
619.650604911449 \tabularnewline
548.654297162131 \tabularnewline
640.768136596947 \tabularnewline
-266.147477886077 \tabularnewline
-488.385755831672 \tabularnewline
398.403846630335 \tabularnewline
73.1825796323301 \tabularnewline
-224.186798748218 \tabularnewline
-552.718206356607 \tabularnewline
915.7222027684 \tabularnewline
1050.45421622262 \tabularnewline
747.65045220866 \tabularnewline
1766.51243739142 \tabularnewline
-1331.76735032337 \tabularnewline
1455.30479291242 \tabularnewline
489.434072529815 \tabularnewline
944.99374222426 \tabularnewline
355.620186095241 \tabularnewline
79.6654164426873 \tabularnewline
607.299163217001 \tabularnewline
86.2839293300103 \tabularnewline
-216.635975497999 \tabularnewline
-210.404154888809 \tabularnewline
1466.25539361797 \tabularnewline
471.196966616935 \tabularnewline
-96.2677020184274 \tabularnewline
404.607610894715 \tabularnewline
-360.558654445207 \tabularnewline
460.842585201664 \tabularnewline
926.627615994685 \tabularnewline
-299.895159803189 \tabularnewline
206.291664833689 \tabularnewline
358.326025721124 \tabularnewline
-976.865932744446 \tabularnewline
-211.239352951545 \tabularnewline
-2291.40869657178 \tabularnewline
6.46447798383451 \tabularnewline
377.838152108839 \tabularnewline
-1821.29294556421 \tabularnewline
-811.47370174142 \tabularnewline
\hline
\end{tabular}
%Source: https://freestatistics.org/blog/index.php?pk=300388&T=2

[TABLE]
[ROW][C]Estimated ARIMA Residuals[/C][/ROW]
[ROW][C]Value[/C][/ROW]
[ROW][C]4.67999646209505[/C][/ROW]
[ROW][C]1653.38434872282[/C][/ROW]
[ROW][C]-1644.05312346987[/C][/ROW]
[ROW][C]152.748537653718[/C][/ROW]
[ROW][C]-1068.93142005244[/C][/ROW]
[ROW][C]123.632392641718[/C][/ROW]
[ROW][C]973.333552954375[/C][/ROW]
[ROW][C]-253.848785217222[/C][/ROW]
[ROW][C]30.9591146413556[/C][/ROW]
[ROW][C]-1329.02138660942[/C][/ROW]
[ROW][C]608.46131100592[/C][/ROW]
[ROW][C]1397.56964161416[/C][/ROW]
[ROW][C]-94.8488916989166[/C][/ROW]
[ROW][C]-1165.54262166547[/C][/ROW]
[ROW][C]918.486837416038[/C][/ROW]
[ROW][C]-477.617395194639[/C][/ROW]
[ROW][C]1384.08354895989[/C][/ROW]
[ROW][C]-858.435082467477[/C][/ROW]
[ROW][C]-582.005436683973[/C][/ROW]
[ROW][C]-270.703569346857[/C][/ROW]
[ROW][C]501.916879566028[/C][/ROW]
[ROW][C]802.224420605739[/C][/ROW]
[ROW][C]-70.3107036355306[/C][/ROW]
[ROW][C]407.059941315846[/C][/ROW]
[ROW][C]-547.984302306998[/C][/ROW]
[ROW][C]2174.52608968119[/C][/ROW]
[ROW][C]1974.10114929826[/C][/ROW]
[ROW][C]619.650604911449[/C][/ROW]
[ROW][C]548.654297162131[/C][/ROW]
[ROW][C]640.768136596947[/C][/ROW]
[ROW][C]-266.147477886077[/C][/ROW]
[ROW][C]-488.385755831672[/C][/ROW]
[ROW][C]398.403846630335[/C][/ROW]
[ROW][C]73.1825796323301[/C][/ROW]
[ROW][C]-224.186798748218[/C][/ROW]
[ROW][C]-552.718206356607[/C][/ROW]
[ROW][C]915.7222027684[/C][/ROW]
[ROW][C]1050.45421622262[/C][/ROW]
[ROW][C]747.65045220866[/C][/ROW]
[ROW][C]1766.51243739142[/C][/ROW]
[ROW][C]-1331.76735032337[/C][/ROW]
[ROW][C]1455.30479291242[/C][/ROW]
[ROW][C]489.434072529815[/C][/ROW]
[ROW][C]944.99374222426[/C][/ROW]
[ROW][C]355.620186095241[/C][/ROW]
[ROW][C]79.6654164426873[/C][/ROW]
[ROW][C]607.299163217001[/C][/ROW]
[ROW][C]86.2839293300103[/C][/ROW]
[ROW][C]-216.635975497999[/C][/ROW]
[ROW][C]-210.404154888809[/C][/ROW]
[ROW][C]1466.25539361797[/C][/ROW]
[ROW][C]471.196966616935[/C][/ROW]
[ROW][C]-96.2677020184274[/C][/ROW]
[ROW][C]404.607610894715[/C][/ROW]
[ROW][C]-360.558654445207[/C][/ROW]
[ROW][C]460.842585201664[/C][/ROW]
[ROW][C]926.627615994685[/C][/ROW]
[ROW][C]-299.895159803189[/C][/ROW]
[ROW][C]206.291664833689[/C][/ROW]
[ROW][C]358.326025721124[/C][/ROW]
[ROW][C]-976.865932744446[/C][/ROW]
[ROW][C]-211.239352951545[/C][/ROW]
[ROW][C]-2291.40869657178[/C][/ROW]
[ROW][C]6.46447798383451[/C][/ROW]
[ROW][C]377.838152108839[/C][/ROW]
[ROW][C]-1821.29294556421[/C][/ROW]
[ROW][C]-811.47370174142[/C][/ROW]
[/TABLE]
Source: https://freestatistics.org/blog/index.php?pk=300388&T=2

Globally Unique Identifier (entire table): ba.freestatistics.org/blog/index.php?pk=300388&T=2

As an alternative you can also use a QR Code:  

The GUIDs for individual cells are displayed in the table below:

Estimated ARIMA Residuals
Value
4.67999646209505
1653.38434872282
-1644.05312346987
152.748537653718
-1068.93142005244
123.632392641718
973.333552954375
-253.848785217222
30.9591146413556
-1329.02138660942
608.46131100592
1397.56964161416
-94.8488916989166
-1165.54262166547
918.486837416038
-477.617395194639
1384.08354895989
-858.435082467477
-582.005436683973
-270.703569346857
501.916879566028
802.224420605739
-70.3107036355306
407.059941315846
-547.984302306998
2174.52608968119
1974.10114929826
619.650604911449
548.654297162131
640.768136596947
-266.147477886077
-488.385755831672
398.403846630335
73.1825796323301
-224.186798748218
-552.718206356607
915.7222027684
1050.45421622262
747.65045220866
1766.51243739142
-1331.76735032337
1455.30479291242
489.434072529815
944.99374222426
355.620186095241
79.6654164426873
607.299163217001
86.2839293300103
-216.635975497999
-210.404154888809
1466.25539361797
471.196966616935
-96.2677020184274
404.607610894715
-360.558654445207
460.842585201664
926.627615994685
-299.895159803189
206.291664833689
358.326025721124
-976.865932744446
-211.239352951545
-2291.40869657178
6.46447798383451
377.838152108839
-1821.29294556421
-811.47370174142


Parameters (Session):
par1 = FALSE ; par2 = 1 ; par3 = 2 ; par4 = 0 ; par5 = 1 ; par6 = 3 ; par7 = 1 ; par8 = 2 ; par9 = 0 ;
Parameters (R input):
par1 = FALSE ; par2 = 1 ; par3 = 0 ; par4 = 1 ; par5 = 12 ; par6 = 3 ; par7 = 1 ; par8 = 1 ; par9 = 0 ;
R code (references can be found in the software module):
par9 <- '0'
par8 <- '1'
par7 <- '1'
par6 <- '3'
par5 <- '1'
par4 <- '0'
par3 <- '2'
par2 <- '1'
par1 <- 'FALSE'
library(lattice)
if (par1 == 'TRUE') par1 <- TRUE
if (par1 == 'FALSE') par1 <- FALSE
par2 <- as.numeric(par2) #Box-Cox lambda transformation parameter
par3 <- as.numeric(par3) #degree of non-seasonal differencing
par4 <- as.numeric(par4) #degree of seasonal differencing
par5 <- as.numeric(par5) #seasonal period
par6 <- as.numeric(par6) #degree (p) of the non-seasonal AR(p) polynomial
par7 <- as.numeric(par7) #degree (q) of the non-seasonal MA(q) polynomial
par8 <- as.numeric(par8) #degree (P) of the seasonal AR(P) polynomial
par9 <- as.numeric(par9) #degree (Q) of the seasonal MA(Q) polynomial
armaGR <- function(arima.out, names, n){
try1 <- arima.out$coef
try2 <- sqrt(diag(arima.out$var.coef))
try.data.frame <- data.frame(matrix(NA,ncol=4,nrow=length(names)))
dimnames(try.data.frame) <- list(names,c('coef','std','tstat','pv'))
try.data.frame[,1] <- try1
for(i in 1:length(try2)) try.data.frame[which(rownames(try.data.frame)==names(try2)[i]),2] <- try2[i]
try.data.frame[,3] <- try.data.frame[,1] / try.data.frame[,2]
try.data.frame[,4] <- round((1-pt(abs(try.data.frame[,3]),df=n-(length(try2)+1)))*2,5)
vector <- rep(NA,length(names))
vector[is.na(try.data.frame[,4])] <- 0
maxi <- which.max(try.data.frame[,4])
continue <- max(try.data.frame[,4],na.rm=TRUE) > .05
vector[maxi] <- 0
list(summary=try.data.frame,next.vector=vector,continue=continue)
}
arimaSelect <- function(series, order=c(13,0,0), seasonal=list(order=c(2,0,0),period=12), include.mean=F){
nrc <- order[1]+order[3]+seasonal$order[1]+seasonal$order[3]
coeff <- matrix(NA, nrow=nrc*2, ncol=nrc)
pval <- matrix(NA, nrow=nrc*2, ncol=nrc)
mylist <- rep(list(NULL), nrc)
names <- NULL
if(order[1] > 0) names <- paste('ar',1:order[1],sep='')
if(order[3] > 0) names <- c( names , paste('ma',1:order[3],sep='') )
if(seasonal$order[1] > 0) names <- c(names, paste('sar',1:seasonal$order[1],sep=''))
if(seasonal$order[3] > 0) names <- c(names, paste('sma',1:seasonal$order[3],sep=''))
arima.out <- arima(series, order=order, seasonal=seasonal, include.mean=include.mean, method='ML')
mylist[[1]] <- arima.out
last.arma <- armaGR(arima.out, names, length(series))
mystop <- FALSE
i <- 1
coeff[i,] <- last.arma[[1]][,1]
pval [i,] <- last.arma[[1]][,4]
i <- 2
aic <- arima.out$aic
while(!mystop){
mylist[[i]] <- arima.out
arima.out <- arima(series, order=order, seasonal=seasonal, include.mean=include.mean, method='ML', fixed=last.arma$next.vector)
aic <- c(aic, arima.out$aic)
last.arma <- armaGR(arima.out, names, length(series))
mystop <- !last.arma$continue
coeff[i,] <- last.arma[[1]][,1]
pval [i,] <- last.arma[[1]][,4]
i <- i+1
}
list(coeff, pval, mylist, aic=aic)
}
arimaSelectplot <- function(arimaSelect.out,noms,choix){
noms <- names(arimaSelect.out[[3]][[1]]$coef)
coeff <- arimaSelect.out[[1]]
k <- min(which(is.na(coeff[,1])))-1
coeff <- coeff[1:k,]
pval <- arimaSelect.out[[2]][1:k,]
aic <- arimaSelect.out$aic[1:k]
coeff[coeff==0] <- NA
n <- ncol(coeff)
if(missing(choix)) choix <- k
layout(matrix(c(1,1,1,2,
3,3,3,2,
3,3,3,4,
5,6,7,7),nr=4),
widths=c(10,35,45,15),
heights=c(30,30,15,15))
couleurs <- rainbow(75)[1:50]#(50)
ticks <- pretty(coeff)
par(mar=c(1,1,3,1))
plot(aic,k:1-.5,type='o',pch=21,bg='blue',cex=2,axes=F,lty=2,xpd=NA)
points(aic[choix],k-choix+.5,pch=21,cex=4,bg=2,xpd=NA)
title('aic',line=2)
par(mar=c(3,0,0,0))
plot(0,axes=F,xlab='',ylab='',xlim=range(ticks),ylim=c(.1,1))
rect(xleft = min(ticks) + (0:49)/50*(max(ticks)-min(ticks)),
xright = min(ticks) + (1:50)/50*(max(ticks)-min(ticks)),
ytop = rep(1,50),
ybottom= rep(0,50),col=couleurs,border=NA)
axis(1,ticks)
rect(xleft=min(ticks),xright=max(ticks),ytop=1,ybottom=0)
text(mean(coeff,na.rm=T),.5,'coefficients',cex=2,font=2)
par(mar=c(1,1,3,1))
image(1:n,1:k,t(coeff[k:1,]),axes=F,col=couleurs,zlim=range(ticks))
for(i in 1:n) for(j in 1:k) if(!is.na(coeff[j,i])) {
if(pval[j,i]<.01) symb = 'green'
else if( (pval[j,i]<.05) & (pval[j,i]>=.01)) symb = 'orange'
else if( (pval[j,i]<.1) & (pval[j,i]>=.05)) symb = 'red'
else symb = 'black'
polygon(c(i+.5 ,i+.2 ,i+.5 ,i+.5),
c(k-j+0.5,k-j+0.5,k-j+0.8,k-j+0.5),
col=symb)
if(j==choix) {
rect(xleft=i-.5,
xright=i+.5,
ybottom=k-j+1.5,
ytop=k-j+.5,
lwd=4)
text(i,
k-j+1,
round(coeff[j,i],2),
cex=1.2,
font=2)
}
else{
rect(xleft=i-.5,xright=i+.5,ybottom=k-j+1.5,ytop=k-j+.5)
text(i,k-j+1,round(coeff[j,i],2),cex=1.2,font=1)
}
}
axis(3,1:n,noms)
par(mar=c(0.5,0,0,0.5))
plot(0,axes=F,xlab='',ylab='',type='n',xlim=c(0,8),ylim=c(-.2,.8))
cols <- c('green','orange','red','black')
niv <- c('0','0.01','0.05','0.1')
for(i in 0:3){
polygon(c(1+2*i ,1+2*i ,1+2*i-.5 ,1+2*i),
c(.4 ,.7 , .4 , .4),
col=cols[i+1])
text(2*i,0.5,niv[i+1],cex=1.5)
}
text(8,.5,1,cex=1.5)
text(4,0,'p-value',cex=2)
box()
residus <- arimaSelect.out[[3]][[choix]]$res
par(mar=c(1,2,4,1))
acf(residus,main='')
title('acf',line=.5)
par(mar=c(1,2,4,1))
pacf(residus,main='')
title('pacf',line=.5)
par(mar=c(2,2,4,1))
qqnorm(residus,main='')
title('qq-norm',line=.5)
qqline(residus)
residus
}
if (par2 == 0) x <- log(x)
if (par2 != 0) x <- x^par2
(selection <- arimaSelect(x, order=c(par6,par3,par7), seasonal=list(order=c(par8,par4,par9), period=par5)))
bitmap(file='test1.png')
resid <- arimaSelectplot(selection)
dev.off()
resid
bitmap(file='test2.png')
acf(resid,length(resid)/2, main='Residual Autocorrelation Function')
dev.off()
bitmap(file='test3.png')
pacf(resid,length(resid)/2, main='Residual Partial Autocorrelation Function')
dev.off()
bitmap(file='test4.png')
cpgram(resid, main='Residual Cumulative Periodogram')
dev.off()
bitmap(file='test5.png')
hist(resid, main='Residual Histogram', xlab='values of Residuals')
dev.off()
bitmap(file='test6.png')
densityplot(~resid,col='black',main='Residual Density Plot', xlab='values of Residuals')
dev.off()
bitmap(file='test7.png')
qqnorm(resid, main='Residual Normal Q-Q Plot')
qqline(resid)
dev.off()
ncols <- length(selection[[1]][1,])
nrows <- length(selection[[2]][,1])-1
load(file='createtable')
a<-table.start()
a<-table.row.start(a)
a<-table.element(a,'ARIMA Parameter Estimation and Backward Selection', ncols+1,TRUE)
a<-table.row.end(a)
a<-table.row.start(a)
a<-table.element(a,'Iteration', header=TRUE)
for (i in 1:ncols) {
a<-table.element(a,names(selection[[3]][[1]]$coef)[i],header=TRUE)
}
a<-table.row.end(a)
for (j in 1:nrows) {
a<-table.row.start(a)
mydum <- 'Estimates ('
mydum <- paste(mydum,j)
mydum <- paste(mydum,')')
a<-table.element(a,mydum, header=TRUE)
for (i in 1:ncols) {
a<-table.element(a,round(selection[[1]][j,i],4))
}
a<-table.row.end(a)
a<-table.row.start(a)
a<-table.element(a,'(p-val)', header=TRUE)
for (i in 1:ncols) {
mydum <- '('
mydum <- paste(mydum,round(selection[[2]][j,i],4),sep='')
mydum <- paste(mydum,')')
a<-table.element(a,mydum)
}
a<-table.row.end(a)
}
a<-table.end(a)
table.save(a,file='mytable.tab')
a<-table.start()
a<-table.row.start(a)
a<-table.element(a,'Estimated ARIMA Residuals', 1,TRUE)
a<-table.row.end(a)
a<-table.row.start(a)
a<-table.element(a,'Value', 1,TRUE)
a<-table.row.end(a)
for (i in (par4*par5+par3):length(resid)) {
a<-table.row.start(a)
a<-table.element(a,resid[i])
a<-table.row.end(a)
}
a<-table.end(a)
table.save(a,file='mytable1.tab')