Free Statistics

of Irreproducible Research!

Author's title

Author*The author of this computation has been verified*
R Software Modulerwasp_arimabackwardselection.wasp
Title produced by softwareARIMA Backward Selection
Date of computationFri, 16 Dec 2016 16:51:32 +0100
Cite this page as followsStatistical Computations at FreeStatistics.org, Office for Research Development and Education, URL https://freestatistics.org/blog/index.php?v=date/2016/Dec/16/t14819035189j18jvhx0ro1zpz.htm/, Retrieved Thu, 02 May 2024 21:27:46 +0000
Statistical Computations at FreeStatistics.org, Office for Research Development and Education, URL https://freestatistics.org/blog/index.php?pk=300392, Retrieved Thu, 02 May 2024 21:27:46 +0000
QR Codes:

Original text written by user:
IsPrivate?No (this computation is public)
User-defined keywords
Estimated Impact64
Family? (F = Feedback message, R = changed R code, M = changed R Module, P = changed Parameters, D = changed Data)
-     [ARIMA Forecasting] [Arima forecast 3e] [2016-12-14 14:39:22] [5f979cb1c6fa86b57093c7542788c28c]
- RMPD    [ARIMA Backward Selection] [tfzgdheujf] [2016-12-16 15:51:32] [4c05fa0998bf98e29c2e453b139976f4] [Current]
Feedback Forum

Post a new message
Dataseries X:
5345
5245
5100
5070
5035
5050
5065
5255
5335
5440
5490
5445
5675
5615
5545
5510
5570
5610
5555
5630
5685
5545
5625
5570
5555
5635
5535
5430
5400
5410
5255
5350
5405
5420
5430
5580
5595
5485
5295
5055
4975
4895
4795
4855
4785
4875
5010
4970
4995
5020
4950
4880
4850
4885
4785
5025
5030
5160
5240
5175
5130
5140
5140
5055
5015
5015
4920
5095
5010
5100
5115
5060
5035
5005
4960
5035
4980
4940
4810
5025
5035
5060
5140
4955
5135
5135
5070
5070
5005
5045
4975
5080
5125
5225
5240
5090
5105
5200
5115
4990
4905
4980
4840
4960
4970
5035
5030
4965
4925
4920
4895
4890
4895
4850
4830
4870


Summary of computational transaction
Raw Input view raw input (R code)
Raw Outputview raw output of R engine
Computing time11 seconds
R ServerBig Analytics Cloud Computing Center

\begin{tabular}{lllllllll}
\hline
Summary of computational transaction \tabularnewline
Raw Input view raw input (R code)  \tabularnewline
Raw Outputview raw output of R engine  \tabularnewline
Computing time11 seconds \tabularnewline
R ServerBig Analytics Cloud Computing Center \tabularnewline
\hline
\end{tabular}
%Source: https://freestatistics.org/blog/index.php?pk=300392&T=0

[TABLE]
[ROW]
Summary of computational transaction[/C][/ROW] [ROW]Raw Input[/C] view raw input (R code) [/C][/ROW] [ROW]Raw Output[/C]view raw output of R engine [/C][/ROW] [ROW]Computing time[/C]11 seconds[/C][/ROW] [ROW]R Server[/C]Big Analytics Cloud Computing Center[/C][/ROW] [/TABLE] Source: https://freestatistics.org/blog/index.php?pk=300392&T=0

Globally Unique Identifier (entire table): ba.freestatistics.org/blog/index.php?pk=300392&T=0

As an alternative you can also use a QR Code:  

The GUIDs for individual cells are displayed in the table below:

Summary of computational transaction
Raw Input view raw input (R code)
Raw Outputview raw output of R engine
Computing time11 seconds
R ServerBig Analytics Cloud Computing Center


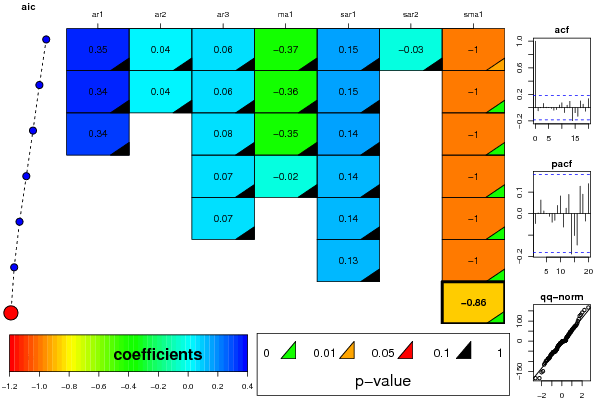
ARIMA Parameter Estimation and Backward Selection
Iterationar1ar2ar3ma1sar1sar2sma1
Estimates ( 1 )0.34580.04490.0603-0.37210.1473-0.0261-0.9979
(p-val)(0.651 )(0.6781 )(0.6008 )(0.6261 )(0.2139 )(0.8299 )(0.0337 )
Estimates ( 2 )0.33690.04370.0632-0.3620.15020-1.0003
(p-val)(0.6609 )(0.6849 )(0.579 )(0.6369 )(0.2034 )(NA )(0.0035 )
Estimates ( 3 )0.335200.0766-0.34710.14490-0.9996
(p-val)(0.7004 )(NA )(0.4424 )(0.6799 )(0.2173 )(NA )(0.0026 )
Estimates ( 4 )000.0723-0.02340.14270-0.9996
(p-val)(NA )(NA )(0.4808 )(0.8096 )(0.2241 )(NA )(0.0034 )
Estimates ( 5 )000.070400.14020-0.9996
(p-val)(NA )(NA )(0.4909 )(NA )(0.23 )(NA )(0.002 )
Estimates ( 6 )00000.12590-1.0003
(p-val)(NA )(NA )(NA )(NA )(0.274 )(NA )(3e-04 )
Estimates ( 7 )000000-0.8558
(p-val)(NA )(NA )(NA )(NA )(NA )(NA )(0 )
Estimates ( 8 )NANANANANANANA
(p-val)(NA )(NA )(NA )(NA )(NA )(NA )(NA )
Estimates ( 9 )NANANANANANANA
(p-val)(NA )(NA )(NA )(NA )(NA )(NA )(NA )
Estimates ( 10 )NANANANANANANA
(p-val)(NA )(NA )(NA )(NA )(NA )(NA )(NA )
Estimates ( 11 )NANANANANANANA
(p-val)(NA )(NA )(NA )(NA )(NA )(NA )(NA )
Estimates ( 12 )NANANANANANANA
(p-val)(NA )(NA )(NA )(NA )(NA )(NA )(NA )
Estimates ( 13 )NANANANANANANA
(p-val)(NA )(NA )(NA )(NA )(NA )(NA )(NA )

\begin{tabular}{lllllllll}
\hline
ARIMA Parameter Estimation and Backward Selection \tabularnewline
Iteration & ar1 & ar2 & ar3 & ma1 & sar1 & sar2 & sma1 \tabularnewline
Estimates ( 1 ) & 0.3458 & 0.0449 & 0.0603 & -0.3721 & 0.1473 & -0.0261 & -0.9979 \tabularnewline
(p-val) & (0.651 ) & (0.6781 ) & (0.6008 ) & (0.6261 ) & (0.2139 ) & (0.8299 ) & (0.0337 ) \tabularnewline
Estimates ( 2 ) & 0.3369 & 0.0437 & 0.0632 & -0.362 & 0.1502 & 0 & -1.0003 \tabularnewline
(p-val) & (0.6609 ) & (0.6849 ) & (0.579 ) & (0.6369 ) & (0.2034 ) & (NA ) & (0.0035 ) \tabularnewline
Estimates ( 3 ) & 0.3352 & 0 & 0.0766 & -0.3471 & 0.1449 & 0 & -0.9996 \tabularnewline
(p-val) & (0.7004 ) & (NA ) & (0.4424 ) & (0.6799 ) & (0.2173 ) & (NA ) & (0.0026 ) \tabularnewline
Estimates ( 4 ) & 0 & 0 & 0.0723 & -0.0234 & 0.1427 & 0 & -0.9996 \tabularnewline
(p-val) & (NA ) & (NA ) & (0.4808 ) & (0.8096 ) & (0.2241 ) & (NA ) & (0.0034 ) \tabularnewline
Estimates ( 5 ) & 0 & 0 & 0.0704 & 0 & 0.1402 & 0 & -0.9996 \tabularnewline
(p-val) & (NA ) & (NA ) & (0.4909 ) & (NA ) & (0.23 ) & (NA ) & (0.002 ) \tabularnewline
Estimates ( 6 ) & 0 & 0 & 0 & 0 & 0.1259 & 0 & -1.0003 \tabularnewline
(p-val) & (NA ) & (NA ) & (NA ) & (NA ) & (0.274 ) & (NA ) & (3e-04 ) \tabularnewline
Estimates ( 7 ) & 0 & 0 & 0 & 0 & 0 & 0 & -0.8558 \tabularnewline
(p-val) & (NA ) & (NA ) & (NA ) & (NA ) & (NA ) & (NA ) & (0 ) \tabularnewline
Estimates ( 8 ) & NA & NA & NA & NA & NA & NA & NA \tabularnewline
(p-val) & (NA ) & (NA ) & (NA ) & (NA ) & (NA ) & (NA ) & (NA ) \tabularnewline
Estimates ( 9 ) & NA & NA & NA & NA & NA & NA & NA \tabularnewline
(p-val) & (NA ) & (NA ) & (NA ) & (NA ) & (NA ) & (NA ) & (NA ) \tabularnewline
Estimates ( 10 ) & NA & NA & NA & NA & NA & NA & NA \tabularnewline
(p-val) & (NA ) & (NA ) & (NA ) & (NA ) & (NA ) & (NA ) & (NA ) \tabularnewline
Estimates ( 11 ) & NA & NA & NA & NA & NA & NA & NA \tabularnewline
(p-val) & (NA ) & (NA ) & (NA ) & (NA ) & (NA ) & (NA ) & (NA ) \tabularnewline
Estimates ( 12 ) & NA & NA & NA & NA & NA & NA & NA \tabularnewline
(p-val) & (NA ) & (NA ) & (NA ) & (NA ) & (NA ) & (NA ) & (NA ) \tabularnewline
Estimates ( 13 ) & NA & NA & NA & NA & NA & NA & NA \tabularnewline
(p-val) & (NA ) & (NA ) & (NA ) & (NA ) & (NA ) & (NA ) & (NA ) \tabularnewline
\hline
\end{tabular}
%Source: https://freestatistics.org/blog/index.php?pk=300392&T=1

[TABLE]
[ROW][C]ARIMA Parameter Estimation and Backward Selection[/C][/ROW]
[ROW][C]Iteration[/C][C]ar1[/C][C]ar2[/C][C]ar3[/C][C]ma1[/C][C]sar1[/C][C]sar2[/C][C]sma1[/C][/ROW]
[ROW][C]Estimates ( 1 )[/C][C]0.3458[/C][C]0.0449[/C][C]0.0603[/C][C]-0.3721[/C][C]0.1473[/C][C]-0.0261[/C][C]-0.9979[/C][/ROW]
[ROW][C](p-val)[/C][C](0.651 )[/C][C](0.6781 )[/C][C](0.6008 )[/C][C](0.6261 )[/C][C](0.2139 )[/C][C](0.8299 )[/C][C](0.0337 )[/C][/ROW]
[ROW][C]Estimates ( 2 )[/C][C]0.3369[/C][C]0.0437[/C][C]0.0632[/C][C]-0.362[/C][C]0.1502[/C][C]0[/C][C]-1.0003[/C][/ROW]
[ROW][C](p-val)[/C][C](0.6609 )[/C][C](0.6849 )[/C][C](0.579 )[/C][C](0.6369 )[/C][C](0.2034 )[/C][C](NA )[/C][C](0.0035 )[/C][/ROW]
[ROW][C]Estimates ( 3 )[/C][C]0.3352[/C][C]0[/C][C]0.0766[/C][C]-0.3471[/C][C]0.1449[/C][C]0[/C][C]-0.9996[/C][/ROW]
[ROW][C](p-val)[/C][C](0.7004 )[/C][C](NA )[/C][C](0.4424 )[/C][C](0.6799 )[/C][C](0.2173 )[/C][C](NA )[/C][C](0.0026 )[/C][/ROW]
[ROW][C]Estimates ( 4 )[/C][C]0[/C][C]0[/C][C]0.0723[/C][C]-0.0234[/C][C]0.1427[/C][C]0[/C][C]-0.9996[/C][/ROW]
[ROW][C](p-val)[/C][C](NA )[/C][C](NA )[/C][C](0.4808 )[/C][C](0.8096 )[/C][C](0.2241 )[/C][C](NA )[/C][C](0.0034 )[/C][/ROW]
[ROW][C]Estimates ( 5 )[/C][C]0[/C][C]0[/C][C]0.0704[/C][C]0[/C][C]0.1402[/C][C]0[/C][C]-0.9996[/C][/ROW]
[ROW][C](p-val)[/C][C](NA )[/C][C](NA )[/C][C](0.4909 )[/C][C](NA )[/C][C](0.23 )[/C][C](NA )[/C][C](0.002 )[/C][/ROW]
[ROW][C]Estimates ( 6 )[/C][C]0[/C][C]0[/C][C]0[/C][C]0[/C][C]0.1259[/C][C]0[/C][C]-1.0003[/C][/ROW]
[ROW][C](p-val)[/C][C](NA )[/C][C](NA )[/C][C](NA )[/C][C](NA )[/C][C](0.274 )[/C][C](NA )[/C][C](3e-04 )[/C][/ROW]
[ROW][C]Estimates ( 7 )[/C][C]0[/C][C]0[/C][C]0[/C][C]0[/C][C]0[/C][C]0[/C][C]-0.8558[/C][/ROW]
[ROW][C](p-val)[/C][C](NA )[/C][C](NA )[/C][C](NA )[/C][C](NA )[/C][C](NA )[/C][C](NA )[/C][C](0 )[/C][/ROW]
[ROW][C]Estimates ( 8 )[/C][C]NA[/C][C]NA[/C][C]NA[/C][C]NA[/C][C]NA[/C][C]NA[/C][C]NA[/C][/ROW]
[ROW][C](p-val)[/C][C](NA )[/C][C](NA )[/C][C](NA )[/C][C](NA )[/C][C](NA )[/C][C](NA )[/C][C](NA )[/C][/ROW]
[ROW][C]Estimates ( 9 )[/C][C]NA[/C][C]NA[/C][C]NA[/C][C]NA[/C][C]NA[/C][C]NA[/C][C]NA[/C][/ROW]
[ROW][C](p-val)[/C][C](NA )[/C][C](NA )[/C][C](NA )[/C][C](NA )[/C][C](NA )[/C][C](NA )[/C][C](NA )[/C][/ROW]
[ROW][C]Estimates ( 10 )[/C][C]NA[/C][C]NA[/C][C]NA[/C][C]NA[/C][C]NA[/C][C]NA[/C][C]NA[/C][/ROW]
[ROW][C](p-val)[/C][C](NA )[/C][C](NA )[/C][C](NA )[/C][C](NA )[/C][C](NA )[/C][C](NA )[/C][C](NA )[/C][/ROW]
[ROW][C]Estimates ( 11 )[/C][C]NA[/C][C]NA[/C][C]NA[/C][C]NA[/C][C]NA[/C][C]NA[/C][C]NA[/C][/ROW]
[ROW][C](p-val)[/C][C](NA )[/C][C](NA )[/C][C](NA )[/C][C](NA )[/C][C](NA )[/C][C](NA )[/C][C](NA )[/C][/ROW]
[ROW][C]Estimates ( 12 )[/C][C]NA[/C][C]NA[/C][C]NA[/C][C]NA[/C][C]NA[/C][C]NA[/C][C]NA[/C][/ROW]
[ROW][C](p-val)[/C][C](NA )[/C][C](NA )[/C][C](NA )[/C][C](NA )[/C][C](NA )[/C][C](NA )[/C][C](NA )[/C][/ROW]
[ROW][C]Estimates ( 13 )[/C][C]NA[/C][C]NA[/C][C]NA[/C][C]NA[/C][C]NA[/C][C]NA[/C][C]NA[/C][/ROW]
[ROW][C](p-val)[/C][C](NA )[/C][C](NA )[/C][C](NA )[/C][C](NA )[/C][C](NA )[/C][C](NA )[/C][C](NA )[/C][/ROW]
[/TABLE]
Source: https://freestatistics.org/blog/index.php?pk=300392&T=1

Globally Unique Identifier (entire table): ba.freestatistics.org/blog/index.php?pk=300392&T=1

As an alternative you can also use a QR Code:  

The GUIDs for individual cells are displayed in the table below:

ARIMA Parameter Estimation and Backward Selection
Iterationar1ar2ar3ma1sar1sar2sma1
Estimates ( 1 )0.34580.04490.0603-0.37210.1473-0.0261-0.9979
(p-val)(0.651 )(0.6781 )(0.6008 )(0.6261 )(0.2139 )(0.8299 )(0.0337 )
Estimates ( 2 )0.33690.04370.0632-0.3620.15020-1.0003
(p-val)(0.6609 )(0.6849 )(0.579 )(0.6369 )(0.2034 )(NA )(0.0035 )
Estimates ( 3 )0.335200.0766-0.34710.14490-0.9996
(p-val)(0.7004 )(NA )(0.4424 )(0.6799 )(0.2173 )(NA )(0.0026 )
Estimates ( 4 )000.0723-0.02340.14270-0.9996
(p-val)(NA )(NA )(0.4808 )(0.8096 )(0.2241 )(NA )(0.0034 )
Estimates ( 5 )000.070400.14020-0.9996
(p-val)(NA )(NA )(0.4909 )(NA )(0.23 )(NA )(0.002 )
Estimates ( 6 )00000.12590-1.0003
(p-val)(NA )(NA )(NA )(NA )(0.274 )(NA )(3e-04 )
Estimates ( 7 )000000-0.8558
(p-val)(NA )(NA )(NA )(NA )(NA )(NA )(0 )
Estimates ( 8 )NANANANANANANA
(p-val)(NA )(NA )(NA )(NA )(NA )(NA )(NA )
Estimates ( 9 )NANANANANANANA
(p-val)(NA )(NA )(NA )(NA )(NA )(NA )(NA )
Estimates ( 10 )NANANANANANANA
(p-val)(NA )(NA )(NA )(NA )(NA )(NA )(NA )
Estimates ( 11 )NANANANANANANA
(p-val)(NA )(NA )(NA )(NA )(NA )(NA )(NA )
Estimates ( 12 )NANANANANANANA
(p-val)(NA )(NA )(NA )(NA )(NA )(NA )(NA )
Estimates ( 13 )NANANANANANANA
(p-val)(NA )(NA )(NA )(NA )(NA )(NA )(NA )


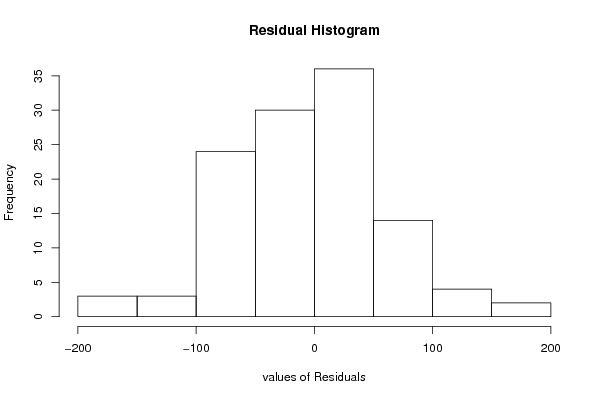
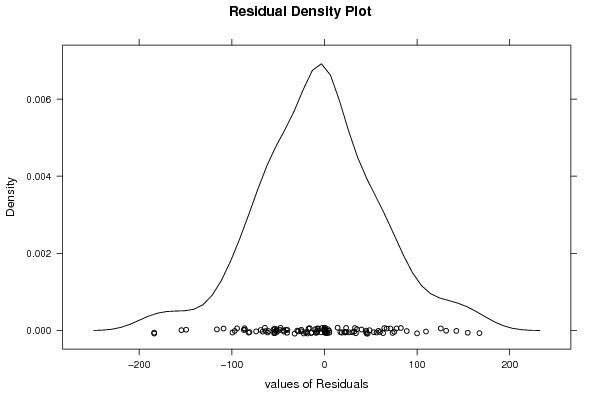
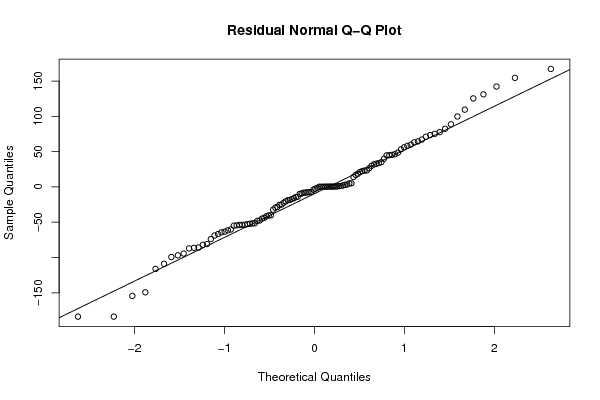
Estimated ARIMA Residuals
Value
-17.1202333703198
30.0019704233291
56.2558563145684
-3.7622332593829
71.2542350745551
18.7381539242348
-52.5328517229621
-86.2944166311264
-18.7801770557677
-183.825610471364
22.4738642966653
-7.53678367831742
-183.83854402649
131.346697983325
2.31192344365213
-60.2147551356542
-40.4452401737153
-15.9199571983014
-108.936588234684
-25.2541666867565
-9.12996822798578
39.9525791745192
-47.4694501545365
167.316034869283
-64.3134401464689
-85.8403443351195
-73.8028784431842
-154.466894106372
-63.4001943978131
-87.120850862339
-20.397186865769
-51.2961957353294
-116.111881842694
77.7633022322841
82.4837439448022
-66.7310701768196
-41.5311599815186
75.3994236417825
60.049903095116
46.5628277870938
0.692830761203133
45.0463984643724
-22.3187665894085
125.584462402189
-9.86102337553796
88.8319514908064
1.35142986471447
-53.5905931544511
-96.908007609885
32.9260353620614
99.9194261769378
5.07241445528153
-14.3690912758781
-8.16866872856524
-13.8461689538799
23.3281780227103
-99.3232905923101
32.0628440448693
-52.1338153818624
-32.1997696953679
-53.6070396625497
-7.34848730023512
35.134301161683
154.671286064393
-25.0013591210428
-40.0147285369775
-44.8844893681161
64.6208024532319
14.1485179161006
-28.3787153126387
23.5598094507196
-149.332142849595
142.387789901508
26.4490794289645
17.1631760292267
45.5156056765107
-29.3821233022724
44.8757076579929
21.291849479009
-51.571011868412
33.9251075681246
53.2742147109713
-48.0956177881083
-81.9103327985164
-54.8795036753904
109.588702717304
-1.30818965594104
-68.8249026890572
-43.7279315304283
63.2956717964796
-54.3891087114525
-18.4341847068578
-7.16807942521077
5.2150017537373
-53.7642644095449
3.56262992002174
-80.9392686297821
-8.00343109733228
58.2191881580152
67.1797815356035
48.6458283119251
-61.3775158673475
73.5580129478972
-94.3413359285504

\begin{tabular}{lllllllll}
\hline
Estimated ARIMA Residuals \tabularnewline
Value \tabularnewline
-17.1202333703198 \tabularnewline
30.0019704233291 \tabularnewline
56.2558563145684 \tabularnewline
-3.7622332593829 \tabularnewline
71.2542350745551 \tabularnewline
18.7381539242348 \tabularnewline
-52.5328517229621 \tabularnewline
-86.2944166311264 \tabularnewline
-18.7801770557677 \tabularnewline
-183.825610471364 \tabularnewline
22.4738642966653 \tabularnewline
-7.53678367831742 \tabularnewline
-183.83854402649 \tabularnewline
131.346697983325 \tabularnewline
2.31192344365213 \tabularnewline
-60.2147551356542 \tabularnewline
-40.4452401737153 \tabularnewline
-15.9199571983014 \tabularnewline
-108.936588234684 \tabularnewline
-25.2541666867565 \tabularnewline
-9.12996822798578 \tabularnewline
39.9525791745192 \tabularnewline
-47.4694501545365 \tabularnewline
167.316034869283 \tabularnewline
-64.3134401464689 \tabularnewline
-85.8403443351195 \tabularnewline
-73.8028784431842 \tabularnewline
-154.466894106372 \tabularnewline
-63.4001943978131 \tabularnewline
-87.120850862339 \tabularnewline
-20.397186865769 \tabularnewline
-51.2961957353294 \tabularnewline
-116.111881842694 \tabularnewline
77.7633022322841 \tabularnewline
82.4837439448022 \tabularnewline
-66.7310701768196 \tabularnewline
-41.5311599815186 \tabularnewline
75.3994236417825 \tabularnewline
60.049903095116 \tabularnewline
46.5628277870938 \tabularnewline
0.692830761203133 \tabularnewline
45.0463984643724 \tabularnewline
-22.3187665894085 \tabularnewline
125.584462402189 \tabularnewline
-9.86102337553796 \tabularnewline
88.8319514908064 \tabularnewline
1.35142986471447 \tabularnewline
-53.5905931544511 \tabularnewline
-96.908007609885 \tabularnewline
32.9260353620614 \tabularnewline
99.9194261769378 \tabularnewline
5.07241445528153 \tabularnewline
-14.3690912758781 \tabularnewline
-8.16866872856524 \tabularnewline
-13.8461689538799 \tabularnewline
23.3281780227103 \tabularnewline
-99.3232905923101 \tabularnewline
32.0628440448693 \tabularnewline
-52.1338153818624 \tabularnewline
-32.1997696953679 \tabularnewline
-53.6070396625497 \tabularnewline
-7.34848730023512 \tabularnewline
35.134301161683 \tabularnewline
154.671286064393 \tabularnewline
-25.0013591210428 \tabularnewline
-40.0147285369775 \tabularnewline
-44.8844893681161 \tabularnewline
64.6208024532319 \tabularnewline
14.1485179161006 \tabularnewline
-28.3787153126387 \tabularnewline
23.5598094507196 \tabularnewline
-149.332142849595 \tabularnewline
142.387789901508 \tabularnewline
26.4490794289645 \tabularnewline
17.1631760292267 \tabularnewline
45.5156056765107 \tabularnewline
-29.3821233022724 \tabularnewline
44.8757076579929 \tabularnewline
21.291849479009 \tabularnewline
-51.571011868412 \tabularnewline
33.9251075681246 \tabularnewline
53.2742147109713 \tabularnewline
-48.0956177881083 \tabularnewline
-81.9103327985164 \tabularnewline
-54.8795036753904 \tabularnewline
109.588702717304 \tabularnewline
-1.30818965594104 \tabularnewline
-68.8249026890572 \tabularnewline
-43.7279315304283 \tabularnewline
63.2956717964796 \tabularnewline
-54.3891087114525 \tabularnewline
-18.4341847068578 \tabularnewline
-7.16807942521077 \tabularnewline
5.2150017537373 \tabularnewline
-53.7642644095449 \tabularnewline
3.56262992002174 \tabularnewline
-80.9392686297821 \tabularnewline
-8.00343109733228 \tabularnewline
58.2191881580152 \tabularnewline
67.1797815356035 \tabularnewline
48.6458283119251 \tabularnewline
-61.3775158673475 \tabularnewline
73.5580129478972 \tabularnewline
-94.3413359285504 \tabularnewline
\hline
\end{tabular}
%Source: https://freestatistics.org/blog/index.php?pk=300392&T=2

[TABLE]
[ROW][C]Estimated ARIMA Residuals[/C][/ROW]
[ROW][C]Value[/C][/ROW]
[ROW][C]-17.1202333703198[/C][/ROW]
[ROW][C]30.0019704233291[/C][/ROW]
[ROW][C]56.2558563145684[/C][/ROW]
[ROW][C]-3.7622332593829[/C][/ROW]
[ROW][C]71.2542350745551[/C][/ROW]
[ROW][C]18.7381539242348[/C][/ROW]
[ROW][C]-52.5328517229621[/C][/ROW]
[ROW][C]-86.2944166311264[/C][/ROW]
[ROW][C]-18.7801770557677[/C][/ROW]
[ROW][C]-183.825610471364[/C][/ROW]
[ROW][C]22.4738642966653[/C][/ROW]
[ROW][C]-7.53678367831742[/C][/ROW]
[ROW][C]-183.83854402649[/C][/ROW]
[ROW][C]131.346697983325[/C][/ROW]
[ROW][C]2.31192344365213[/C][/ROW]
[ROW][C]-60.2147551356542[/C][/ROW]
[ROW][C]-40.4452401737153[/C][/ROW]
[ROW][C]-15.9199571983014[/C][/ROW]
[ROW][C]-108.936588234684[/C][/ROW]
[ROW][C]-25.2541666867565[/C][/ROW]
[ROW][C]-9.12996822798578[/C][/ROW]
[ROW][C]39.9525791745192[/C][/ROW]
[ROW][C]-47.4694501545365[/C][/ROW]
[ROW][C]167.316034869283[/C][/ROW]
[ROW][C]-64.3134401464689[/C][/ROW]
[ROW][C]-85.8403443351195[/C][/ROW]
[ROW][C]-73.8028784431842[/C][/ROW]
[ROW][C]-154.466894106372[/C][/ROW]
[ROW][C]-63.4001943978131[/C][/ROW]
[ROW][C]-87.120850862339[/C][/ROW]
[ROW][C]-20.397186865769[/C][/ROW]
[ROW][C]-51.2961957353294[/C][/ROW]
[ROW][C]-116.111881842694[/C][/ROW]
[ROW][C]77.7633022322841[/C][/ROW]
[ROW][C]82.4837439448022[/C][/ROW]
[ROW][C]-66.7310701768196[/C][/ROW]
[ROW][C]-41.5311599815186[/C][/ROW]
[ROW][C]75.3994236417825[/C][/ROW]
[ROW][C]60.049903095116[/C][/ROW]
[ROW][C]46.5628277870938[/C][/ROW]
[ROW][C]0.692830761203133[/C][/ROW]
[ROW][C]45.0463984643724[/C][/ROW]
[ROW][C]-22.3187665894085[/C][/ROW]
[ROW][C]125.584462402189[/C][/ROW]
[ROW][C]-9.86102337553796[/C][/ROW]
[ROW][C]88.8319514908064[/C][/ROW]
[ROW][C]1.35142986471447[/C][/ROW]
[ROW][C]-53.5905931544511[/C][/ROW]
[ROW][C]-96.908007609885[/C][/ROW]
[ROW][C]32.9260353620614[/C][/ROW]
[ROW][C]99.9194261769378[/C][/ROW]
[ROW][C]5.07241445528153[/C][/ROW]
[ROW][C]-14.3690912758781[/C][/ROW]
[ROW][C]-8.16866872856524[/C][/ROW]
[ROW][C]-13.8461689538799[/C][/ROW]
[ROW][C]23.3281780227103[/C][/ROW]
[ROW][C]-99.3232905923101[/C][/ROW]
[ROW][C]32.0628440448693[/C][/ROW]
[ROW][C]-52.1338153818624[/C][/ROW]
[ROW][C]-32.1997696953679[/C][/ROW]
[ROW][C]-53.6070396625497[/C][/ROW]
[ROW][C]-7.34848730023512[/C][/ROW]
[ROW][C]35.134301161683[/C][/ROW]
[ROW][C]154.671286064393[/C][/ROW]
[ROW][C]-25.0013591210428[/C][/ROW]
[ROW][C]-40.0147285369775[/C][/ROW]
[ROW][C]-44.8844893681161[/C][/ROW]
[ROW][C]64.6208024532319[/C][/ROW]
[ROW][C]14.1485179161006[/C][/ROW]
[ROW][C]-28.3787153126387[/C][/ROW]
[ROW][C]23.5598094507196[/C][/ROW]
[ROW][C]-149.332142849595[/C][/ROW]
[ROW][C]142.387789901508[/C][/ROW]
[ROW][C]26.4490794289645[/C][/ROW]
[ROW][C]17.1631760292267[/C][/ROW]
[ROW][C]45.5156056765107[/C][/ROW]
[ROW][C]-29.3821233022724[/C][/ROW]
[ROW][C]44.8757076579929[/C][/ROW]
[ROW][C]21.291849479009[/C][/ROW]
[ROW][C]-51.571011868412[/C][/ROW]
[ROW][C]33.9251075681246[/C][/ROW]
[ROW][C]53.2742147109713[/C][/ROW]
[ROW][C]-48.0956177881083[/C][/ROW]
[ROW][C]-81.9103327985164[/C][/ROW]
[ROW][C]-54.8795036753904[/C][/ROW]
[ROW][C]109.588702717304[/C][/ROW]
[ROW][C]-1.30818965594104[/C][/ROW]
[ROW][C]-68.8249026890572[/C][/ROW]
[ROW][C]-43.7279315304283[/C][/ROW]
[ROW][C]63.2956717964796[/C][/ROW]
[ROW][C]-54.3891087114525[/C][/ROW]
[ROW][C]-18.4341847068578[/C][/ROW]
[ROW][C]-7.16807942521077[/C][/ROW]
[ROW][C]5.2150017537373[/C][/ROW]
[ROW][C]-53.7642644095449[/C][/ROW]
[ROW][C]3.56262992002174[/C][/ROW]
[ROW][C]-80.9392686297821[/C][/ROW]
[ROW][C]-8.00343109733228[/C][/ROW]
[ROW][C]58.2191881580152[/C][/ROW]
[ROW][C]67.1797815356035[/C][/ROW]
[ROW][C]48.6458283119251[/C][/ROW]
[ROW][C]-61.3775158673475[/C][/ROW]
[ROW][C]73.5580129478972[/C][/ROW]
[ROW][C]-94.3413359285504[/C][/ROW]
[/TABLE]
Source: https://freestatistics.org/blog/index.php?pk=300392&T=2

Globally Unique Identifier (entire table): ba.freestatistics.org/blog/index.php?pk=300392&T=2

As an alternative you can also use a QR Code:  

The GUIDs for individual cells are displayed in the table below:

Estimated ARIMA Residuals
Value
-17.1202333703198
30.0019704233291
56.2558563145684
-3.7622332593829
71.2542350745551
18.7381539242348
-52.5328517229621
-86.2944166311264
-18.7801770557677
-183.825610471364
22.4738642966653
-7.53678367831742
-183.83854402649
131.346697983325
2.31192344365213
-60.2147551356542
-40.4452401737153
-15.9199571983014
-108.936588234684
-25.2541666867565
-9.12996822798578
39.9525791745192
-47.4694501545365
167.316034869283
-64.3134401464689
-85.8403443351195
-73.8028784431842
-154.466894106372
-63.4001943978131
-87.120850862339
-20.397186865769
-51.2961957353294
-116.111881842694
77.7633022322841
82.4837439448022
-66.7310701768196
-41.5311599815186
75.3994236417825
60.049903095116
46.5628277870938
0.692830761203133
45.0463984643724
-22.3187665894085
125.584462402189
-9.86102337553796
88.8319514908064
1.35142986471447
-53.5905931544511
-96.908007609885
32.9260353620614
99.9194261769378
5.07241445528153
-14.3690912758781
-8.16866872856524
-13.8461689538799
23.3281780227103
-99.3232905923101
32.0628440448693
-52.1338153818624
-32.1997696953679
-53.6070396625497
-7.34848730023512
35.134301161683
154.671286064393
-25.0013591210428
-40.0147285369775
-44.8844893681161
64.6208024532319
14.1485179161006
-28.3787153126387
23.5598094507196
-149.332142849595
142.387789901508
26.4490794289645
17.1631760292267
45.5156056765107
-29.3821233022724
44.8757076579929
21.291849479009
-51.571011868412
33.9251075681246
53.2742147109713
-48.0956177881083
-81.9103327985164
-54.8795036753904
109.588702717304
-1.30818965594104
-68.8249026890572
-43.7279315304283
63.2956717964796
-54.3891087114525
-18.4341847068578
-7.16807942521077
5.2150017537373
-53.7642644095449
3.56262992002174
-80.9392686297821
-8.00343109733228
58.2191881580152
67.1797815356035
48.6458283119251
-61.3775158673475
73.5580129478972
-94.3413359285504


Parameters (Session):
par1 = 1 ; par2 = 12 ; par3 = BFGS ;
Parameters (R input):
par1 = FALSE ; par2 = 1 ; par3 = 1 ; par4 = 1 ; par5 = 12 ; par6 = 3 ; par7 = 1 ; par8 = 2 ; par9 = 1 ;
R code (references can be found in the software module):
library(lattice)
if (par1 == 'TRUE') par1 <- TRUE
if (par1 == 'FALSE') par1 <- FALSE
par2 <- as.numeric(par2) #Box-Cox lambda transformation parameter
par3 <- as.numeric(par3) #degree of non-seasonal differencing
par4 <- as.numeric(par4) #degree of seasonal differencing
par5 <- as.numeric(par5) #seasonal period
par6 <- as.numeric(par6) #degree (p) of the non-seasonal AR(p) polynomial
par7 <- as.numeric(par7) #degree (q) of the non-seasonal MA(q) polynomial
par8 <- as.numeric(par8) #degree (P) of the seasonal AR(P) polynomial
par9 <- as.numeric(par9) #degree (Q) of the seasonal MA(Q) polynomial
armaGR <- function(arima.out, names, n){
try1 <- arima.out$coef
try2 <- sqrt(diag(arima.out$var.coef))
try.data.frame <- data.frame(matrix(NA,ncol=4,nrow=length(names)))
dimnames(try.data.frame) <- list(names,c('coef','std','tstat','pv'))
try.data.frame[,1] <- try1
for(i in 1:length(try2)) try.data.frame[which(rownames(try.data.frame)==names(try2)[i]),2] <- try2[i]
try.data.frame[,3] <- try.data.frame[,1] / try.data.frame[,2]
try.data.frame[,4] <- round((1-pt(abs(try.data.frame[,3]),df=n-(length(try2)+1)))*2,5)
vector <- rep(NA,length(names))
vector[is.na(try.data.frame[,4])] <- 0
maxi <- which.max(try.data.frame[,4])
continue <- max(try.data.frame[,4],na.rm=TRUE) > .05
vector[maxi] <- 0
list(summary=try.data.frame,next.vector=vector,continue=continue)
}
arimaSelect <- function(series, order=c(13,0,0), seasonal=list(order=c(2,0,0),period=12), include.mean=F){
nrc <- order[1]+order[3]+seasonal$order[1]+seasonal$order[3]
coeff <- matrix(NA, nrow=nrc*2, ncol=nrc)
pval <- matrix(NA, nrow=nrc*2, ncol=nrc)
mylist <- rep(list(NULL), nrc)
names <- NULL
if(order[1] > 0) names <- paste('ar',1:order[1],sep='')
if(order[3] > 0) names <- c( names , paste('ma',1:order[3],sep='') )
if(seasonal$order[1] > 0) names <- c(names, paste('sar',1:seasonal$order[1],sep=''))
if(seasonal$order[3] > 0) names <- c(names, paste('sma',1:seasonal$order[3],sep=''))
arima.out <- arima(series, order=order, seasonal=seasonal, include.mean=include.mean, method='ML')
mylist[[1]] <- arima.out
last.arma <- armaGR(arima.out, names, length(series))
mystop <- FALSE
i <- 1
coeff[i,] <- last.arma[[1]][,1]
pval [i,] <- last.arma[[1]][,4]
i <- 2
aic <- arima.out$aic
while(!mystop){
mylist[[i]] <- arima.out
arima.out <- arima(series, order=order, seasonal=seasonal, include.mean=include.mean, method='ML', fixed=last.arma$next.vector)
aic <- c(aic, arima.out$aic)
last.arma <- armaGR(arima.out, names, length(series))
mystop <- !last.arma$continue
coeff[i,] <- last.arma[[1]][,1]
pval [i,] <- last.arma[[1]][,4]
i <- i+1
}
list(coeff, pval, mylist, aic=aic)
}
arimaSelectplot <- function(arimaSelect.out,noms,choix){
noms <- names(arimaSelect.out[[3]][[1]]$coef)
coeff <- arimaSelect.out[[1]]
k <- min(which(is.na(coeff[,1])))-1
coeff <- coeff[1:k,]
pval <- arimaSelect.out[[2]][1:k,]
aic <- arimaSelect.out$aic[1:k]
coeff[coeff==0] <- NA
n <- ncol(coeff)
if(missing(choix)) choix <- k
layout(matrix(c(1,1,1,2,
3,3,3,2,
3,3,3,4,
5,6,7,7),nr=4),
widths=c(10,35,45,15),
heights=c(30,30,15,15))
couleurs <- rainbow(75)[1:50]#(50)
ticks <- pretty(coeff)
par(mar=c(1,1,3,1))
plot(aic,k:1-.5,type='o',pch=21,bg='blue',cex=2,axes=F,lty=2,xpd=NA)
points(aic[choix],k-choix+.5,pch=21,cex=4,bg=2,xpd=NA)
title('aic',line=2)
par(mar=c(3,0,0,0))
plot(0,axes=F,xlab='',ylab='',xlim=range(ticks),ylim=c(.1,1))
rect(xleft = min(ticks) + (0:49)/50*(max(ticks)-min(ticks)),
xright = min(ticks) + (1:50)/50*(max(ticks)-min(ticks)),
ytop = rep(1,50),
ybottom= rep(0,50),col=couleurs,border=NA)
axis(1,ticks)
rect(xleft=min(ticks),xright=max(ticks),ytop=1,ybottom=0)
text(mean(coeff,na.rm=T),.5,'coefficients',cex=2,font=2)
par(mar=c(1,1,3,1))
image(1:n,1:k,t(coeff[k:1,]),axes=F,col=couleurs,zlim=range(ticks))
for(i in 1:n) for(j in 1:k) if(!is.na(coeff[j,i])) {
if(pval[j,i]<.01) symb = 'green'
else if( (pval[j,i]<.05) & (pval[j,i]>=.01)) symb = 'orange'
else if( (pval[j,i]<.1) & (pval[j,i]>=.05)) symb = 'red'
else symb = 'black'
polygon(c(i+.5 ,i+.2 ,i+.5 ,i+.5),
c(k-j+0.5,k-j+0.5,k-j+0.8,k-j+0.5),
col=symb)
if(j==choix) {
rect(xleft=i-.5,
xright=i+.5,
ybottom=k-j+1.5,
ytop=k-j+.5,
lwd=4)
text(i,
k-j+1,
round(coeff[j,i],2),
cex=1.2,
font=2)
}
else{
rect(xleft=i-.5,xright=i+.5,ybottom=k-j+1.5,ytop=k-j+.5)
text(i,k-j+1,round(coeff[j,i],2),cex=1.2,font=1)
}
}
axis(3,1:n,noms)
par(mar=c(0.5,0,0,0.5))
plot(0,axes=F,xlab='',ylab='',type='n',xlim=c(0,8),ylim=c(-.2,.8))
cols <- c('green','orange','red','black')
niv <- c('0','0.01','0.05','0.1')
for(i in 0:3){
polygon(c(1+2*i ,1+2*i ,1+2*i-.5 ,1+2*i),
c(.4 ,.7 , .4 , .4),
col=cols[i+1])
text(2*i,0.5,niv[i+1],cex=1.5)
}
text(8,.5,1,cex=1.5)
text(4,0,'p-value',cex=2)
box()
residus <- arimaSelect.out[[3]][[choix]]$res
par(mar=c(1,2,4,1))
acf(residus,main='')
title('acf',line=.5)
par(mar=c(1,2,4,1))
pacf(residus,main='')
title('pacf',line=.5)
par(mar=c(2,2,4,1))
qqnorm(residus,main='')
title('qq-norm',line=.5)
qqline(residus)
residus
}
if (par2 == 0) x <- log(x)
if (par2 != 0) x <- x^par2
(selection <- arimaSelect(x, order=c(par6,par3,par7), seasonal=list(order=c(par8,par4,par9), period=par5)))
bitmap(file='test1.png')
resid <- arimaSelectplot(selection)
dev.off()
resid
bitmap(file='test2.png')
acf(resid,length(resid)/2, main='Residual Autocorrelation Function')
dev.off()
bitmap(file='test3.png')
pacf(resid,length(resid)/2, main='Residual Partial Autocorrelation Function')
dev.off()
bitmap(file='test4.png')
cpgram(resid, main='Residual Cumulative Periodogram')
dev.off()
bitmap(file='test5.png')
hist(resid, main='Residual Histogram', xlab='values of Residuals')
dev.off()
bitmap(file='test6.png')
densityplot(~resid,col='black',main='Residual Density Plot', xlab='values of Residuals')
dev.off()
bitmap(file='test7.png')
qqnorm(resid, main='Residual Normal Q-Q Plot')
qqline(resid)
dev.off()
ncols <- length(selection[[1]][1,])
nrows <- length(selection[[2]][,1])-1
load(file='createtable')
a<-table.start()
a<-table.row.start(a)
a<-table.element(a,'ARIMA Parameter Estimation and Backward Selection', ncols+1,TRUE)
a<-table.row.end(a)
a<-table.row.start(a)
a<-table.element(a,'Iteration', header=TRUE)
for (i in 1:ncols) {
a<-table.element(a,names(selection[[3]][[1]]$coef)[i],header=TRUE)
}
a<-table.row.end(a)
for (j in 1:nrows) {
a<-table.row.start(a)
mydum <- 'Estimates ('
mydum <- paste(mydum,j)
mydum <- paste(mydum,')')
a<-table.element(a,mydum, header=TRUE)
for (i in 1:ncols) {
a<-table.element(a,round(selection[[1]][j,i],4))
}
a<-table.row.end(a)
a<-table.row.start(a)
a<-table.element(a,'(p-val)', header=TRUE)
for (i in 1:ncols) {
mydum <- '('
mydum <- paste(mydum,round(selection[[2]][j,i],4),sep='')
mydum <- paste(mydum,')')
a<-table.element(a,mydum)
}
a<-table.row.end(a)
}
a<-table.end(a)
table.save(a,file='mytable.tab')
a<-table.start()
a<-table.row.start(a)
a<-table.element(a,'Estimated ARIMA Residuals', 1,TRUE)
a<-table.row.end(a)
a<-table.row.start(a)
a<-table.element(a,'Value', 1,TRUE)
a<-table.row.end(a)
for (i in (par4*par5+par3):length(resid)) {
a<-table.row.start(a)
a<-table.element(a,resid[i])
a<-table.row.end(a)
}
a<-table.end(a)
table.save(a,file='mytable1.tab')