Free Statistics

of Irreproducible Research!

Author's title

Author*The author of this computation has been verified*
R Software Modulerwasp_smp.wasp
Title produced by softwareStandard Deviation-Mean Plot
Date of computationFri, 16 Dec 2016 17:20:52 +0100
Cite this page as followsStatistical Computations at FreeStatistics.org, Office for Research Development and Education, URL https://freestatistics.org/blog/index.php?v=date/2016/Dec/16/t1481905510xdz4chf1si6imxg.htm/, Retrieved Thu, 02 May 2024 21:38:58 +0000
Statistical Computations at FreeStatistics.org, Office for Research Development and Education, URL https://freestatistics.org/blog/index.php?pk=300423, Retrieved Thu, 02 May 2024 21:38:58 +0000
QR Codes:

Original text written by user:
IsPrivate?No (this computation is public)
User-defined keywords
Estimated Impact75
Family? (F = Feedback message, R = changed R code, M = changed R Module, P = changed Parameters, D = changed Data)
-       [Standard Deviation-Mean Plot] [] [2016-12-16 16:20:52] [349958aef20b862f8399a5ba04d6f6e3] [Current]
Feedback Forum

Post a new message
Dataseries X:
6830
6827
6841
6754
6869
6809
6836
6766
6759
6719
6702
6627
6630
6606
6512
6550
6578
6499
6371
6332
6291
6307
6252
6250
6164
6213
6174
6154
6091
6096
6046
6001
5979
5921
5863
5818
5758
5786
5734
5678
5610
5578
5589
5553
5533
5521
5464
5419
5346
5296
5255
5235
5164
5164
5172
5093
5070
5108
5051
5021
5001
4918
4886


Summary of computational transaction
Raw Input view raw input (R code)
Raw Outputview raw output of R engine
Computing time1 seconds
R ServerBig Analytics Cloud Computing Center

\begin{tabular}{lllllllll}
\hline
Summary of computational transaction \tabularnewline
Raw Input view raw input (R code)  \tabularnewline
Raw Outputview raw output of R engine  \tabularnewline
Computing time1 seconds \tabularnewline
R ServerBig Analytics Cloud Computing Center \tabularnewline
\hline
\end{tabular}
%Source: https://freestatistics.org/blog/index.php?pk=300423&T=0

[TABLE]
[ROW]
Summary of computational transaction[/C][/ROW] [ROW]Raw Input[/C] view raw input (R code) [/C][/ROW] [ROW]Raw Output[/C]view raw output of R engine [/C][/ROW] [ROW]Computing time[/C]1 seconds[/C][/ROW] [ROW]R Server[/C]Big Analytics Cloud Computing Center[/C][/ROW] [/TABLE] Source: https://freestatistics.org/blog/index.php?pk=300423&T=0

Globally Unique Identifier (entire table): ba.freestatistics.org/blog/index.php?pk=300423&T=0

As an alternative you can also use a QR Code:  

The GUIDs for individual cells are displayed in the table below:

Summary of computational transaction
Raw Input view raw input (R code)
Raw Outputview raw output of R engine
Computing time1 seconds
R ServerBig Analytics Cloud Computing Center


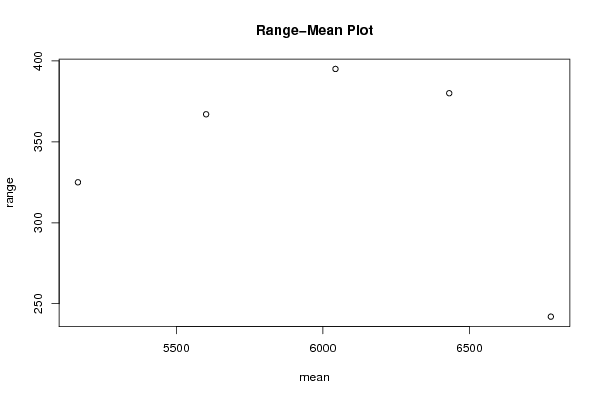
Standard Deviation-Mean Plot
SectionMeanStandard DeviationRange
16778.2570.5937481136062242
26431.5144.7119395715380
36043.33333333333128.598270406391395
45601.91666666667116.172644513815367
55164.58333333333101.873770674866325

\begin{tabular}{lllllllll}
\hline
Standard Deviation-Mean Plot \tabularnewline
Section & Mean & Standard Deviation & Range \tabularnewline
1 & 6778.25 & 70.5937481136062 & 242 \tabularnewline
2 & 6431.5 & 144.7119395715 & 380 \tabularnewline
3 & 6043.33333333333 & 128.598270406391 & 395 \tabularnewline
4 & 5601.91666666667 & 116.172644513815 & 367 \tabularnewline
5 & 5164.58333333333 & 101.873770674866 & 325 \tabularnewline
\hline
\end{tabular}
%Source: https://freestatistics.org/blog/index.php?pk=300423&T=1

[TABLE]
[ROW][C]Standard Deviation-Mean Plot[/C][/ROW]
[ROW][C]Section[/C][C]Mean[/C][C]Standard Deviation[/C][C]Range[/C][/ROW]
[ROW][C]1[/C][C]6778.25[/C][C]70.5937481136062[/C][C]242[/C][/ROW]
[ROW][C]2[/C][C]6431.5[/C][C]144.7119395715[/C][C]380[/C][/ROW]
[ROW][C]3[/C][C]6043.33333333333[/C][C]128.598270406391[/C][C]395[/C][/ROW]
[ROW][C]4[/C][C]5601.91666666667[/C][C]116.172644513815[/C][C]367[/C][/ROW]
[ROW][C]5[/C][C]5164.58333333333[/C][C]101.873770674866[/C][C]325[/C][/ROW]
[/TABLE]
Source: https://freestatistics.org/blog/index.php?pk=300423&T=1

Globally Unique Identifier (entire table): ba.freestatistics.org/blog/index.php?pk=300423&T=1

As an alternative you can also use a QR Code:  

The GUIDs for individual cells are displayed in the table below:

Standard Deviation-Mean Plot
SectionMeanStandard DeviationRange
16778.2570.5937481136062242
26431.5144.7119395715380
36043.33333333333128.598270406391395
45601.91666666667116.172644513815367
55164.58333333333101.873770674866325


Regression: S.E.(k) = alpha + beta * Mean(k)
alpha150.955825124983
beta-0.00642343200448835
S.D.0.0250698052717275
T-STAT-0.256221854731851
p-value0.814344772853236

\begin{tabular}{lllllllll}
\hline
Regression: S.E.(k) = alpha + beta * Mean(k) \tabularnewline
alpha & 150.955825124983 \tabularnewline
beta & -0.00642343200448835 \tabularnewline
S.D. & 0.0250698052717275 \tabularnewline
T-STAT & -0.256221854731851 \tabularnewline
p-value & 0.814344772853236 \tabularnewline
\hline
\end{tabular}
%Source: https://freestatistics.org/blog/index.php?pk=300423&T=2

[TABLE]
[ROW][C]Regression: S.E.(k) = alpha + beta * Mean(k)[/C][/ROW]
[ROW][C]alpha[/C][C]150.955825124983[/C][/ROW]
[ROW][C]beta[/C][C]-0.00642343200448835[/C][/ROW]
[ROW][C]S.D.[/C][C]0.0250698052717275[/C][/ROW]
[ROW][C]T-STAT[/C][C]-0.256221854731851[/C][/ROW]
[ROW][C]p-value[/C][C]0.814344772853236[/C][/ROW]
[/TABLE]
Source: https://freestatistics.org/blog/index.php?pk=300423&T=2

Globally Unique Identifier (entire table): ba.freestatistics.org/blog/index.php?pk=300423&T=2

As an alternative you can also use a QR Code:  

The GUIDs for individual cells are displayed in the table below:

Regression: S.E.(k) = alpha + beta * Mean(k)
alpha150.955825124983
beta-0.00642343200448835
S.D.0.0250698052717275
T-STAT-0.256221854731851
p-value0.814344772853236


Regression: ln S.E.(k) = alpha + beta * ln Mean(k)
alpha9.57430198008897
beta-0.561307945552351
S.D.1.43675042710902
T-STAT-0.390678808901972
p-value0.722125391594722
Lambda1.56130794555235

\begin{tabular}{lllllllll}
\hline
Regression: ln S.E.(k) = alpha + beta * ln Mean(k) \tabularnewline
alpha & 9.57430198008897 \tabularnewline
beta & -0.561307945552351 \tabularnewline
S.D. & 1.43675042710902 \tabularnewline
T-STAT & -0.390678808901972 \tabularnewline
p-value & 0.722125391594722 \tabularnewline
Lambda & 1.56130794555235 \tabularnewline
\hline
\end{tabular}
%Source: https://freestatistics.org/blog/index.php?pk=300423&T=3

[TABLE]
[ROW][C]Regression: ln S.E.(k) = alpha + beta * ln Mean(k)[/C][/ROW]
[ROW][C]alpha[/C][C]9.57430198008897[/C][/ROW]
[ROW][C]beta[/C][C]-0.561307945552351[/C][/ROW]
[ROW][C]S.D.[/C][C]1.43675042710902[/C][/ROW]
[ROW][C]T-STAT[/C][C]-0.390678808901972[/C][/ROW]
[ROW][C]p-value[/C][C]0.722125391594722[/C][/ROW]
[ROW][C]Lambda[/C][C]1.56130794555235[/C][/ROW]
[/TABLE]
Source: https://freestatistics.org/blog/index.php?pk=300423&T=3

Globally Unique Identifier (entire table): ba.freestatistics.org/blog/index.php?pk=300423&T=3

As an alternative you can also use a QR Code:  

The GUIDs for individual cells are displayed in the table below:

Regression: ln S.E.(k) = alpha + beta * ln Mean(k)
alpha9.57430198008897
beta-0.561307945552351
S.D.1.43675042710902
T-STAT-0.390678808901972
p-value0.722125391594722
Lambda1.56130794555235


Parameters (Session):
par1 = 12 ;
Parameters (R input):
par1 = 12 ;
R code (references can be found in the software module):
par1 <- as.numeric(par1)
(n <- length(x))
(np <- floor(n / par1))
arr <- array(NA,dim=c(par1,np))
j <- 0
k <- 1
for (i in 1:(np*par1))
{
j = j + 1
arr[j,k] <- x[i]
if (j == par1) {
j = 0
k=k+1
}
}
arr
arr.mean <- array(NA,dim=np)
arr.sd <- array(NA,dim=np)
arr.range <- array(NA,dim=np)
for (j in 1:np)
{
arr.mean[j] <- mean(arr[,j],na.rm=TRUE)
arr.sd[j] <- sd(arr[,j],na.rm=TRUE)
arr.range[j] <- max(arr[,j],na.rm=TRUE) - min(arr[,j],na.rm=TRUE)
}
arr.mean
arr.sd
arr.range
(lm1 <- lm(arr.sd~arr.mean))
(lnlm1 <- lm(log(arr.sd)~log(arr.mean)))
(lm2 <- lm(arr.range~arr.mean))
bitmap(file='test1.png')
plot(arr.mean,arr.sd,main='Standard Deviation-Mean Plot',xlab='mean',ylab='standard deviation')
dev.off()
bitmap(file='test2.png')
plot(arr.mean,arr.range,main='Range-Mean Plot',xlab='mean',ylab='range')
dev.off()
load(file='createtable')
a<-table.start()
a<-table.row.start(a)
a<-table.element(a,'Standard Deviation-Mean Plot',4,TRUE)
a<-table.row.end(a)
a<-table.row.start(a)
a<-table.element(a,'Section',header=TRUE)
a<-table.element(a,'Mean',header=TRUE)
a<-table.element(a,'Standard Deviation',header=TRUE)
a<-table.element(a,'Range',header=TRUE)
a<-table.row.end(a)
for (j in 1:np) {
a<-table.row.start(a)
a<-table.element(a,j,header=TRUE)
a<-table.element(a,arr.mean[j])
a<-table.element(a,arr.sd[j] )
a<-table.element(a,arr.range[j] )
a<-table.row.end(a)
}
a<-table.end(a)
table.save(a,file='mytable.tab')
a<-table.start()
a<-table.row.start(a)
a<-table.element(a,'Regression: S.E.(k) = alpha + beta * Mean(k)',2,TRUE)
a<-table.row.end(a)
a<-table.row.start(a)
a<-table.element(a,'alpha',header=TRUE)
a<-table.element(a,lm1$coefficients[[1]])
a<-table.row.end(a)
a<-table.row.start(a)
a<-table.element(a,'beta',header=TRUE)
a<-table.element(a,lm1$coefficients[[2]])
a<-table.row.end(a)
a<-table.row.start(a)
a<-table.element(a,'S.D.',header=TRUE)
a<-table.element(a,summary(lm1)$coefficients[2,2])
a<-table.row.end(a)
a<-table.row.start(a)
a<-table.element(a,'T-STAT',header=TRUE)
a<-table.element(a,summary(lm1)$coefficients[2,3])
a<-table.row.end(a)
a<-table.row.start(a)
a<-table.element(a,'p-value',header=TRUE)
a<-table.element(a,summary(lm1)$coefficients[2,4])
a<-table.row.end(a)
a<-table.end(a)
table.save(a,file='mytable1.tab')
a<-table.start()
a<-table.row.start(a)
a<-table.element(a,'Regression: ln S.E.(k) = alpha + beta * ln Mean(k)',2,TRUE)
a<-table.row.end(a)
a<-table.row.start(a)
a<-table.element(a,'alpha',header=TRUE)
a<-table.element(a,lnlm1$coefficients[[1]])
a<-table.row.end(a)
a<-table.row.start(a)
a<-table.element(a,'beta',header=TRUE)
a<-table.element(a,lnlm1$coefficients[[2]])
a<-table.row.end(a)
a<-table.row.start(a)
a<-table.element(a,'S.D.',header=TRUE)
a<-table.element(a,summary(lnlm1)$coefficients[2,2])
a<-table.row.end(a)
a<-table.row.start(a)
a<-table.element(a,'T-STAT',header=TRUE)
a<-table.element(a,summary(lnlm1)$coefficients[2,3])
a<-table.row.end(a)
a<-table.row.start(a)
a<-table.element(a,'p-value',header=TRUE)
a<-table.element(a,summary(lnlm1)$coefficients[2,4])
a<-table.row.end(a)
a<-table.row.start(a)
a<-table.element(a,'Lambda',header=TRUE)
a<-table.element(a,1-lnlm1$coefficients[[2]])
a<-table.row.end(a)
a<-table.end(a)
table.save(a,file='mytable2.tab')