Free Statistics

of Irreproducible Research!

Author's title

Author*The author of this computation has been verified*
R Software Modulerwasp_autocorrelation.wasp
Title produced by software(Partial) Autocorrelation Function
Date of computationFri, 16 Dec 2016 17:39:43 +0100
Cite this page as followsStatistical Computations at FreeStatistics.org, Office for Research Development and Education, URL https://freestatistics.org/blog/index.php?v=date/2016/Dec/16/t14819064644hrjr4w4utjcjwb.htm/, Retrieved Thu, 02 May 2024 19:56:32 +0000
Statistical Computations at FreeStatistics.org, Office for Research Development and Education, URL https://freestatistics.org/blog/index.php?pk=300437, Retrieved Thu, 02 May 2024 19:56:32 +0000
QR Codes:

Original text written by user:
IsPrivate?No (this computation is public)
User-defined keywords
Estimated Impact74
Family? (F = Feedback message, R = changed R code, M = changed R Module, P = changed Parameters, D = changed Data)
-     [ARIMA Backward Selection] [] [2016-12-16 13:36:55] [683f400e1b95307fc738e729f07c4fce]
-    D  [ARIMA Backward Selection] [] [2016-12-16 14:17:56] [683f400e1b95307fc738e729f07c4fce]
- R  D    [ARIMA Backward Selection] [] [2016-12-16 14:51:40] [683f400e1b95307fc738e729f07c4fce]
- RM D        [(Partial) Autocorrelation Function] [] [2016-12-16 16:39:43] [404ac5ee4f7301873f6a96ef36861981] [Current]
Feedback Forum

Post a new message
Dataseries X:
5190
4805
4935
3675
3805
5260
6735
5435
3090
4750
3110
3135
4985
3665
3535
4195
3960
3150
3330
4265
4240
4255
3685
3525
4000
3050
3800
3035
3095
2820
2760
4435
3665
4140
2890
3295
2660
2950
2770
3365
3090
3275
3370
2685
2760
3030
2410
2570
2675
3100
3025


Summary of computational transaction
Raw Input view raw input (R code)
Raw Outputview raw output of R engine
Computing time1 seconds
R ServerBig Analytics Cloud Computing Center

\begin{tabular}{lllllllll}
\hline
Summary of computational transaction \tabularnewline
Raw Input view raw input (R code)  \tabularnewline
Raw Outputview raw output of R engine  \tabularnewline
Computing time1 seconds \tabularnewline
R ServerBig Analytics Cloud Computing Center \tabularnewline
\hline
\end{tabular}
%Source: https://freestatistics.org/blog/index.php?pk=300437&T=0

[TABLE]
[ROW]
Summary of computational transaction[/C][/ROW] [ROW]Raw Input[/C] view raw input (R code) [/C][/ROW] [ROW]Raw Output[/C]view raw output of R engine [/C][/ROW] [ROW]Computing time[/C]1 seconds[/C][/ROW] [ROW]R Server[/C]Big Analytics Cloud Computing Center[/C][/ROW] [/TABLE] Source: https://freestatistics.org/blog/index.php?pk=300437&T=0

Globally Unique Identifier (entire table): ba.freestatistics.org/blog/index.php?pk=300437&T=0

As an alternative you can also use a QR Code:  

The GUIDs for individual cells are displayed in the table below:

Summary of computational transaction
Raw Input view raw input (R code)
Raw Outputview raw output of R engine
Computing time1 seconds
R ServerBig Analytics Cloud Computing Center


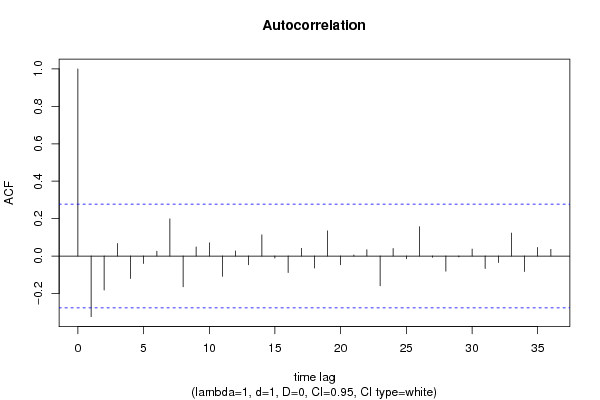
Autocorrelation Function
Time lag kACF(k)T-STATP-value
1-0.324095-2.29170.013085
2-0.181776-1.28530.102296
30.0666430.47120.319761
4-0.120246-0.85030.199614
5-0.039906-0.28220.389487
60.0256550.18140.428391
70.1987261.40520.083071
8-0.164575-1.16370.12503
90.0483430.34180.366954
100.0703880.49770.310432
11-0.108171-0.76490.223968
120.0265640.18780.425884
13-0.046335-0.32760.372277
140.1130890.79970.213846
15-0.010237-0.07240.471291
16-0.087925-0.62170.268475
170.0410230.29010.38648
18-0.064475-0.45590.325215
190.1342750.94950.173475
20-0.046862-0.33140.370878
210.0056030.03960.484278
220.0331390.23430.407844
23-0.158678-1.1220.133606
240.0399270.28230.38943
25-0.014989-0.1060.458007
260.1561671.10430.137382
27-0.006511-0.0460.481731
28-0.080652-0.57030.285515
29-0.004646-0.03280.486963
300.0367740.260.397954
31-0.067174-0.4750.31843
32-0.035082-0.24810.402549
330.1225230.86640.195213
34-0.082529-0.58360.281066
350.0453320.32050.374944
360.035670.25220.400949

\begin{tabular}{lllllllll}
\hline
Autocorrelation Function \tabularnewline
Time lag k & ACF(k) & T-STAT & P-value \tabularnewline
1 & -0.324095 & -2.2917 & 0.013085 \tabularnewline
2 & -0.181776 & -1.2853 & 0.102296 \tabularnewline
3 & 0.066643 & 0.4712 & 0.319761 \tabularnewline
4 & -0.120246 & -0.8503 & 0.199614 \tabularnewline
5 & -0.039906 & -0.2822 & 0.389487 \tabularnewline
6 & 0.025655 & 0.1814 & 0.428391 \tabularnewline
7 & 0.198726 & 1.4052 & 0.083071 \tabularnewline
8 & -0.164575 & -1.1637 & 0.12503 \tabularnewline
9 & 0.048343 & 0.3418 & 0.366954 \tabularnewline
10 & 0.070388 & 0.4977 & 0.310432 \tabularnewline
11 & -0.108171 & -0.7649 & 0.223968 \tabularnewline
12 & 0.026564 & 0.1878 & 0.425884 \tabularnewline
13 & -0.046335 & -0.3276 & 0.372277 \tabularnewline
14 & 0.113089 & 0.7997 & 0.213846 \tabularnewline
15 & -0.010237 & -0.0724 & 0.471291 \tabularnewline
16 & -0.087925 & -0.6217 & 0.268475 \tabularnewline
17 & 0.041023 & 0.2901 & 0.38648 \tabularnewline
18 & -0.064475 & -0.4559 & 0.325215 \tabularnewline
19 & 0.134275 & 0.9495 & 0.173475 \tabularnewline
20 & -0.046862 & -0.3314 & 0.370878 \tabularnewline
21 & 0.005603 & 0.0396 & 0.484278 \tabularnewline
22 & 0.033139 & 0.2343 & 0.407844 \tabularnewline
23 & -0.158678 & -1.122 & 0.133606 \tabularnewline
24 & 0.039927 & 0.2823 & 0.38943 \tabularnewline
25 & -0.014989 & -0.106 & 0.458007 \tabularnewline
26 & 0.156167 & 1.1043 & 0.137382 \tabularnewline
27 & -0.006511 & -0.046 & 0.481731 \tabularnewline
28 & -0.080652 & -0.5703 & 0.285515 \tabularnewline
29 & -0.004646 & -0.0328 & 0.486963 \tabularnewline
30 & 0.036774 & 0.26 & 0.397954 \tabularnewline
31 & -0.067174 & -0.475 & 0.31843 \tabularnewline
32 & -0.035082 & -0.2481 & 0.402549 \tabularnewline
33 & 0.122523 & 0.8664 & 0.195213 \tabularnewline
34 & -0.082529 & -0.5836 & 0.281066 \tabularnewline
35 & 0.045332 & 0.3205 & 0.374944 \tabularnewline
36 & 0.03567 & 0.2522 & 0.400949 \tabularnewline
\hline
\end{tabular}
%Source: https://freestatistics.org/blog/index.php?pk=300437&T=1

[TABLE]
[ROW][C]Autocorrelation Function[/C][/ROW]
[ROW][C]Time lag k[/C][C]ACF(k)[/C][C]T-STAT[/C][C]P-value[/C][/ROW]
[ROW][C]1[/C][C]-0.324095[/C][C]-2.2917[/C][C]0.013085[/C][/ROW]
[ROW][C]2[/C][C]-0.181776[/C][C]-1.2853[/C][C]0.102296[/C][/ROW]
[ROW][C]3[/C][C]0.066643[/C][C]0.4712[/C][C]0.319761[/C][/ROW]
[ROW][C]4[/C][C]-0.120246[/C][C]-0.8503[/C][C]0.199614[/C][/ROW]
[ROW][C]5[/C][C]-0.039906[/C][C]-0.2822[/C][C]0.389487[/C][/ROW]
[ROW][C]6[/C][C]0.025655[/C][C]0.1814[/C][C]0.428391[/C][/ROW]
[ROW][C]7[/C][C]0.198726[/C][C]1.4052[/C][C]0.083071[/C][/ROW]
[ROW][C]8[/C][C]-0.164575[/C][C]-1.1637[/C][C]0.12503[/C][/ROW]
[ROW][C]9[/C][C]0.048343[/C][C]0.3418[/C][C]0.366954[/C][/ROW]
[ROW][C]10[/C][C]0.070388[/C][C]0.4977[/C][C]0.310432[/C][/ROW]
[ROW][C]11[/C][C]-0.108171[/C][C]-0.7649[/C][C]0.223968[/C][/ROW]
[ROW][C]12[/C][C]0.026564[/C][C]0.1878[/C][C]0.425884[/C][/ROW]
[ROW][C]13[/C][C]-0.046335[/C][C]-0.3276[/C][C]0.372277[/C][/ROW]
[ROW][C]14[/C][C]0.113089[/C][C]0.7997[/C][C]0.213846[/C][/ROW]
[ROW][C]15[/C][C]-0.010237[/C][C]-0.0724[/C][C]0.471291[/C][/ROW]
[ROW][C]16[/C][C]-0.087925[/C][C]-0.6217[/C][C]0.268475[/C][/ROW]
[ROW][C]17[/C][C]0.041023[/C][C]0.2901[/C][C]0.38648[/C][/ROW]
[ROW][C]18[/C][C]-0.064475[/C][C]-0.4559[/C][C]0.325215[/C][/ROW]
[ROW][C]19[/C][C]0.134275[/C][C]0.9495[/C][C]0.173475[/C][/ROW]
[ROW][C]20[/C][C]-0.046862[/C][C]-0.3314[/C][C]0.370878[/C][/ROW]
[ROW][C]21[/C][C]0.005603[/C][C]0.0396[/C][C]0.484278[/C][/ROW]
[ROW][C]22[/C][C]0.033139[/C][C]0.2343[/C][C]0.407844[/C][/ROW]
[ROW][C]23[/C][C]-0.158678[/C][C]-1.122[/C][C]0.133606[/C][/ROW]
[ROW][C]24[/C][C]0.039927[/C][C]0.2823[/C][C]0.38943[/C][/ROW]
[ROW][C]25[/C][C]-0.014989[/C][C]-0.106[/C][C]0.458007[/C][/ROW]
[ROW][C]26[/C][C]0.156167[/C][C]1.1043[/C][C]0.137382[/C][/ROW]
[ROW][C]27[/C][C]-0.006511[/C][C]-0.046[/C][C]0.481731[/C][/ROW]
[ROW][C]28[/C][C]-0.080652[/C][C]-0.5703[/C][C]0.285515[/C][/ROW]
[ROW][C]29[/C][C]-0.004646[/C][C]-0.0328[/C][C]0.486963[/C][/ROW]
[ROW][C]30[/C][C]0.036774[/C][C]0.26[/C][C]0.397954[/C][/ROW]
[ROW][C]31[/C][C]-0.067174[/C][C]-0.475[/C][C]0.31843[/C][/ROW]
[ROW][C]32[/C][C]-0.035082[/C][C]-0.2481[/C][C]0.402549[/C][/ROW]
[ROW][C]33[/C][C]0.122523[/C][C]0.8664[/C][C]0.195213[/C][/ROW]
[ROW][C]34[/C][C]-0.082529[/C][C]-0.5836[/C][C]0.281066[/C][/ROW]
[ROW][C]35[/C][C]0.045332[/C][C]0.3205[/C][C]0.374944[/C][/ROW]
[ROW][C]36[/C][C]0.03567[/C][C]0.2522[/C][C]0.400949[/C][/ROW]
[/TABLE]
Source: https://freestatistics.org/blog/index.php?pk=300437&T=1

Globally Unique Identifier (entire table): ba.freestatistics.org/blog/index.php?pk=300437&T=1

As an alternative you can also use a QR Code:  

The GUIDs for individual cells are displayed in the table below:

Autocorrelation Function
Time lag kACF(k)T-STATP-value
1-0.324095-2.29170.013085
2-0.181776-1.28530.102296
30.0666430.47120.319761
4-0.120246-0.85030.199614
5-0.039906-0.28220.389487
60.0256550.18140.428391
70.1987261.40520.083071
8-0.164575-1.16370.12503
90.0483430.34180.366954
100.0703880.49770.310432
11-0.108171-0.76490.223968
120.0265640.18780.425884
13-0.046335-0.32760.372277
140.1130890.79970.213846
15-0.010237-0.07240.471291
16-0.087925-0.62170.268475
170.0410230.29010.38648
18-0.064475-0.45590.325215
190.1342750.94950.173475
20-0.046862-0.33140.370878
210.0056030.03960.484278
220.0331390.23430.407844
23-0.158678-1.1220.133606
240.0399270.28230.38943
25-0.014989-0.1060.458007
260.1561671.10430.137382
27-0.006511-0.0460.481731
28-0.080652-0.57030.285515
29-0.004646-0.03280.486963
300.0367740.260.397954
31-0.067174-0.4750.31843
32-0.035082-0.24810.402549
330.1225230.86640.195213
34-0.082529-0.58360.281066
350.0453320.32050.374944
360.035670.25220.400949


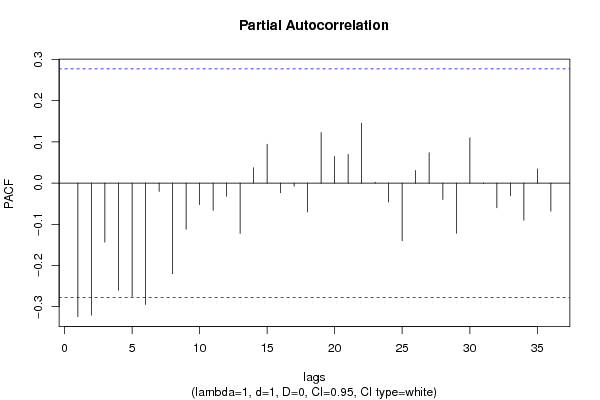
Partial Autocorrelation Function
Time lag kPACF(k)T-STATP-value
1-0.324095-2.29170.013085
2-0.320475-2.26610.013903
3-0.143222-1.01270.158031
4-0.259964-1.83820.035987
5-0.275405-1.94740.028556
6-0.294748-2.08420.021137
7-0.020024-0.14160.443987
8-0.219698-1.55350.063306
9-0.112052-0.79230.215956
10-0.052105-0.36840.35705
11-0.065952-0.46640.321494
12-0.031781-0.22470.411554
13-0.122063-0.86310.196098
140.0372180.26320.396749
150.0942160.66620.25417
16-0.023348-0.16510.434767
17-0.007744-0.05480.478276
18-0.069922-0.49440.311585
190.122790.86830.194701
200.0646420.45710.324794
210.0693820.49060.312926
220.1454861.02870.154275
230.0019720.01390.494465
24-0.045596-0.32240.374242
25-0.139953-0.98960.163563
260.0308880.21840.413999
270.0739060.52260.301783
28-0.039747-0.28110.389915
29-0.121639-0.86010.196915
300.1101080.77860.219947
31-0.000991-0.0070.497219
32-0.059635-0.42170.337533
33-0.030486-0.21560.4151
34-0.090249-0.63820.263143
350.034370.2430.404487
36-0.067988-0.48070.316397

\begin{tabular}{lllllllll}
\hline
Partial Autocorrelation Function \tabularnewline
Time lag k & PACF(k) & T-STAT & P-value \tabularnewline
1 & -0.324095 & -2.2917 & 0.013085 \tabularnewline
2 & -0.320475 & -2.2661 & 0.013903 \tabularnewline
3 & -0.143222 & -1.0127 & 0.158031 \tabularnewline
4 & -0.259964 & -1.8382 & 0.035987 \tabularnewline
5 & -0.275405 & -1.9474 & 0.028556 \tabularnewline
6 & -0.294748 & -2.0842 & 0.021137 \tabularnewline
7 & -0.020024 & -0.1416 & 0.443987 \tabularnewline
8 & -0.219698 & -1.5535 & 0.063306 \tabularnewline
9 & -0.112052 & -0.7923 & 0.215956 \tabularnewline
10 & -0.052105 & -0.3684 & 0.35705 \tabularnewline
11 & -0.065952 & -0.4664 & 0.321494 \tabularnewline
12 & -0.031781 & -0.2247 & 0.411554 \tabularnewline
13 & -0.122063 & -0.8631 & 0.196098 \tabularnewline
14 & 0.037218 & 0.2632 & 0.396749 \tabularnewline
15 & 0.094216 & 0.6662 & 0.25417 \tabularnewline
16 & -0.023348 & -0.1651 & 0.434767 \tabularnewline
17 & -0.007744 & -0.0548 & 0.478276 \tabularnewline
18 & -0.069922 & -0.4944 & 0.311585 \tabularnewline
19 & 0.12279 & 0.8683 & 0.194701 \tabularnewline
20 & 0.064642 & 0.4571 & 0.324794 \tabularnewline
21 & 0.069382 & 0.4906 & 0.312926 \tabularnewline
22 & 0.145486 & 1.0287 & 0.154275 \tabularnewline
23 & 0.001972 & 0.0139 & 0.494465 \tabularnewline
24 & -0.045596 & -0.3224 & 0.374242 \tabularnewline
25 & -0.139953 & -0.9896 & 0.163563 \tabularnewline
26 & 0.030888 & 0.2184 & 0.413999 \tabularnewline
27 & 0.073906 & 0.5226 & 0.301783 \tabularnewline
28 & -0.039747 & -0.2811 & 0.389915 \tabularnewline
29 & -0.121639 & -0.8601 & 0.196915 \tabularnewline
30 & 0.110108 & 0.7786 & 0.219947 \tabularnewline
31 & -0.000991 & -0.007 & 0.497219 \tabularnewline
32 & -0.059635 & -0.4217 & 0.337533 \tabularnewline
33 & -0.030486 & -0.2156 & 0.4151 \tabularnewline
34 & -0.090249 & -0.6382 & 0.263143 \tabularnewline
35 & 0.03437 & 0.243 & 0.404487 \tabularnewline
36 & -0.067988 & -0.4807 & 0.316397 \tabularnewline
\hline
\end{tabular}
%Source: https://freestatistics.org/blog/index.php?pk=300437&T=2

[TABLE]
[ROW][C]Partial Autocorrelation Function[/C][/ROW]
[ROW][C]Time lag k[/C][C]PACF(k)[/C][C]T-STAT[/C][C]P-value[/C][/ROW]
[ROW][C]1[/C][C]-0.324095[/C][C]-2.2917[/C][C]0.013085[/C][/ROW]
[ROW][C]2[/C][C]-0.320475[/C][C]-2.2661[/C][C]0.013903[/C][/ROW]
[ROW][C]3[/C][C]-0.143222[/C][C]-1.0127[/C][C]0.158031[/C][/ROW]
[ROW][C]4[/C][C]-0.259964[/C][C]-1.8382[/C][C]0.035987[/C][/ROW]
[ROW][C]5[/C][C]-0.275405[/C][C]-1.9474[/C][C]0.028556[/C][/ROW]
[ROW][C]6[/C][C]-0.294748[/C][C]-2.0842[/C][C]0.021137[/C][/ROW]
[ROW][C]7[/C][C]-0.020024[/C][C]-0.1416[/C][C]0.443987[/C][/ROW]
[ROW][C]8[/C][C]-0.219698[/C][C]-1.5535[/C][C]0.063306[/C][/ROW]
[ROW][C]9[/C][C]-0.112052[/C][C]-0.7923[/C][C]0.215956[/C][/ROW]
[ROW][C]10[/C][C]-0.052105[/C][C]-0.3684[/C][C]0.35705[/C][/ROW]
[ROW][C]11[/C][C]-0.065952[/C][C]-0.4664[/C][C]0.321494[/C][/ROW]
[ROW][C]12[/C][C]-0.031781[/C][C]-0.2247[/C][C]0.411554[/C][/ROW]
[ROW][C]13[/C][C]-0.122063[/C][C]-0.8631[/C][C]0.196098[/C][/ROW]
[ROW][C]14[/C][C]0.037218[/C][C]0.2632[/C][C]0.396749[/C][/ROW]
[ROW][C]15[/C][C]0.094216[/C][C]0.6662[/C][C]0.25417[/C][/ROW]
[ROW][C]16[/C][C]-0.023348[/C][C]-0.1651[/C][C]0.434767[/C][/ROW]
[ROW][C]17[/C][C]-0.007744[/C][C]-0.0548[/C][C]0.478276[/C][/ROW]
[ROW][C]18[/C][C]-0.069922[/C][C]-0.4944[/C][C]0.311585[/C][/ROW]
[ROW][C]19[/C][C]0.12279[/C][C]0.8683[/C][C]0.194701[/C][/ROW]
[ROW][C]20[/C][C]0.064642[/C][C]0.4571[/C][C]0.324794[/C][/ROW]
[ROW][C]21[/C][C]0.069382[/C][C]0.4906[/C][C]0.312926[/C][/ROW]
[ROW][C]22[/C][C]0.145486[/C][C]1.0287[/C][C]0.154275[/C][/ROW]
[ROW][C]23[/C][C]0.001972[/C][C]0.0139[/C][C]0.494465[/C][/ROW]
[ROW][C]24[/C][C]-0.045596[/C][C]-0.3224[/C][C]0.374242[/C][/ROW]
[ROW][C]25[/C][C]-0.139953[/C][C]-0.9896[/C][C]0.163563[/C][/ROW]
[ROW][C]26[/C][C]0.030888[/C][C]0.2184[/C][C]0.413999[/C][/ROW]
[ROW][C]27[/C][C]0.073906[/C][C]0.5226[/C][C]0.301783[/C][/ROW]
[ROW][C]28[/C][C]-0.039747[/C][C]-0.2811[/C][C]0.389915[/C][/ROW]
[ROW][C]29[/C][C]-0.121639[/C][C]-0.8601[/C][C]0.196915[/C][/ROW]
[ROW][C]30[/C][C]0.110108[/C][C]0.7786[/C][C]0.219947[/C][/ROW]
[ROW][C]31[/C][C]-0.000991[/C][C]-0.007[/C][C]0.497219[/C][/ROW]
[ROW][C]32[/C][C]-0.059635[/C][C]-0.4217[/C][C]0.337533[/C][/ROW]
[ROW][C]33[/C][C]-0.030486[/C][C]-0.2156[/C][C]0.4151[/C][/ROW]
[ROW][C]34[/C][C]-0.090249[/C][C]-0.6382[/C][C]0.263143[/C][/ROW]
[ROW][C]35[/C][C]0.03437[/C][C]0.243[/C][C]0.404487[/C][/ROW]
[ROW][C]36[/C][C]-0.067988[/C][C]-0.4807[/C][C]0.316397[/C][/ROW]
[/TABLE]
Source: https://freestatistics.org/blog/index.php?pk=300437&T=2

Globally Unique Identifier (entire table): ba.freestatistics.org/blog/index.php?pk=300437&T=2

As an alternative you can also use a QR Code:  

The GUIDs for individual cells are displayed in the table below:

Partial Autocorrelation Function
Time lag kPACF(k)T-STATP-value
1-0.324095-2.29170.013085
2-0.320475-2.26610.013903
3-0.143222-1.01270.158031
4-0.259964-1.83820.035987
5-0.275405-1.94740.028556
6-0.294748-2.08420.021137
7-0.020024-0.14160.443987
8-0.219698-1.55350.063306
9-0.112052-0.79230.215956
10-0.052105-0.36840.35705
11-0.065952-0.46640.321494
12-0.031781-0.22470.411554
13-0.122063-0.86310.196098
140.0372180.26320.396749
150.0942160.66620.25417
16-0.023348-0.16510.434767
17-0.007744-0.05480.478276
18-0.069922-0.49440.311585
190.122790.86830.194701
200.0646420.45710.324794
210.0693820.49060.312926
220.1454861.02870.154275
230.0019720.01390.494465
24-0.045596-0.32240.374242
25-0.139953-0.98960.163563
260.0308880.21840.413999
270.0739060.52260.301783
28-0.039747-0.28110.389915
29-0.121639-0.86010.196915
300.1101080.77860.219947
31-0.000991-0.0070.497219
32-0.059635-0.42170.337533
33-0.030486-0.21560.4151
34-0.090249-0.63820.263143
350.034370.2430.404487
36-0.067988-0.48070.316397


Parameters (Session):
par1 = FALSE ; par2 = 1 ; par3 = 2 ; par4 = 0 ; par5 = 1 ; par6 = 3 ; par7 = 1 ; par8 = 2 ; par9 = 0 ;
Parameters (R input):
par1 = 36 ; par2 = 1 ; par3 = 1 ; par4 = 0 ; par5 = 12 ; par6 = White Noise ; par7 = 0.95 ; par8 = ;
R code (references can be found in the software module):
par8 <- ''
par7 <- '0.95'
par6 <- 'White Noise'
par5 <- '12'
par4 <- '0'
par3 <- '0'
par2 <- '1'
par1 <- 'Default'
if (par1 == 'Default') {
par1 = 10*log10(length(x))
} else {
par1 <- as.numeric(par1)
}
par2 <- as.numeric(par2)
par3 <- as.numeric(par3)
par4 <- as.numeric(par4)
par5 <- as.numeric(par5)
if (par6 == 'White Noise') par6 <- 'white' else par6 <- 'ma'
par7 <- as.numeric(par7)
if (par8 != '') par8 <- as.numeric(par8)
x <- na.omit(x)
ox <- x
if (par8 == '') {
if (par2 == 0) {
x <- log(x)
} else {
x <- (x ^ par2 - 1) / par2
}
} else {
x <- log(x,base=par8)
}
if (par3 > 0) x <- diff(x,lag=1,difference=par3)
if (par4 > 0) x <- diff(x,lag=par5,difference=par4)
bitmap(file='picts.png')
op <- par(mfrow=c(2,1))
plot(ox,type='l',main='Original Time Series',xlab='time',ylab='value')
if (par8=='') {
mytitle <- paste('Working Time Series (lambda=',par2,', d=',par3,', D=',par4,')',sep='')
mysub <- paste('(lambda=',par2,', d=',par3,', D=',par4,', CI=', par7, ', CI type=',par6,')',sep='')
} else {
mytitle <- paste('Working Time Series (base=',par8,', d=',par3,', D=',par4,')',sep='')
mysub <- paste('(base=',par8,', d=',par3,', D=',par4,', CI=', par7, ', CI type=',par6,')',sep='')
}
plot(x,type='l', main=mytitle,xlab='time',ylab='value')
par(op)
dev.off()
bitmap(file='pic1.png')
racf <- acf(x, par1, main='Autocorrelation', xlab='time lag', ylab='ACF', ci.type=par6, ci=par7, sub=mysub)
dev.off()
bitmap(file='pic2.png')
rpacf <- pacf(x,par1,main='Partial Autocorrelation',xlab='lags',ylab='PACF',sub=mysub)
dev.off()
(myacf <- c(racf$acf))
(mypacf <- c(rpacf$acf))
lengthx <- length(x)
sqrtn <- sqrt(lengthx)
load(file='createtable')
a<-table.start()
a<-table.row.start(a)
a<-table.element(a,'Autocorrelation Function',4,TRUE)
a<-table.row.end(a)
a<-table.row.start(a)
a<-table.element(a,'Time lag k',header=TRUE)
a<-table.element(a,'ACF(k)',header=TRUE)
a<-table.element(a,'T-STAT',header=TRUE)
a<-table.element(a,'P-value',header=TRUE)
a<-table.row.end(a)
for (i in 2:(par1+1)) {
a<-table.row.start(a)
a<-table.element(a,i-1,header=TRUE)
a<-table.element(a,round(myacf[i],6))
mytstat <- myacf[i]*sqrtn
a<-table.element(a,round(mytstat,4))
a<-table.element(a,round(1-pt(abs(mytstat),lengthx),6))
a<-table.row.end(a)
}
a<-table.end(a)
table.save(a,file='mytable.tab')
a<-table.start()
a<-table.row.start(a)
a<-table.element(a,'Partial Autocorrelation Function',4,TRUE)
a<-table.row.end(a)
a<-table.row.start(a)
a<-table.element(a,'Time lag k',header=TRUE)
a<-table.element(a,'PACF(k)',header=TRUE)
a<-table.element(a,'T-STAT',header=TRUE)
a<-table.element(a,'P-value',header=TRUE)
a<-table.row.end(a)
for (i in 1:par1) {
a<-table.row.start(a)
a<-table.element(a,i,header=TRUE)
a<-table.element(a,round(mypacf[i],6))
mytstat <- mypacf[i]*sqrtn
a<-table.element(a,round(mytstat,4))
a<-table.element(a,round(1-pt(abs(mytstat),lengthx),6))
a<-table.row.end(a)
}
a<-table.end(a)
table.save(a,file='mytable1.tab')