Free Statistics

of Irreproducible Research!

Author's title

Author*The author of this computation has been verified*
R Software Modulerwasp_exponentialsmoothing.wasp
Title produced by softwareExponential Smoothing
Date of computationFri, 16 Dec 2016 17:47:13 +0100
Cite this page as followsStatistical Computations at FreeStatistics.org, Office for Research Development and Education, URL https://freestatistics.org/blog/index.php?v=date/2016/Dec/16/t1481906852g8ni3mljkzc7o8g.htm/, Retrieved Fri, 03 May 2024 03:15:38 +0000
Statistical Computations at FreeStatistics.org, Office for Research Development and Education, URL https://freestatistics.org/blog/index.php?pk=300444, Retrieved Fri, 03 May 2024 03:15:38 +0000
QR Codes:

Original text written by user:
IsPrivate?No (this computation is public)
User-defined keywords
Estimated Impact72
Family? (F = Feedback message, R = changed R code, M = changed R Module, P = changed Parameters, D = changed Data)
-     [ARIMA Backward Selection] [] [2016-12-16 13:36:55] [683f400e1b95307fc738e729f07c4fce]
-    D  [ARIMA Backward Selection] [] [2016-12-16 14:17:56] [683f400e1b95307fc738e729f07c4fce]
- R  D    [ARIMA Backward Selection] [] [2016-12-16 14:51:40] [683f400e1b95307fc738e729f07c4fce]
- RM D        [Exponential Smoothing] [] [2016-12-16 16:47:13] [404ac5ee4f7301873f6a96ef36861981] [Current]
Feedback Forum

Post a new message
Dataseries X:
5190
4805
4935
3675
3805
5260
6735
5435
3090
4750
3110
3135
4985
3665
3535
4195
3960
3150
3330
4265
4240
4255
3685
3525
4000
3050
3800
3035
3095
2820
2760
4435
3665
4140
2890
3295
2660
2950
2770
3365
3090
3275
3370
2685
2760
3030
2410
2570
2675
3100
3025


Summary of computational transaction
Raw Input view raw input (R code)
Raw Outputview raw output of R engine
Computing time2 seconds
R ServerBig Analytics Cloud Computing Center

\begin{tabular}{lllllllll}
\hline
Summary of computational transaction \tabularnewline
Raw Input view raw input (R code)  \tabularnewline
Raw Outputview raw output of R engine  \tabularnewline
Computing time2 seconds \tabularnewline
R ServerBig Analytics Cloud Computing Center \tabularnewline
\hline
\end{tabular}
%Source: https://freestatistics.org/blog/index.php?pk=300444&T=0

[TABLE]
[ROW]
Summary of computational transaction[/C][/ROW] [ROW]Raw Input[/C] view raw input (R code) [/C][/ROW] [ROW]Raw Output[/C]view raw output of R engine [/C][/ROW] [ROW]Computing time[/C]2 seconds[/C][/ROW] [ROW]R Server[/C]Big Analytics Cloud Computing Center[/C][/ROW] [/TABLE] Source: https://freestatistics.org/blog/index.php?pk=300444&T=0

Globally Unique Identifier (entire table): ba.freestatistics.org/blog/index.php?pk=300444&T=0

As an alternative you can also use a QR Code:  

The GUIDs for individual cells are displayed in the table below:

Summary of computational transaction
Raw Input view raw input (R code)
Raw Outputview raw output of R engine
Computing time2 seconds
R ServerBig Analytics Cloud Computing Center


Estimated Parameters of Exponential Smoothing
ParameterValue
alpha0.0809671523827032
beta0
gamma0.870473613533781

\begin{tabular}{lllllllll}
\hline
Estimated Parameters of Exponential Smoothing \tabularnewline
Parameter & Value \tabularnewline
alpha & 0.0809671523827032 \tabularnewline
beta & 0 \tabularnewline
gamma & 0.870473613533781 \tabularnewline
\hline
\end{tabular}
%Source: https://freestatistics.org/blog/index.php?pk=300444&T=1

[TABLE]
[ROW][C]Estimated Parameters of Exponential Smoothing[/C][/ROW]
[ROW][C]Parameter[/C][C]Value[/C][/ROW]
[ROW][C]alpha[/C][C]0.0809671523827032[/C][/ROW]
[ROW][C]beta[/C][C]0[/C][/ROW]
[ROW][C]gamma[/C][C]0.870473613533781[/C][/ROW]
[/TABLE]
Source: https://freestatistics.org/blog/index.php?pk=300444&T=1

Globally Unique Identifier (entire table): ba.freestatistics.org/blog/index.php?pk=300444&T=1

As an alternative you can also use a QR Code:  

The GUIDs for individual cells are displayed in the table below:

Estimated Parameters of Exponential Smoothing
ParameterValue
alpha0.0809671523827032
beta0
gamma0.870473613533781


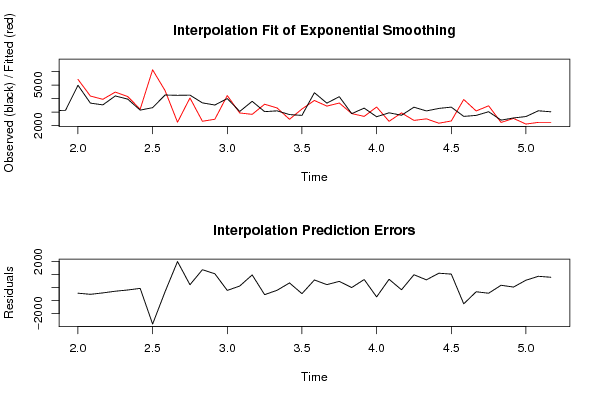
Interpolation Forecasts of Exponential Smoothing
tObservedFittedResiduals
1349855420.11351495727-435.113514957267
1436654187.67863017047-522.678630170465
1535353948.36218069012-413.362180690122
1641954479.77177283279-284.771772832789
1739604150.55129745673-190.551297456727
1831503217.08458566801-67.0845856680116
1933306126.53128861355-2796.53128861355
2042654588.31579777456-323.315797774563
2142402255.141189124271984.85881087573
2242554044.68623907178210.313760928223
2336852325.759762883551359.24023711645
2435252474.441925102711050.55807489729
2540004223.37617165956-223.37617165956
2630502938.03350350856111.966496491441
2738002837.55494932031962.445050679693
2830353583.2312698749-548.231269874902
2930953308.05502951796-213.055029517962
3028202471.53886397414348.461136025858
3127603231.09056129427-471.090561294265
3244353859.71655129666575.28344870334
3336653445.82444215265219.17555784735
3441403672.7820315504467.2179684496
3528902893.79046543462-3.79046543461845
3632952685.16808358513609.831916414867
3726603379.27843343002-719.278433430017
3829502322.05604137485627.943958625146
3927702943.73232064218-173.732320642177
4033652388.88383838833976.116161611671
4130902505.26859768159584.731402318412
4232752182.556403374521092.44359662548
4333702346.709929402371023.29007059763
4426853933.424430078-1248.424430078
4527603086.98776679005-326.987766790052
4630303468.15646854453-438.156468544529
4724102239.05546492978170.94453507022
4825702535.4750064035434.5249935964607
4926752119.72429532619555.275704673811
5031002243.46854229372856.531457706283
5130252242.3168122802782.683187719796

\begin{tabular}{lllllllll}
\hline
Interpolation Forecasts of Exponential Smoothing \tabularnewline
t & Observed & Fitted & Residuals \tabularnewline
13 & 4985 & 5420.11351495727 & -435.113514957267 \tabularnewline
14 & 3665 & 4187.67863017047 & -522.678630170465 \tabularnewline
15 & 3535 & 3948.36218069012 & -413.362180690122 \tabularnewline
16 & 4195 & 4479.77177283279 & -284.771772832789 \tabularnewline
17 & 3960 & 4150.55129745673 & -190.551297456727 \tabularnewline
18 & 3150 & 3217.08458566801 & -67.0845856680116 \tabularnewline
19 & 3330 & 6126.53128861355 & -2796.53128861355 \tabularnewline
20 & 4265 & 4588.31579777456 & -323.315797774563 \tabularnewline
21 & 4240 & 2255.14118912427 & 1984.85881087573 \tabularnewline
22 & 4255 & 4044.68623907178 & 210.313760928223 \tabularnewline
23 & 3685 & 2325.75976288355 & 1359.24023711645 \tabularnewline
24 & 3525 & 2474.44192510271 & 1050.55807489729 \tabularnewline
25 & 4000 & 4223.37617165956 & -223.37617165956 \tabularnewline
26 & 3050 & 2938.03350350856 & 111.966496491441 \tabularnewline
27 & 3800 & 2837.55494932031 & 962.445050679693 \tabularnewline
28 & 3035 & 3583.2312698749 & -548.231269874902 \tabularnewline
29 & 3095 & 3308.05502951796 & -213.055029517962 \tabularnewline
30 & 2820 & 2471.53886397414 & 348.461136025858 \tabularnewline
31 & 2760 & 3231.09056129427 & -471.090561294265 \tabularnewline
32 & 4435 & 3859.71655129666 & 575.28344870334 \tabularnewline
33 & 3665 & 3445.82444215265 & 219.17555784735 \tabularnewline
34 & 4140 & 3672.7820315504 & 467.2179684496 \tabularnewline
35 & 2890 & 2893.79046543462 & -3.79046543461845 \tabularnewline
36 & 3295 & 2685.16808358513 & 609.831916414867 \tabularnewline
37 & 2660 & 3379.27843343002 & -719.278433430017 \tabularnewline
38 & 2950 & 2322.05604137485 & 627.943958625146 \tabularnewline
39 & 2770 & 2943.73232064218 & -173.732320642177 \tabularnewline
40 & 3365 & 2388.88383838833 & 976.116161611671 \tabularnewline
41 & 3090 & 2505.26859768159 & 584.731402318412 \tabularnewline
42 & 3275 & 2182.55640337452 & 1092.44359662548 \tabularnewline
43 & 3370 & 2346.70992940237 & 1023.29007059763 \tabularnewline
44 & 2685 & 3933.424430078 & -1248.424430078 \tabularnewline
45 & 2760 & 3086.98776679005 & -326.987766790052 \tabularnewline
46 & 3030 & 3468.15646854453 & -438.156468544529 \tabularnewline
47 & 2410 & 2239.05546492978 & 170.94453507022 \tabularnewline
48 & 2570 & 2535.47500640354 & 34.5249935964607 \tabularnewline
49 & 2675 & 2119.72429532619 & 555.275704673811 \tabularnewline
50 & 3100 & 2243.46854229372 & 856.531457706283 \tabularnewline
51 & 3025 & 2242.3168122802 & 782.683187719796 \tabularnewline
\hline
\end{tabular}
%Source: https://freestatistics.org/blog/index.php?pk=300444&T=2

[TABLE]
[ROW][C]Interpolation Forecasts of Exponential Smoothing[/C][/ROW]
[ROW][C]t[/C][C]Observed[/C][C]Fitted[/C][C]Residuals[/C][/ROW]
[ROW][C]13[/C][C]4985[/C][C]5420.11351495727[/C][C]-435.113514957267[/C][/ROW]
[ROW][C]14[/C][C]3665[/C][C]4187.67863017047[/C][C]-522.678630170465[/C][/ROW]
[ROW][C]15[/C][C]3535[/C][C]3948.36218069012[/C][C]-413.362180690122[/C][/ROW]
[ROW][C]16[/C][C]4195[/C][C]4479.77177283279[/C][C]-284.771772832789[/C][/ROW]
[ROW][C]17[/C][C]3960[/C][C]4150.55129745673[/C][C]-190.551297456727[/C][/ROW]
[ROW][C]18[/C][C]3150[/C][C]3217.08458566801[/C][C]-67.0845856680116[/C][/ROW]
[ROW][C]19[/C][C]3330[/C][C]6126.53128861355[/C][C]-2796.53128861355[/C][/ROW]
[ROW][C]20[/C][C]4265[/C][C]4588.31579777456[/C][C]-323.315797774563[/C][/ROW]
[ROW][C]21[/C][C]4240[/C][C]2255.14118912427[/C][C]1984.85881087573[/C][/ROW]
[ROW][C]22[/C][C]4255[/C][C]4044.68623907178[/C][C]210.313760928223[/C][/ROW]
[ROW][C]23[/C][C]3685[/C][C]2325.75976288355[/C][C]1359.24023711645[/C][/ROW]
[ROW][C]24[/C][C]3525[/C][C]2474.44192510271[/C][C]1050.55807489729[/C][/ROW]
[ROW][C]25[/C][C]4000[/C][C]4223.37617165956[/C][C]-223.37617165956[/C][/ROW]
[ROW][C]26[/C][C]3050[/C][C]2938.03350350856[/C][C]111.966496491441[/C][/ROW]
[ROW][C]27[/C][C]3800[/C][C]2837.55494932031[/C][C]962.445050679693[/C][/ROW]
[ROW][C]28[/C][C]3035[/C][C]3583.2312698749[/C][C]-548.231269874902[/C][/ROW]
[ROW][C]29[/C][C]3095[/C][C]3308.05502951796[/C][C]-213.055029517962[/C][/ROW]
[ROW][C]30[/C][C]2820[/C][C]2471.53886397414[/C][C]348.461136025858[/C][/ROW]
[ROW][C]31[/C][C]2760[/C][C]3231.09056129427[/C][C]-471.090561294265[/C][/ROW]
[ROW][C]32[/C][C]4435[/C][C]3859.71655129666[/C][C]575.28344870334[/C][/ROW]
[ROW][C]33[/C][C]3665[/C][C]3445.82444215265[/C][C]219.17555784735[/C][/ROW]
[ROW][C]34[/C][C]4140[/C][C]3672.7820315504[/C][C]467.2179684496[/C][/ROW]
[ROW][C]35[/C][C]2890[/C][C]2893.79046543462[/C][C]-3.79046543461845[/C][/ROW]
[ROW][C]36[/C][C]3295[/C][C]2685.16808358513[/C][C]609.831916414867[/C][/ROW]
[ROW][C]37[/C][C]2660[/C][C]3379.27843343002[/C][C]-719.278433430017[/C][/ROW]
[ROW][C]38[/C][C]2950[/C][C]2322.05604137485[/C][C]627.943958625146[/C][/ROW]
[ROW][C]39[/C][C]2770[/C][C]2943.73232064218[/C][C]-173.732320642177[/C][/ROW]
[ROW][C]40[/C][C]3365[/C][C]2388.88383838833[/C][C]976.116161611671[/C][/ROW]
[ROW][C]41[/C][C]3090[/C][C]2505.26859768159[/C][C]584.731402318412[/C][/ROW]
[ROW][C]42[/C][C]3275[/C][C]2182.55640337452[/C][C]1092.44359662548[/C][/ROW]
[ROW][C]43[/C][C]3370[/C][C]2346.70992940237[/C][C]1023.29007059763[/C][/ROW]
[ROW][C]44[/C][C]2685[/C][C]3933.424430078[/C][C]-1248.424430078[/C][/ROW]
[ROW][C]45[/C][C]2760[/C][C]3086.98776679005[/C][C]-326.987766790052[/C][/ROW]
[ROW][C]46[/C][C]3030[/C][C]3468.15646854453[/C][C]-438.156468544529[/C][/ROW]
[ROW][C]47[/C][C]2410[/C][C]2239.05546492978[/C][C]170.94453507022[/C][/ROW]
[ROW][C]48[/C][C]2570[/C][C]2535.47500640354[/C][C]34.5249935964607[/C][/ROW]
[ROW][C]49[/C][C]2675[/C][C]2119.72429532619[/C][C]555.275704673811[/C][/ROW]
[ROW][C]50[/C][C]3100[/C][C]2243.46854229372[/C][C]856.531457706283[/C][/ROW]
[ROW][C]51[/C][C]3025[/C][C]2242.3168122802[/C][C]782.683187719796[/C][/ROW]
[/TABLE]
Source: https://freestatistics.org/blog/index.php?pk=300444&T=2

Globally Unique Identifier (entire table): ba.freestatistics.org/blog/index.php?pk=300444&T=2

As an alternative you can also use a QR Code:  

The GUIDs for individual cells are displayed in the table below:

Interpolation Forecasts of Exponential Smoothing
tObservedFittedResiduals
1349855420.11351495727-435.113514957267
1436654187.67863017047-522.678630170465
1535353948.36218069012-413.362180690122
1641954479.77177283279-284.771772832789
1739604150.55129745673-190.551297456727
1831503217.08458566801-67.0845856680116
1933306126.53128861355-2796.53128861355
2042654588.31579777456-323.315797774563
2142402255.141189124271984.85881087573
2242554044.68623907178210.313760928223
2336852325.759762883551359.24023711645
2435252474.441925102711050.55807489729
2540004223.37617165956-223.37617165956
2630502938.03350350856111.966496491441
2738002837.55494932031962.445050679693
2830353583.2312698749-548.231269874902
2930953308.05502951796-213.055029517962
3028202471.53886397414348.461136025858
3127603231.09056129427-471.090561294265
3244353859.71655129666575.28344870334
3336653445.82444215265219.17555784735
3441403672.7820315504467.2179684496
3528902893.79046543462-3.79046543461845
3632952685.16808358513609.831916414867
3726603379.27843343002-719.278433430017
3829502322.05604137485627.943958625146
3927702943.73232064218-173.732320642177
4033652388.88383838833976.116161611671
4130902505.26859768159584.731402318412
4232752182.556403374521092.44359662548
4333702346.709929402371023.29007059763
4426853933.424430078-1248.424430078
4527603086.98776679005-326.987766790052
4630303468.15646854453-438.156468544529
4724102239.05546492978170.94453507022
4825702535.4750064035434.5249935964607
4926752119.72429532619555.275704673811
5031002243.46854229372856.531457706283
5130252242.3168122802782.683187719796


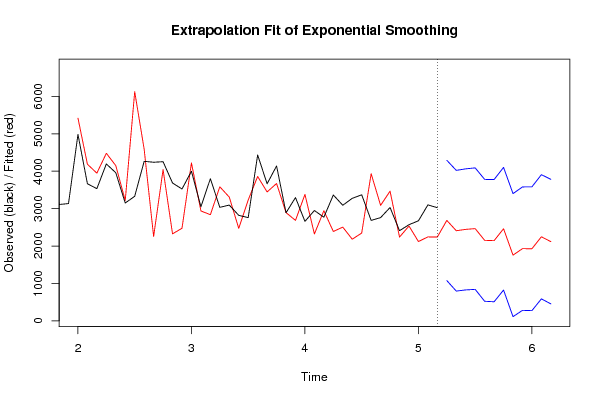
Extrapolation Forecasts of Exponential Smoothing
tForecast95% Lower Bound95% Upper Bound
522684.778277363851076.456068173934293.10048655377
532409.02429265644795.438872675344022.60971263755
542445.13469167375826.3031727757424063.96621057177
552465.51377544328841.4531036764574089.5744472101
562152.0177775802522.7447358276063781.2908193328
572143.80614346261509.3373540439133778.2749328813
582462.51583652883822.8677637443434102.16390931331
591756.16816762759111.357120246183400.979215009
601929.61202352534279.654157217853579.56988983284
611927.66328505809272.574604777783582.75196533841
622247.45118727272587.2475495842353907.65482496121
632117.87038283646452.5674981947043783.17326747821

\begin{tabular}{lllllllll}
\hline
Extrapolation Forecasts of Exponential Smoothing \tabularnewline
t & Forecast & 95% Lower Bound & 95% Upper Bound \tabularnewline
52 & 2684.77827736385 & 1076.45606817393 & 4293.10048655377 \tabularnewline
53 & 2409.02429265644 & 795.43887267534 & 4022.60971263755 \tabularnewline
54 & 2445.13469167375 & 826.303172775742 & 4063.96621057177 \tabularnewline
55 & 2465.51377544328 & 841.453103676457 & 4089.5744472101 \tabularnewline
56 & 2152.0177775802 & 522.744735827606 & 3781.2908193328 \tabularnewline
57 & 2143.80614346261 & 509.337354043913 & 3778.2749328813 \tabularnewline
58 & 2462.51583652883 & 822.867763744343 & 4102.16390931331 \tabularnewline
59 & 1756.16816762759 & 111.35712024618 & 3400.979215009 \tabularnewline
60 & 1929.61202352534 & 279.65415721785 & 3579.56988983284 \tabularnewline
61 & 1927.66328505809 & 272.57460477778 & 3582.75196533841 \tabularnewline
62 & 2247.45118727272 & 587.247549584235 & 3907.65482496121 \tabularnewline
63 & 2117.87038283646 & 452.567498194704 & 3783.17326747821 \tabularnewline
\hline
\end{tabular}
%Source: https://freestatistics.org/blog/index.php?pk=300444&T=3

[TABLE]
[ROW][C]Extrapolation Forecasts of Exponential Smoothing[/C][/ROW]
[ROW][C]t[/C][C]Forecast[/C][C]95% Lower Bound[/C][C]95% Upper Bound[/C][/ROW]
[ROW][C]52[/C][C]2684.77827736385[/C][C]1076.45606817393[/C][C]4293.10048655377[/C][/ROW]
[ROW][C]53[/C][C]2409.02429265644[/C][C]795.43887267534[/C][C]4022.60971263755[/C][/ROW]
[ROW][C]54[/C][C]2445.13469167375[/C][C]826.303172775742[/C][C]4063.96621057177[/C][/ROW]
[ROW][C]55[/C][C]2465.51377544328[/C][C]841.453103676457[/C][C]4089.5744472101[/C][/ROW]
[ROW][C]56[/C][C]2152.0177775802[/C][C]522.744735827606[/C][C]3781.2908193328[/C][/ROW]
[ROW][C]57[/C][C]2143.80614346261[/C][C]509.337354043913[/C][C]3778.2749328813[/C][/ROW]
[ROW][C]58[/C][C]2462.51583652883[/C][C]822.867763744343[/C][C]4102.16390931331[/C][/ROW]
[ROW][C]59[/C][C]1756.16816762759[/C][C]111.35712024618[/C][C]3400.979215009[/C][/ROW]
[ROW][C]60[/C][C]1929.61202352534[/C][C]279.65415721785[/C][C]3579.56988983284[/C][/ROW]
[ROW][C]61[/C][C]1927.66328505809[/C][C]272.57460477778[/C][C]3582.75196533841[/C][/ROW]
[ROW][C]62[/C][C]2247.45118727272[/C][C]587.247549584235[/C][C]3907.65482496121[/C][/ROW]
[ROW][C]63[/C][C]2117.87038283646[/C][C]452.567498194704[/C][C]3783.17326747821[/C][/ROW]
[/TABLE]
Source: https://freestatistics.org/blog/index.php?pk=300444&T=3

Globally Unique Identifier (entire table): ba.freestatistics.org/blog/index.php?pk=300444&T=3

As an alternative you can also use a QR Code:  

The GUIDs for individual cells are displayed in the table below:

Extrapolation Forecasts of Exponential Smoothing
tForecast95% Lower Bound95% Upper Bound
522684.778277363851076.456068173934293.10048655377
532409.02429265644795.438872675344022.60971263755
542445.13469167375826.3031727757424063.96621057177
552465.51377544328841.4531036764574089.5744472101
562152.0177775802522.7447358276063781.2908193328
572143.80614346261509.3373540439133778.2749328813
582462.51583652883822.8677637443434102.16390931331
591756.16816762759111.357120246183400.979215009
601929.61202352534279.654157217853579.56988983284
611927.66328505809272.574604777783582.75196533841
622247.45118727272587.2475495842353907.65482496121
632117.87038283646452.5674981947043783.17326747821


Parameters (Session):
par1 = FALSE ; par2 = 1 ; par3 = 2 ; par4 = 0 ; par5 = 1 ; par6 = 3 ; par7 = 1 ; par8 = 2 ; par9 = 0 ;
Parameters (R input):
par1 = 12 ; par2 = Triple ; par3 = additive ; par4 = 12 ;
R code (references can be found in the software module):
par1 <- as.numeric(par1)
par4 <- as.numeric(par4)
if (par2 == 'Single') K <- 1
if (par2 == 'Double') K <- 2
if (par2 == 'Triple') K <- par1
nx <- length(x)
nxmK <- nx - K
x <- ts(x, frequency = par1)
if (par2 == 'Single') fit <- HoltWinters(x, gamma=F, beta=F)
if (par2 == 'Double') fit <- HoltWinters(x, gamma=F)
if (par2 == 'Triple') fit <- HoltWinters(x, seasonal=par3)
fit
myresid <- x - fit$fitted[,'xhat']
bitmap(file='test1.png')
op <- par(mfrow=c(2,1))
plot(fit,ylab='Observed (black) / Fitted (red)',main='Interpolation Fit of Exponential Smoothing')
plot(myresid,ylab='Residuals',main='Interpolation Prediction Errors')
par(op)
dev.off()
bitmap(file='test2.png')
p <- predict(fit, par4, prediction.interval=TRUE)
np <- length(p[,1])
plot(fit,p,ylab='Observed (black) / Fitted (red)',main='Extrapolation Fit of Exponential Smoothing')
dev.off()
bitmap(file='test3.png')
op <- par(mfrow = c(2,2))
acf(as.numeric(myresid),lag.max = nx/2,main='Residual ACF')
spectrum(myresid,main='Residals Periodogram')
cpgram(myresid,main='Residal Cumulative Periodogram')
qqnorm(myresid,main='Residual Normal QQ Plot')
qqline(myresid)
par(op)
dev.off()
load(file='createtable')
a<-table.start()
a<-table.row.start(a)
a<-table.element(a,'Estimated Parameters of Exponential Smoothing',2,TRUE)
a<-table.row.end(a)
a<-table.row.start(a)
a<-table.element(a,'Parameter',header=TRUE)
a<-table.element(a,'Value',header=TRUE)
a<-table.row.end(a)
a<-table.row.start(a)
a<-table.element(a,'alpha',header=TRUE)
a<-table.element(a,fit$alpha)
a<-table.row.end(a)
a<-table.row.start(a)
a<-table.element(a,'beta',header=TRUE)
a<-table.element(a,fit$beta)
a<-table.row.end(a)
a<-table.row.start(a)
a<-table.element(a,'gamma',header=TRUE)
a<-table.element(a,fit$gamma)
a<-table.row.end(a)
a<-table.end(a)
table.save(a,file='mytable.tab')
a<-table.start()
a<-table.row.start(a)
a<-table.element(a,'Interpolation Forecasts of Exponential Smoothing',4,TRUE)
a<-table.row.end(a)
a<-table.row.start(a)
a<-table.element(a,'t',header=TRUE)
a<-table.element(a,'Observed',header=TRUE)
a<-table.element(a,'Fitted',header=TRUE)
a<-table.element(a,'Residuals',header=TRUE)
a<-table.row.end(a)
for (i in 1:nxmK) {
a<-table.row.start(a)
a<-table.element(a,i+K,header=TRUE)
a<-table.element(a,x[i+K])
a<-table.element(a,fit$fitted[i,'xhat'])
a<-table.element(a,myresid[i])
a<-table.row.end(a)
}
a<-table.end(a)
table.save(a,file='mytable1.tab')
a<-table.start()
a<-table.row.start(a)
a<-table.element(a,'Extrapolation Forecasts of Exponential Smoothing',4,TRUE)
a<-table.row.end(a)
a<-table.row.start(a)
a<-table.element(a,'t',header=TRUE)
a<-table.element(a,'Forecast',header=TRUE)
a<-table.element(a,'95% Lower Bound',header=TRUE)
a<-table.element(a,'95% Upper Bound',header=TRUE)
a<-table.row.end(a)
for (i in 1:np) {
a<-table.row.start(a)
a<-table.element(a,nx+i,header=TRUE)
a<-table.element(a,p[i,'fit'])
a<-table.element(a,p[i,'lwr'])
a<-table.element(a,p[i,'upr'])
a<-table.row.end(a)
}
a<-table.end(a)
table.save(a,file='mytable2.tab')