Free Statistics

of Irreproducible Research!

Author's title

Author*The author of this computation has been verified*
R Software Modulerwasp_autocorrelation.wasp
Title produced by software(Partial) Autocorrelation Function
Date of computationFri, 16 Dec 2016 20:03:22 +0100
Cite this page as followsStatistical Computations at FreeStatistics.org, Office for Research Development and Education, URL https://freestatistics.org/blog/index.php?v=date/2016/Dec/16/t1481915028iu4572rwcbk7t4g.htm/, Retrieved Thu, 02 May 2024 16:11:21 +0000
Statistical Computations at FreeStatistics.org, Office for Research Development and Education, URL https://freestatistics.org/blog/index.php?pk=300489, Retrieved Thu, 02 May 2024 16:11:21 +0000
QR Codes:

Original text written by user:
IsPrivate?No (this computation is public)
User-defined keywords
Estimated Impact60
Family? (F = Feedback message, R = changed R code, M = changed R Module, P = changed Parameters, D = changed Data)
-       [(Partial) Autocorrelation Function] [autorcorrelatie c...] [2016-12-16 19:03:22] [2d1dd91c3b5ba64567b1d6b2c9fe9017] [Current]
Feedback Forum

Post a new message
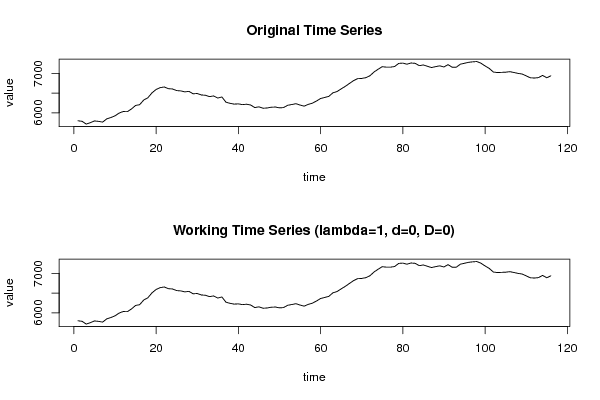
Dataseries X:
5797.8
5784.3
5714.8
5748.8
5793.8
5783.2
5765
5846.1
5879.4
5922.7
5992.7
6032.5
6028.3
6096.3
6184.8
6206.1
6324
6380.6
6504.6
6591
6637.9
6653.8
6611.3
6603.1
6562.8
6554.9
6529.8
6543.4
6481.5
6489.6
6452.3
6444.5
6409.6
6427.5
6374.2
6400.5
6268.2
6239.5
6220.1
6226.6
6207.1
6217.4
6196.9
6132.9
6151.2
6115.2
6122.6
6140.9
6146.5
6126
6131.9
6190.8
6209.2
6230.8
6196.5
6168.2
6213.4
6243
6298.1
6361.4
6388.7
6416.3
6505.7
6538.7
6605.5
6668.9
6741.7
6813.2
6864.3
6870
6889.8
6938.8
7033.3
7104
7168.7
7156
7156.6
7171.8
7251.2
7258.8
7231.5
7261.7
7252.8
7194.2
7211.9
7177.8
7145.9
7170.6
7189.6
7161
7219.9
7155.3
7155.8
7232.1
7254.9
7278.8
7291.2
7298.6
7256.3
7187.7
7126.3
7034.6
7018.6
7024.4
7028.2
7042.2
7022.2
6998.7
6982.7
6936.6
6887.2
6881.1
6890.9
6947.7
6887.5
6937.1


Summary of computational transaction
Raw Input view raw input (R code)
Raw Outputview raw output of R engine
Computing time2 seconds
R ServerBig Analytics Cloud Computing Center

\begin{tabular}{lllllllll}
\hline
Summary of computational transaction \tabularnewline
Raw Input view raw input (R code)  \tabularnewline
Raw Outputview raw output of R engine  \tabularnewline
Computing time2 seconds \tabularnewline
R ServerBig Analytics Cloud Computing Center \tabularnewline
\hline
\end{tabular}
%Source: https://freestatistics.org/blog/index.php?pk=300489&T=0

[TABLE]
[ROW]
Summary of computational transaction[/C][/ROW] [ROW]Raw Input[/C] view raw input (R code) [/C][/ROW] [ROW]Raw Output[/C]view raw output of R engine [/C][/ROW] [ROW]Computing time[/C]2 seconds[/C][/ROW] [ROW]R Server[/C]Big Analytics Cloud Computing Center[/C][/ROW] [/TABLE] Source: https://freestatistics.org/blog/index.php?pk=300489&T=0

Globally Unique Identifier (entire table): ba.freestatistics.org/blog/index.php?pk=300489&T=0

As an alternative you can also use a QR Code:  

The GUIDs for individual cells are displayed in the table below:

Summary of computational transaction
Raw Input view raw input (R code)
Raw Outputview raw output of R engine
Computing time2 seconds
R ServerBig Analytics Cloud Computing Center


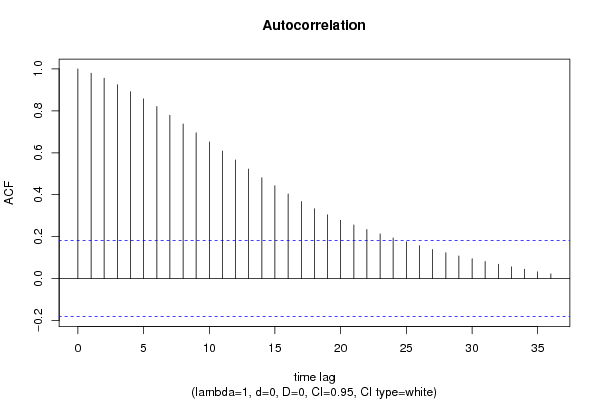
Autocorrelation Function
Time lag kACF(k)T-STATP-value
10.97984710.55330
20.95583610.29470
30.9244959.95710
40.891529.6020
50.8572299.23260
60.8204698.83670
70.779048.39050
80.7375017.94310
90.6951167.48660
100.6514897.01680
110.6082516.55110
120.5655736.09140
130.5221025.62320
140.4807955.17830
150.4423474.76423e-06
160.4030784.34131.5e-05
170.3670343.95316.7e-05
180.3331143.58770.000245
190.3038313.27240.000703
200.278262.99690.001668
210.2554062.75080.00345
220.2341562.52190.006514
230.2128742.29270.011833
240.1936052.08520.019623
250.1748141.88280.031116
260.1560611.68080.047744
270.1385991.49280.069108
280.1232211.32710.093536
290.107451.15730.124769
300.0945331.01820.155362
310.0815050.87780.190923
320.0683750.73640.231481
330.0556520.59940.275042
340.0442550.47660.317258
350.0319050.34360.365875
360.0223250.24050.405203

\begin{tabular}{lllllllll}
\hline
Autocorrelation Function \tabularnewline
Time lag k & ACF(k) & T-STAT & P-value \tabularnewline
1 & 0.979847 & 10.5533 & 0 \tabularnewline
2 & 0.955836 & 10.2947 & 0 \tabularnewline
3 & 0.924495 & 9.9571 & 0 \tabularnewline
4 & 0.89152 & 9.602 & 0 \tabularnewline
5 & 0.857229 & 9.2326 & 0 \tabularnewline
6 & 0.820469 & 8.8367 & 0 \tabularnewline
7 & 0.77904 & 8.3905 & 0 \tabularnewline
8 & 0.737501 & 7.9431 & 0 \tabularnewline
9 & 0.695116 & 7.4866 & 0 \tabularnewline
10 & 0.651489 & 7.0168 & 0 \tabularnewline
11 & 0.608251 & 6.5511 & 0 \tabularnewline
12 & 0.565573 & 6.0914 & 0 \tabularnewline
13 & 0.522102 & 5.6232 & 0 \tabularnewline
14 & 0.480795 & 5.1783 & 0 \tabularnewline
15 & 0.442347 & 4.7642 & 3e-06 \tabularnewline
16 & 0.403078 & 4.3413 & 1.5e-05 \tabularnewline
17 & 0.367034 & 3.9531 & 6.7e-05 \tabularnewline
18 & 0.333114 & 3.5877 & 0.000245 \tabularnewline
19 & 0.303831 & 3.2724 & 0.000703 \tabularnewline
20 & 0.27826 & 2.9969 & 0.001668 \tabularnewline
21 & 0.255406 & 2.7508 & 0.00345 \tabularnewline
22 & 0.234156 & 2.5219 & 0.006514 \tabularnewline
23 & 0.212874 & 2.2927 & 0.011833 \tabularnewline
24 & 0.193605 & 2.0852 & 0.019623 \tabularnewline
25 & 0.174814 & 1.8828 & 0.031116 \tabularnewline
26 & 0.156061 & 1.6808 & 0.047744 \tabularnewline
27 & 0.138599 & 1.4928 & 0.069108 \tabularnewline
28 & 0.123221 & 1.3271 & 0.093536 \tabularnewline
29 & 0.10745 & 1.1573 & 0.124769 \tabularnewline
30 & 0.094533 & 1.0182 & 0.155362 \tabularnewline
31 & 0.081505 & 0.8778 & 0.190923 \tabularnewline
32 & 0.068375 & 0.7364 & 0.231481 \tabularnewline
33 & 0.055652 & 0.5994 & 0.275042 \tabularnewline
34 & 0.044255 & 0.4766 & 0.317258 \tabularnewline
35 & 0.031905 & 0.3436 & 0.365875 \tabularnewline
36 & 0.022325 & 0.2405 & 0.405203 \tabularnewline
\hline
\end{tabular}
%Source: https://freestatistics.org/blog/index.php?pk=300489&T=1

[TABLE]
[ROW][C]Autocorrelation Function[/C][/ROW]
[ROW][C]Time lag k[/C][C]ACF(k)[/C][C]T-STAT[/C][C]P-value[/C][/ROW]
[ROW][C]1[/C][C]0.979847[/C][C]10.5533[/C][C]0[/C][/ROW]
[ROW][C]2[/C][C]0.955836[/C][C]10.2947[/C][C]0[/C][/ROW]
[ROW][C]3[/C][C]0.924495[/C][C]9.9571[/C][C]0[/C][/ROW]
[ROW][C]4[/C][C]0.89152[/C][C]9.602[/C][C]0[/C][/ROW]
[ROW][C]5[/C][C]0.857229[/C][C]9.2326[/C][C]0[/C][/ROW]
[ROW][C]6[/C][C]0.820469[/C][C]8.8367[/C][C]0[/C][/ROW]
[ROW][C]7[/C][C]0.77904[/C][C]8.3905[/C][C]0[/C][/ROW]
[ROW][C]8[/C][C]0.737501[/C][C]7.9431[/C][C]0[/C][/ROW]
[ROW][C]9[/C][C]0.695116[/C][C]7.4866[/C][C]0[/C][/ROW]
[ROW][C]10[/C][C]0.651489[/C][C]7.0168[/C][C]0[/C][/ROW]
[ROW][C]11[/C][C]0.608251[/C][C]6.5511[/C][C]0[/C][/ROW]
[ROW][C]12[/C][C]0.565573[/C][C]6.0914[/C][C]0[/C][/ROW]
[ROW][C]13[/C][C]0.522102[/C][C]5.6232[/C][C]0[/C][/ROW]
[ROW][C]14[/C][C]0.480795[/C][C]5.1783[/C][C]0[/C][/ROW]
[ROW][C]15[/C][C]0.442347[/C][C]4.7642[/C][C]3e-06[/C][/ROW]
[ROW][C]16[/C][C]0.403078[/C][C]4.3413[/C][C]1.5e-05[/C][/ROW]
[ROW][C]17[/C][C]0.367034[/C][C]3.9531[/C][C]6.7e-05[/C][/ROW]
[ROW][C]18[/C][C]0.333114[/C][C]3.5877[/C][C]0.000245[/C][/ROW]
[ROW][C]19[/C][C]0.303831[/C][C]3.2724[/C][C]0.000703[/C][/ROW]
[ROW][C]20[/C][C]0.27826[/C][C]2.9969[/C][C]0.001668[/C][/ROW]
[ROW][C]21[/C][C]0.255406[/C][C]2.7508[/C][C]0.00345[/C][/ROW]
[ROW][C]22[/C][C]0.234156[/C][C]2.5219[/C][C]0.006514[/C][/ROW]
[ROW][C]23[/C][C]0.212874[/C][C]2.2927[/C][C]0.011833[/C][/ROW]
[ROW][C]24[/C][C]0.193605[/C][C]2.0852[/C][C]0.019623[/C][/ROW]
[ROW][C]25[/C][C]0.174814[/C][C]1.8828[/C][C]0.031116[/C][/ROW]
[ROW][C]26[/C][C]0.156061[/C][C]1.6808[/C][C]0.047744[/C][/ROW]
[ROW][C]27[/C][C]0.138599[/C][C]1.4928[/C][C]0.069108[/C][/ROW]
[ROW][C]28[/C][C]0.123221[/C][C]1.3271[/C][C]0.093536[/C][/ROW]
[ROW][C]29[/C][C]0.10745[/C][C]1.1573[/C][C]0.124769[/C][/ROW]
[ROW][C]30[/C][C]0.094533[/C][C]1.0182[/C][C]0.155362[/C][/ROW]
[ROW][C]31[/C][C]0.081505[/C][C]0.8778[/C][C]0.190923[/C][/ROW]
[ROW][C]32[/C][C]0.068375[/C][C]0.7364[/C][C]0.231481[/C][/ROW]
[ROW][C]33[/C][C]0.055652[/C][C]0.5994[/C][C]0.275042[/C][/ROW]
[ROW][C]34[/C][C]0.044255[/C][C]0.4766[/C][C]0.317258[/C][/ROW]
[ROW][C]35[/C][C]0.031905[/C][C]0.3436[/C][C]0.365875[/C][/ROW]
[ROW][C]36[/C][C]0.022325[/C][C]0.2405[/C][C]0.405203[/C][/ROW]
[/TABLE]
Source: https://freestatistics.org/blog/index.php?pk=300489&T=1

Globally Unique Identifier (entire table): ba.freestatistics.org/blog/index.php?pk=300489&T=1

As an alternative you can also use a QR Code:  

The GUIDs for individual cells are displayed in the table below:

Autocorrelation Function
Time lag kACF(k)T-STATP-value
10.97984710.55330
20.95583610.29470
30.9244959.95710
40.891529.6020
50.8572299.23260
60.8204698.83670
70.779048.39050
80.7375017.94310
90.6951167.48660
100.6514897.01680
110.6082516.55110
120.5655736.09140
130.5221025.62320
140.4807955.17830
150.4423474.76423e-06
160.4030784.34131.5e-05
170.3670343.95316.7e-05
180.3331143.58770.000245
190.3038313.27240.000703
200.278262.99690.001668
210.2554062.75080.00345
220.2341562.52190.006514
230.2128742.29270.011833
240.1936052.08520.019623
250.1748141.88280.031116
260.1560611.68080.047744
270.1385991.49280.069108
280.1232211.32710.093536
290.107451.15730.124769
300.0945331.01820.155362
310.0815050.87780.190923
320.0683750.73640.231481
330.0556520.59940.275042
340.0442550.47660.317258
350.0319050.34360.365875
360.0223250.24050.405203


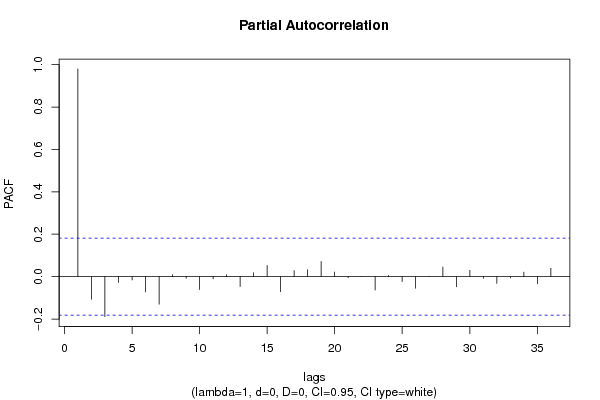
Partial Autocorrelation Function
Time lag kPACF(k)T-STATP-value
10.97984710.55330
2-0.106901-1.15140.125977
3-0.188933-2.03490.022072
4-0.028152-0.30320.381136
5-0.015597-0.1680.433446
6-0.072219-0.77780.219128
7-0.130029-1.40050.082023
80.0088620.09540.462063
9-0.007628-0.08220.467331
10-0.060653-0.65330.257443
11-0.009873-0.10630.457749
120.0086920.09360.462789
13-0.04617-0.49730.30997
140.0180850.19480.422953
150.0528140.56880.285288
16-0.071271-0.76760.222139
170.0283550.30540.380306
180.0321470.34620.364896
190.0714830.76990.221463
200.0211240.22750.410213
21-0.004712-0.05070.479807
220.0003530.00380.498487
23-0.063606-0.68510.247336
240.0055870.06020.476059
25-0.023471-0.25280.400438
26-0.054337-0.58520.279766
27-0.000452-0.00490.498061
280.0448530.48310.314972
29-0.048248-0.51960.30215
300.0295570.31830.375399
31-0.00797-0.08580.465869
32-0.03181-0.34260.366256
33-0.00588-0.06330.474806
340.0210310.22650.410603
35-0.033735-0.36330.358509
360.0393420.42370.336274

\begin{tabular}{lllllllll}
\hline
Partial Autocorrelation Function \tabularnewline
Time lag k & PACF(k) & T-STAT & P-value \tabularnewline
1 & 0.979847 & 10.5533 & 0 \tabularnewline
2 & -0.106901 & -1.1514 & 0.125977 \tabularnewline
3 & -0.188933 & -2.0349 & 0.022072 \tabularnewline
4 & -0.028152 & -0.3032 & 0.381136 \tabularnewline
5 & -0.015597 & -0.168 & 0.433446 \tabularnewline
6 & -0.072219 & -0.7778 & 0.219128 \tabularnewline
7 & -0.130029 & -1.4005 & 0.082023 \tabularnewline
8 & 0.008862 & 0.0954 & 0.462063 \tabularnewline
9 & -0.007628 & -0.0822 & 0.467331 \tabularnewline
10 & -0.060653 & -0.6533 & 0.257443 \tabularnewline
11 & -0.009873 & -0.1063 & 0.457749 \tabularnewline
12 & 0.008692 & 0.0936 & 0.462789 \tabularnewline
13 & -0.04617 & -0.4973 & 0.30997 \tabularnewline
14 & 0.018085 & 0.1948 & 0.422953 \tabularnewline
15 & 0.052814 & 0.5688 & 0.285288 \tabularnewline
16 & -0.071271 & -0.7676 & 0.222139 \tabularnewline
17 & 0.028355 & 0.3054 & 0.380306 \tabularnewline
18 & 0.032147 & 0.3462 & 0.364896 \tabularnewline
19 & 0.071483 & 0.7699 & 0.221463 \tabularnewline
20 & 0.021124 & 0.2275 & 0.410213 \tabularnewline
21 & -0.004712 & -0.0507 & 0.479807 \tabularnewline
22 & 0.000353 & 0.0038 & 0.498487 \tabularnewline
23 & -0.063606 & -0.6851 & 0.247336 \tabularnewline
24 & 0.005587 & 0.0602 & 0.476059 \tabularnewline
25 & -0.023471 & -0.2528 & 0.400438 \tabularnewline
26 & -0.054337 & -0.5852 & 0.279766 \tabularnewline
27 & -0.000452 & -0.0049 & 0.498061 \tabularnewline
28 & 0.044853 & 0.4831 & 0.314972 \tabularnewline
29 & -0.048248 & -0.5196 & 0.30215 \tabularnewline
30 & 0.029557 & 0.3183 & 0.375399 \tabularnewline
31 & -0.00797 & -0.0858 & 0.465869 \tabularnewline
32 & -0.03181 & -0.3426 & 0.366256 \tabularnewline
33 & -0.00588 & -0.0633 & 0.474806 \tabularnewline
34 & 0.021031 & 0.2265 & 0.410603 \tabularnewline
35 & -0.033735 & -0.3633 & 0.358509 \tabularnewline
36 & 0.039342 & 0.4237 & 0.336274 \tabularnewline
\hline
\end{tabular}
%Source: https://freestatistics.org/blog/index.php?pk=300489&T=2

[TABLE]
[ROW][C]Partial Autocorrelation Function[/C][/ROW]
[ROW][C]Time lag k[/C][C]PACF(k)[/C][C]T-STAT[/C][C]P-value[/C][/ROW]
[ROW][C]1[/C][C]0.979847[/C][C]10.5533[/C][C]0[/C][/ROW]
[ROW][C]2[/C][C]-0.106901[/C][C]-1.1514[/C][C]0.125977[/C][/ROW]
[ROW][C]3[/C][C]-0.188933[/C][C]-2.0349[/C][C]0.022072[/C][/ROW]
[ROW][C]4[/C][C]-0.028152[/C][C]-0.3032[/C][C]0.381136[/C][/ROW]
[ROW][C]5[/C][C]-0.015597[/C][C]-0.168[/C][C]0.433446[/C][/ROW]
[ROW][C]6[/C][C]-0.072219[/C][C]-0.7778[/C][C]0.219128[/C][/ROW]
[ROW][C]7[/C][C]-0.130029[/C][C]-1.4005[/C][C]0.082023[/C][/ROW]
[ROW][C]8[/C][C]0.008862[/C][C]0.0954[/C][C]0.462063[/C][/ROW]
[ROW][C]9[/C][C]-0.007628[/C][C]-0.0822[/C][C]0.467331[/C][/ROW]
[ROW][C]10[/C][C]-0.060653[/C][C]-0.6533[/C][C]0.257443[/C][/ROW]
[ROW][C]11[/C][C]-0.009873[/C][C]-0.1063[/C][C]0.457749[/C][/ROW]
[ROW][C]12[/C][C]0.008692[/C][C]0.0936[/C][C]0.462789[/C][/ROW]
[ROW][C]13[/C][C]-0.04617[/C][C]-0.4973[/C][C]0.30997[/C][/ROW]
[ROW][C]14[/C][C]0.018085[/C][C]0.1948[/C][C]0.422953[/C][/ROW]
[ROW][C]15[/C][C]0.052814[/C][C]0.5688[/C][C]0.285288[/C][/ROW]
[ROW][C]16[/C][C]-0.071271[/C][C]-0.7676[/C][C]0.222139[/C][/ROW]
[ROW][C]17[/C][C]0.028355[/C][C]0.3054[/C][C]0.380306[/C][/ROW]
[ROW][C]18[/C][C]0.032147[/C][C]0.3462[/C][C]0.364896[/C][/ROW]
[ROW][C]19[/C][C]0.071483[/C][C]0.7699[/C][C]0.221463[/C][/ROW]
[ROW][C]20[/C][C]0.021124[/C][C]0.2275[/C][C]0.410213[/C][/ROW]
[ROW][C]21[/C][C]-0.004712[/C][C]-0.0507[/C][C]0.479807[/C][/ROW]
[ROW][C]22[/C][C]0.000353[/C][C]0.0038[/C][C]0.498487[/C][/ROW]
[ROW][C]23[/C][C]-0.063606[/C][C]-0.6851[/C][C]0.247336[/C][/ROW]
[ROW][C]24[/C][C]0.005587[/C][C]0.0602[/C][C]0.476059[/C][/ROW]
[ROW][C]25[/C][C]-0.023471[/C][C]-0.2528[/C][C]0.400438[/C][/ROW]
[ROW][C]26[/C][C]-0.054337[/C][C]-0.5852[/C][C]0.279766[/C][/ROW]
[ROW][C]27[/C][C]-0.000452[/C][C]-0.0049[/C][C]0.498061[/C][/ROW]
[ROW][C]28[/C][C]0.044853[/C][C]0.4831[/C][C]0.314972[/C][/ROW]
[ROW][C]29[/C][C]-0.048248[/C][C]-0.5196[/C][C]0.30215[/C][/ROW]
[ROW][C]30[/C][C]0.029557[/C][C]0.3183[/C][C]0.375399[/C][/ROW]
[ROW][C]31[/C][C]-0.00797[/C][C]-0.0858[/C][C]0.465869[/C][/ROW]
[ROW][C]32[/C][C]-0.03181[/C][C]-0.3426[/C][C]0.366256[/C][/ROW]
[ROW][C]33[/C][C]-0.00588[/C][C]-0.0633[/C][C]0.474806[/C][/ROW]
[ROW][C]34[/C][C]0.021031[/C][C]0.2265[/C][C]0.410603[/C][/ROW]
[ROW][C]35[/C][C]-0.033735[/C][C]-0.3633[/C][C]0.358509[/C][/ROW]
[ROW][C]36[/C][C]0.039342[/C][C]0.4237[/C][C]0.336274[/C][/ROW]
[/TABLE]
Source: https://freestatistics.org/blog/index.php?pk=300489&T=2

Globally Unique Identifier (entire table): ba.freestatistics.org/blog/index.php?pk=300489&T=2

As an alternative you can also use a QR Code:  

The GUIDs for individual cells are displayed in the table below:

Partial Autocorrelation Function
Time lag kPACF(k)T-STATP-value
10.97984710.55330
2-0.106901-1.15140.125977
3-0.188933-2.03490.022072
4-0.028152-0.30320.381136
5-0.015597-0.1680.433446
6-0.072219-0.77780.219128
7-0.130029-1.40050.082023
80.0088620.09540.462063
9-0.007628-0.08220.467331
10-0.060653-0.65330.257443
11-0.009873-0.10630.457749
120.0086920.09360.462789
13-0.04617-0.49730.30997
140.0180850.19480.422953
150.0528140.56880.285288
16-0.071271-0.76760.222139
170.0283550.30540.380306
180.0321470.34620.364896
190.0714830.76990.221463
200.0211240.22750.410213
21-0.004712-0.05070.479807
220.0003530.00380.498487
23-0.063606-0.68510.247336
240.0055870.06020.476059
25-0.023471-0.25280.400438
26-0.054337-0.58520.279766
27-0.000452-0.00490.498061
280.0448530.48310.314972
29-0.048248-0.51960.30215
300.0295570.31830.375399
31-0.00797-0.08580.465869
32-0.03181-0.34260.366256
33-0.00588-0.06330.474806
340.0210310.22650.410603
35-0.033735-0.36330.358509
360.0393420.42370.336274


Parameters (Session):
Parameters (R input):
par1 = 36 ; par2 = 1 ; par3 = 0 ; par4 = 0 ; par5 = 12 ; par6 = White Noise ; par7 = 0.95 ; par8 = ;
R code (references can be found in the software module):
par8 <- ''
par7 <- '0.95'
par6 <- 'White Noise'
par5 <- '12'
par4 <- '0'
par3 <- '0'
par2 <- '1'
par1 <- 'Default'
if (par1 == 'Default') {
par1 = 10*log10(length(x))
} else {
par1 <- as.numeric(par1)
}
par2 <- as.numeric(par2)
par3 <- as.numeric(par3)
par4 <- as.numeric(par4)
par5 <- as.numeric(par5)
if (par6 == 'White Noise') par6 <- 'white' else par6 <- 'ma'
par7 <- as.numeric(par7)
if (par8 != '') par8 <- as.numeric(par8)
x <- na.omit(x)
ox <- x
if (par8 == '') {
if (par2 == 0) {
x <- log(x)
} else {
x <- (x ^ par2 - 1) / par2
}
} else {
x <- log(x,base=par8)
}
if (par3 > 0) x <- diff(x,lag=1,difference=par3)
if (par4 > 0) x <- diff(x,lag=par5,difference=par4)
bitmap(file='picts.png')
op <- par(mfrow=c(2,1))
plot(ox,type='l',main='Original Time Series',xlab='time',ylab='value')
if (par8=='') {
mytitle <- paste('Working Time Series (lambda=',par2,', d=',par3,', D=',par4,')',sep='')
mysub <- paste('(lambda=',par2,', d=',par3,', D=',par4,', CI=', par7, ', CI type=',par6,')',sep='')
} else {
mytitle <- paste('Working Time Series (base=',par8,', d=',par3,', D=',par4,')',sep='')
mysub <- paste('(base=',par8,', d=',par3,', D=',par4,', CI=', par7, ', CI type=',par6,')',sep='')
}
plot(x,type='l', main=mytitle,xlab='time',ylab='value')
par(op)
dev.off()
bitmap(file='pic1.png')
racf <- acf(x, par1, main='Autocorrelation', xlab='time lag', ylab='ACF', ci.type=par6, ci=par7, sub=mysub)
dev.off()
bitmap(file='pic2.png')
rpacf <- pacf(x,par1,main='Partial Autocorrelation',xlab='lags',ylab='PACF',sub=mysub)
dev.off()
(myacf <- c(racf$acf))
(mypacf <- c(rpacf$acf))
lengthx <- length(x)
sqrtn <- sqrt(lengthx)
load(file='createtable')
a<-table.start()
a<-table.row.start(a)
a<-table.element(a,'Autocorrelation Function',4,TRUE)
a<-table.row.end(a)
a<-table.row.start(a)
a<-table.element(a,'Time lag k',header=TRUE)
a<-table.element(a,'ACF(k)',header=TRUE)
a<-table.element(a,'T-STAT',header=TRUE)
a<-table.element(a,'P-value',header=TRUE)
a<-table.row.end(a)
for (i in 2:(par1+1)) {
a<-table.row.start(a)
a<-table.element(a,i-1,header=TRUE)
a<-table.element(a,round(myacf[i],6))
mytstat <- myacf[i]*sqrtn
a<-table.element(a,round(mytstat,4))
a<-table.element(a,round(1-pt(abs(mytstat),lengthx),6))
a<-table.row.end(a)
}
a<-table.end(a)
table.save(a,file='mytable.tab')
a<-table.start()
a<-table.row.start(a)
a<-table.element(a,'Partial Autocorrelation Function',4,TRUE)
a<-table.row.end(a)
a<-table.row.start(a)
a<-table.element(a,'Time lag k',header=TRUE)
a<-table.element(a,'PACF(k)',header=TRUE)
a<-table.element(a,'T-STAT',header=TRUE)
a<-table.element(a,'P-value',header=TRUE)
a<-table.row.end(a)
for (i in 1:par1) {
a<-table.row.start(a)
a<-table.element(a,i,header=TRUE)
a<-table.element(a,round(mypacf[i],6))
mytstat <- mypacf[i]*sqrtn
a<-table.element(a,round(mytstat,4))
a<-table.element(a,round(1-pt(abs(mytstat),lengthx),6))
a<-table.row.end(a)
}
a<-table.end(a)
table.save(a,file='mytable1.tab')