Free Statistics

of Irreproducible Research!

Author's title

Author*The author of this computation has been verified*
R Software Modulerwasp_spectrum.wasp
Title produced by softwareSpectral Analysis
Date of computationFri, 16 Dec 2016 21:16:41 +0100
Cite this page as followsStatistical Computations at FreeStatistics.org, Office for Research Development and Education, URL https://freestatistics.org/blog/index.php?v=date/2016/Dec/16/t1481919410f6xmojfjb360qmr.htm/, Retrieved Thu, 02 May 2024 21:41:26 +0000
Statistical Computations at FreeStatistics.org, Office for Research Development and Education, URL https://freestatistics.org/blog/index.php?pk=300537, Retrieved Thu, 02 May 2024 21:41:26 +0000
QR Codes:

Original text written by user:
IsPrivate?No (this computation is public)
User-defined keywords
Estimated Impact66
Family? (F = Feedback message, R = changed R code, M = changed R Module, P = changed Parameters, D = changed Data)
-       [Spectral Analysis] [] [2016-12-16 20:16:41] [404ac5ee4f7301873f6a96ef36861981] [Current]
Feedback Forum

Post a new message
Dataseries X:
2380
2354
2343
2362
2352
2341
2324
2362
2421
2451
2436
2444
2421
2427
2390
2369
2408
2356
2297
2262
2266
2347
2330
2331
2267
2163
2095
2006
2061
1954
1841
1837
1777
1757
1715
1691
1683
1658
1660
1669
1689
1644
1573
1535
1526
1536
1526
1498
1470
1485
1452
1442
1373
1373
1397
1352
1355
1336
1347
1323
1289
1265
1244


Summary of computational transaction
Raw Input view raw input (R code)
Raw Outputview raw output of R engine
Computing time1 seconds
R ServerBig Analytics Cloud Computing Center

\begin{tabular}{lllllllll}
\hline
Summary of computational transaction \tabularnewline
Raw Input view raw input (R code)  \tabularnewline
Raw Outputview raw output of R engine  \tabularnewline
Computing time1 seconds \tabularnewline
R ServerBig Analytics Cloud Computing Center \tabularnewline
\hline
\end{tabular}
%Source: https://freestatistics.org/blog/index.php?pk=300537&T=0

[TABLE]
[ROW]
Summary of computational transaction[/C][/ROW] [ROW]Raw Input[/C] view raw input (R code) [/C][/ROW] [ROW]Raw Output[/C]view raw output of R engine [/C][/ROW] [ROW]Computing time[/C]1 seconds[/C][/ROW] [ROW]R Server[/C]Big Analytics Cloud Computing Center[/C][/ROW] [/TABLE] Source: https://freestatistics.org/blog/index.php?pk=300537&T=0

Globally Unique Identifier (entire table): ba.freestatistics.org/blog/index.php?pk=300537&T=0

As an alternative you can also use a QR Code:  

The GUIDs for individual cells are displayed in the table below:

Summary of computational transaction
Raw Input view raw input (R code)
Raw Outputview raw output of R engine
Computing time1 seconds
R ServerBig Analytics Cloud Computing Center


Raw Periodogram
ParameterValue
Box-Cox transformation parameter (lambda)1
Degree of non-seasonal differencing (d)1
Degree of seasonal differencing (D)0
Seasonal Period (s)1
Frequency (Period)Spectrum
0.0156 (64)4413.463642
0.0312 (32)3034.226377
0.0469 (21.3333)603.920375
0.0625 (16)2689.307821
0.0781 (12.8)2708.6062
0.0938 (10.6667)124.672114
0.1094 (9.1429)1386.506716
0.125 (8)1794.231553
0.1406 (7.1111)1298.716065
0.1562 (6.4)3599.754048
0.1719 (5.8182)3588.560558
0.1875 (5.3333)1341.875262
0.2031 (4.9231)7.988131
0.2188 (4.5714)2218.016527
0.2344 (4.2667)1820.11384
0.25 (4)2237.583153
0.2656 (3.7647)2347.601814
0.2812 (3.5556)373.898001
0.2969 (3.3684)233.098141
0.3125 (3.2)503.466982
0.3281 (3.0476)415.121846
0.3438 (2.9091)1239.695471
0.3594 (2.7826)333.327867
0.375 (2.6667)194.78134
0.3906 (2.56)4329.056013
0.4062 (2.4615)3523.953325
0.4219 (2.3704)2560.926179
0.4375 (2.2857)1426.355816
0.4531 (2.2069)174.952106
0.4688 (2.1333)585.243192
0.4844 (2.0645)35.467636
0.5 (2)64.971416

\begin{tabular}{lllllllll}
\hline
Raw Periodogram \tabularnewline
Parameter & Value \tabularnewline
Box-Cox transformation parameter (lambda) & 1 \tabularnewline
Degree of non-seasonal differencing (d) & 1 \tabularnewline
Degree of seasonal differencing (D) & 0 \tabularnewline
Seasonal Period (s) & 1 \tabularnewline
Frequency (Period) & Spectrum \tabularnewline
0.0156 (64) & 4413.463642 \tabularnewline
0.0312 (32) & 3034.226377 \tabularnewline
0.0469 (21.3333) & 603.920375 \tabularnewline
0.0625 (16) & 2689.307821 \tabularnewline
0.0781 (12.8) & 2708.6062 \tabularnewline
0.0938 (10.6667) & 124.672114 \tabularnewline
0.1094 (9.1429) & 1386.506716 \tabularnewline
0.125 (8) & 1794.231553 \tabularnewline
0.1406 (7.1111) & 1298.716065 \tabularnewline
0.1562 (6.4) & 3599.754048 \tabularnewline
0.1719 (5.8182) & 3588.560558 \tabularnewline
0.1875 (5.3333) & 1341.875262 \tabularnewline
0.2031 (4.9231) & 7.988131 \tabularnewline
0.2188 (4.5714) & 2218.016527 \tabularnewline
0.2344 (4.2667) & 1820.11384 \tabularnewline
0.25 (4) & 2237.583153 \tabularnewline
0.2656 (3.7647) & 2347.601814 \tabularnewline
0.2812 (3.5556) & 373.898001 \tabularnewline
0.2969 (3.3684) & 233.098141 \tabularnewline
0.3125 (3.2) & 503.466982 \tabularnewline
0.3281 (3.0476) & 415.121846 \tabularnewline
0.3438 (2.9091) & 1239.695471 \tabularnewline
0.3594 (2.7826) & 333.327867 \tabularnewline
0.375 (2.6667) & 194.78134 \tabularnewline
0.3906 (2.56) & 4329.056013 \tabularnewline
0.4062 (2.4615) & 3523.953325 \tabularnewline
0.4219 (2.3704) & 2560.926179 \tabularnewline
0.4375 (2.2857) & 1426.355816 \tabularnewline
0.4531 (2.2069) & 174.952106 \tabularnewline
0.4688 (2.1333) & 585.243192 \tabularnewline
0.4844 (2.0645) & 35.467636 \tabularnewline
0.5 (2) & 64.971416 \tabularnewline
\hline
\end{tabular}
%Source: https://freestatistics.org/blog/index.php?pk=300537&T=1

[TABLE]
[ROW][C]Raw Periodogram[/C][/ROW]
[ROW][C]Parameter[/C][C]Value[/C][/ROW]
[ROW][C]Box-Cox transformation parameter (lambda)[/C][C]1[/C][/ROW]
[ROW][C]Degree of non-seasonal differencing (d)[/C][C]1[/C][/ROW]
[ROW][C]Degree of seasonal differencing (D)[/C][C]0[/C][/ROW]
[ROW][C]Seasonal Period (s)[/C][C]1[/C][/ROW]
[ROW][C]Frequency (Period)[/C][C]Spectrum[/C][/ROW]
[ROW][C]0.0156 (64)[/C][C]4413.463642[/C][/ROW]
[ROW][C]0.0312 (32)[/C][C]3034.226377[/C][/ROW]
[ROW][C]0.0469 (21.3333)[/C][C]603.920375[/C][/ROW]
[ROW][C]0.0625 (16)[/C][C]2689.307821[/C][/ROW]
[ROW][C]0.0781 (12.8)[/C][C]2708.6062[/C][/ROW]
[ROW][C]0.0938 (10.6667)[/C][C]124.672114[/C][/ROW]
[ROW][C]0.1094 (9.1429)[/C][C]1386.506716[/C][/ROW]
[ROW][C]0.125 (8)[/C][C]1794.231553[/C][/ROW]
[ROW][C]0.1406 (7.1111)[/C][C]1298.716065[/C][/ROW]
[ROW][C]0.1562 (6.4)[/C][C]3599.754048[/C][/ROW]
[ROW][C]0.1719 (5.8182)[/C][C]3588.560558[/C][/ROW]
[ROW][C]0.1875 (5.3333)[/C][C]1341.875262[/C][/ROW]
[ROW][C]0.2031 (4.9231)[/C][C]7.988131[/C][/ROW]
[ROW][C]0.2188 (4.5714)[/C][C]2218.016527[/C][/ROW]
[ROW][C]0.2344 (4.2667)[/C][C]1820.11384[/C][/ROW]
[ROW][C]0.25 (4)[/C][C]2237.583153[/C][/ROW]
[ROW][C]0.2656 (3.7647)[/C][C]2347.601814[/C][/ROW]
[ROW][C]0.2812 (3.5556)[/C][C]373.898001[/C][/ROW]
[ROW][C]0.2969 (3.3684)[/C][C]233.098141[/C][/ROW]
[ROW][C]0.3125 (3.2)[/C][C]503.466982[/C][/ROW]
[ROW][C]0.3281 (3.0476)[/C][C]415.121846[/C][/ROW]
[ROW][C]0.3438 (2.9091)[/C][C]1239.695471[/C][/ROW]
[ROW][C]0.3594 (2.7826)[/C][C]333.327867[/C][/ROW]
[ROW][C]0.375 (2.6667)[/C][C]194.78134[/C][/ROW]
[ROW][C]0.3906 (2.56)[/C][C]4329.056013[/C][/ROW]
[ROW][C]0.4062 (2.4615)[/C][C]3523.953325[/C][/ROW]
[ROW][C]0.4219 (2.3704)[/C][C]2560.926179[/C][/ROW]
[ROW][C]0.4375 (2.2857)[/C][C]1426.355816[/C][/ROW]
[ROW][C]0.4531 (2.2069)[/C][C]174.952106[/C][/ROW]
[ROW][C]0.4688 (2.1333)[/C][C]585.243192[/C][/ROW]
[ROW][C]0.4844 (2.0645)[/C][C]35.467636[/C][/ROW]
[ROW][C]0.5 (2)[/C][C]64.971416[/C][/ROW]
[/TABLE]
Source: https://freestatistics.org/blog/index.php?pk=300537&T=1

Globally Unique Identifier (entire table): ba.freestatistics.org/blog/index.php?pk=300537&T=1

As an alternative you can also use a QR Code:  

The GUIDs for individual cells are displayed in the table below:

Raw Periodogram
ParameterValue
Box-Cox transformation parameter (lambda)1
Degree of non-seasonal differencing (d)1
Degree of seasonal differencing (D)0
Seasonal Period (s)1
Frequency (Period)Spectrum
0.0156 (64)4413.463642
0.0312 (32)3034.226377
0.0469 (21.3333)603.920375
0.0625 (16)2689.307821
0.0781 (12.8)2708.6062
0.0938 (10.6667)124.672114
0.1094 (9.1429)1386.506716
0.125 (8)1794.231553
0.1406 (7.1111)1298.716065
0.1562 (6.4)3599.754048
0.1719 (5.8182)3588.560558
0.1875 (5.3333)1341.875262
0.2031 (4.9231)7.988131
0.2188 (4.5714)2218.016527
0.2344 (4.2667)1820.11384
0.25 (4)2237.583153
0.2656 (3.7647)2347.601814
0.2812 (3.5556)373.898001
0.2969 (3.3684)233.098141
0.3125 (3.2)503.466982
0.3281 (3.0476)415.121846
0.3438 (2.9091)1239.695471
0.3594 (2.7826)333.327867
0.375 (2.6667)194.78134
0.3906 (2.56)4329.056013
0.4062 (2.4615)3523.953325
0.4219 (2.3704)2560.926179
0.4375 (2.2857)1426.355816
0.4531 (2.2069)174.952106
0.4688 (2.1333)585.243192
0.4844 (2.0645)35.467636
0.5 (2)64.971416


Parameters (Session):
par1 = 12 ; par2 = Double ; par3 = additive ; par4 = 12 ;
Parameters (R input):
par1 = 1 ; par2 = 1 ; par3 = 0 ; par4 = 1 ;
R code (references can be found in the software module):
par4 <- '1'
par3 <- '0'
par2 <- '0'
par1 <- '1'
par1 <- as.numeric(par1)
par2 <- as.numeric(par2)
par3 <- as.numeric(par3)
par4 <- as.numeric(par4)
if (par1 == 0) {
x <- log(x)
} else {
x <- (x ^ par1 - 1) / par1
}
if (par2 > 0) x <- diff(x,lag=1,difference=par2)
if (par3 > 0) x <- diff(x,lag=par4,difference=par3)
bitmap(file='test1.png')
r <- spectrum(x,main='Raw Periodogram')
dev.off()
bitmap(file='test2.png')
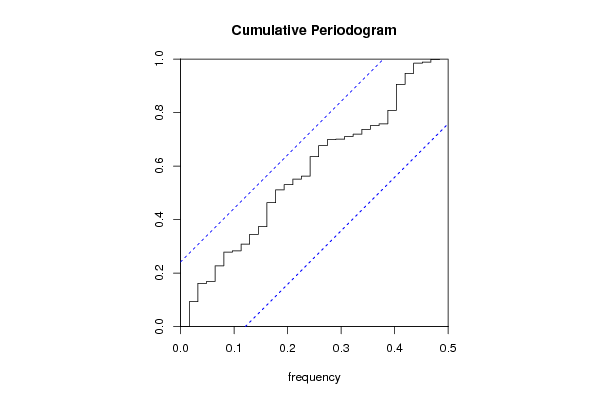
cpgram(x,main='Cumulative Periodogram')
dev.off()
load(file='createtable')
a<-table.start()
a<-table.row.start(a)
a<-table.element(a,'Raw Periodogram',2,TRUE)
a<-table.row.end(a)
a<-table.row.start(a)
a<-table.element(a,'Parameter',header=TRUE)
a<-table.element(a,'Value',header=TRUE)
a<-table.row.end(a)
a<-table.row.start(a)
a<-table.element(a,'Box-Cox transformation parameter (lambda)',header=TRUE)
a<-table.element(a,par1)
a<-table.row.end(a)
a<-table.row.start(a)
a<-table.element(a,'Degree of non-seasonal differencing (d)',header=TRUE)
a<-table.element(a,par2)
a<-table.row.end(a)
a<-table.row.start(a)
a<-table.element(a,'Degree of seasonal differencing (D)',header=TRUE)
a<-table.element(a,par3)
a<-table.row.end(a)
a<-table.row.start(a)
a<-table.element(a,'Seasonal Period (s)',header=TRUE)
a<-table.element(a,par4)
a<-table.row.end(a)
a<-table.row.start(a)
a<-table.element(a,'Frequency (Period)',header=TRUE)
a<-table.element(a,'Spectrum',header=TRUE)
a<-table.row.end(a)
for (i in 1:length(r$freq)) {
a<-table.row.start(a)
mylab <- round(r$freq[i],4)
mylab <- paste(mylab,' (',sep='')
mylab <- paste(mylab,round(1/r$freq[i],4),sep='')
mylab <- paste(mylab,')',sep='')
a<-table.element(a,mylab,header=TRUE)
a<-table.element(a,round(r$spec[i],6))
a<-table.row.end(a)
}
a<-table.end(a)
table.save(a,file='mytable.tab')