Free Statistics

of Irreproducible Research!

Author's title

Author*The author of this computation has been verified*
R Software Modulerwasp_arimabackwardselection.wasp
Title produced by softwareARIMA Backward Selection
Date of computationSat, 17 Dec 2016 01:13:20 +0100
Cite this page as followsStatistical Computations at FreeStatistics.org, Office for Research Development and Education, URL https://freestatistics.org/blog/index.php?v=date/2016/Dec/17/t1481933717ewnctld2rrbah2k.htm/, Retrieved Thu, 02 May 2024 05:22:24 +0000
Statistical Computations at FreeStatistics.org, Office for Research Development and Education, URL https://freestatistics.org/blog/index.php?pk=300588, Retrieved Thu, 02 May 2024 05:22:24 +0000
QR Codes:

Original text written by user:
IsPrivate?No (this computation is public)
User-defined keywords
Estimated Impact113
Family? (F = Feedback message, R = changed R code, M = changed R Module, P = changed Parameters, D = changed Data)
-       [ARIMA Backward Selection] [ARIMA Backward Se...] [2016-12-17 00:13:20] [8dbd6448339a84ba150e9d534057ba9c] [Current]
Feedback Forum

Post a new message
Dataseries X:
4751.5
4649.2
4664.9
4691.3
4713.7
4772.8
4748.9
4801
4891.9
4891.9
4903.5
4976.4
5009.8
4946.4
4981.9
5013.8
5015.5
5070.7
5000.9
5059.1
5156.8
5002.6
5059.1
5164.1
5087.9
5140.8
5192.8
5177.6
5167.8
5248.4
5097.5
5187.3
5261.5
5179.7
5205.6
5353.3
5425.7
5215.2
5215.6
5216.4
5208.2
5237.5
5175
5300.2
5279.3
5262.6
5220.5
5372.1
5406
5317.2
5258.4
5204.2
5304.2
5300.2
5228.8
5303.3
5296
5341.1
5354.8
5447.8
5405.6
5333.4
5291.9
5414.4
5317.2
5380.5
5431.5
5363.5
5435.4
5499.8
5447.4
5633
5617.4
5567.8
5574
5710.4
5583.1
5610.8
5620.1
5759.4
5838.7
5843.3
5821
5895.1
5881.6
5827.7
5865.9
5918.4
5875.2
6078.4
5986.3
6019.7
6255.7
6128.4
6210
6301.8
6305.7
6261.2
6200.5
6185.5
6237.4
6399
6182.5
6292.3
6419.8
6273.7
6344.8
6490.4
6355.4
6383.1
6377.3
6324.9
6342.2
6364.1
6249.5
6439.2
6409.4


Summary of computational transaction
Raw Input view raw input (R code)
Raw Outputview raw output of R engine
Computing time3 seconds
R ServerBig Analytics Cloud Computing Center

\begin{tabular}{lllllllll}
\hline
Summary of computational transaction \tabularnewline
Raw Input view raw input (R code)  \tabularnewline
Raw Outputview raw output of R engine  \tabularnewline
Computing time3 seconds \tabularnewline
R ServerBig Analytics Cloud Computing Center \tabularnewline
\hline
\end{tabular}
%Source: https://freestatistics.org/blog/index.php?pk=300588&T=0

[TABLE]
[ROW]
Summary of computational transaction[/C][/ROW] [ROW]Raw Input[/C] view raw input (R code) [/C][/ROW] [ROW]Raw Output[/C]view raw output of R engine [/C][/ROW] [ROW]Computing time[/C]3 seconds[/C][/ROW] [ROW]R Server[/C]Big Analytics Cloud Computing Center[/C][/ROW] [/TABLE] Source: https://freestatistics.org/blog/index.php?pk=300588&T=0

Globally Unique Identifier (entire table): ba.freestatistics.org/blog/index.php?pk=300588&T=0

As an alternative you can also use a QR Code:  

The GUIDs for individual cells are displayed in the table below:

Summary of computational transaction
Raw Input view raw input (R code)
Raw Outputview raw output of R engine
Computing time3 seconds
R ServerBig Analytics Cloud Computing Center


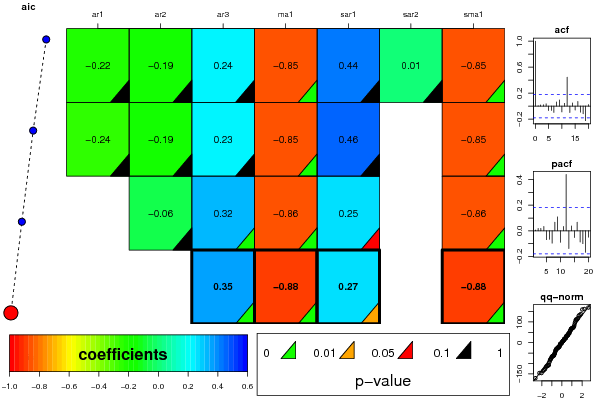
ARIMA Parameter Estimation and Backward Selection
Iterationar1ar2ar3ma1sar1sar2sma1
Estimates ( 1 )-0.2166-0.1880.2373-0.85060.43680.0144-0.8506
(p-val)(0.6879 )(0.5286 )(0.3171 )(0 )(0.4006 )(0.9499 )(0 )
Estimates ( 2 )-0.2384-0.19210.2321-0.84890.45630-0.8489
(p-val)(0.6106 )(0.5619 )(0.3498 )(0 )(0.3313 )(NA )(0 )
Estimates ( 3 )0-0.06460.3203-0.8630.24980-0.863
(p-val)(NA )(0.561 )(0.0052 )(0 )(0.0531 )(NA )(0 )
Estimates ( 4 )000.3451-0.87770.270-0.8777
(p-val)(NA )(NA )(0.0018 )(0 )(0.03 )(NA )(0 )
Estimates ( 5 )NANANANANANANA
(p-val)(NA )(NA )(NA )(NA )(NA )(NA )(NA )
Estimates ( 6 )NANANANANANANA
(p-val)(NA )(NA )(NA )(NA )(NA )(NA )(NA )
Estimates ( 7 )NANANANANANANA
(p-val)(NA )(NA )(NA )(NA )(NA )(NA )(NA )
Estimates ( 8 )NANANANANANANA
(p-val)(NA )(NA )(NA )(NA )(NA )(NA )(NA )
Estimates ( 9 )NANANANANANANA
(p-val)(NA )(NA )(NA )(NA )(NA )(NA )(NA )
Estimates ( 10 )NANANANANANANA
(p-val)(NA )(NA )(NA )(NA )(NA )(NA )(NA )
Estimates ( 11 )NANANANANANANA
(p-val)(NA )(NA )(NA )(NA )(NA )(NA )(NA )
Estimates ( 12 )NANANANANANANA
(p-val)(NA )(NA )(NA )(NA )(NA )(NA )(NA )
Estimates ( 13 )NANANANANANANA
(p-val)(NA )(NA )(NA )(NA )(NA )(NA )(NA )

\begin{tabular}{lllllllll}
\hline
ARIMA Parameter Estimation and Backward Selection \tabularnewline
Iteration & ar1 & ar2 & ar3 & ma1 & sar1 & sar2 & sma1 \tabularnewline
Estimates ( 1 ) & -0.2166 & -0.188 & 0.2373 & -0.8506 & 0.4368 & 0.0144 & -0.8506 \tabularnewline
(p-val) & (0.6879 ) & (0.5286 ) & (0.3171 ) & (0 ) & (0.4006 ) & (0.9499 ) & (0 ) \tabularnewline
Estimates ( 2 ) & -0.2384 & -0.1921 & 0.2321 & -0.8489 & 0.4563 & 0 & -0.8489 \tabularnewline
(p-val) & (0.6106 ) & (0.5619 ) & (0.3498 ) & (0 ) & (0.3313 ) & (NA ) & (0 ) \tabularnewline
Estimates ( 3 ) & 0 & -0.0646 & 0.3203 & -0.863 & 0.2498 & 0 & -0.863 \tabularnewline
(p-val) & (NA ) & (0.561 ) & (0.0052 ) & (0 ) & (0.0531 ) & (NA ) & (0 ) \tabularnewline
Estimates ( 4 ) & 0 & 0 & 0.3451 & -0.8777 & 0.27 & 0 & -0.8777 \tabularnewline
(p-val) & (NA ) & (NA ) & (0.0018 ) & (0 ) & (0.03 ) & (NA ) & (0 ) \tabularnewline
Estimates ( 5 ) & NA & NA & NA & NA & NA & NA & NA \tabularnewline
(p-val) & (NA ) & (NA ) & (NA ) & (NA ) & (NA ) & (NA ) & (NA ) \tabularnewline
Estimates ( 6 ) & NA & NA & NA & NA & NA & NA & NA \tabularnewline
(p-val) & (NA ) & (NA ) & (NA ) & (NA ) & (NA ) & (NA ) & (NA ) \tabularnewline
Estimates ( 7 ) & NA & NA & NA & NA & NA & NA & NA \tabularnewline
(p-val) & (NA ) & (NA ) & (NA ) & (NA ) & (NA ) & (NA ) & (NA ) \tabularnewline
Estimates ( 8 ) & NA & NA & NA & NA & NA & NA & NA \tabularnewline
(p-val) & (NA ) & (NA ) & (NA ) & (NA ) & (NA ) & (NA ) & (NA ) \tabularnewline
Estimates ( 9 ) & NA & NA & NA & NA & NA & NA & NA \tabularnewline
(p-val) & (NA ) & (NA ) & (NA ) & (NA ) & (NA ) & (NA ) & (NA ) \tabularnewline
Estimates ( 10 ) & NA & NA & NA & NA & NA & NA & NA \tabularnewline
(p-val) & (NA ) & (NA ) & (NA ) & (NA ) & (NA ) & (NA ) & (NA ) \tabularnewline
Estimates ( 11 ) & NA & NA & NA & NA & NA & NA & NA \tabularnewline
(p-val) & (NA ) & (NA ) & (NA ) & (NA ) & (NA ) & (NA ) & (NA ) \tabularnewline
Estimates ( 12 ) & NA & NA & NA & NA & NA & NA & NA \tabularnewline
(p-val) & (NA ) & (NA ) & (NA ) & (NA ) & (NA ) & (NA ) & (NA ) \tabularnewline
Estimates ( 13 ) & NA & NA & NA & NA & NA & NA & NA \tabularnewline
(p-val) & (NA ) & (NA ) & (NA ) & (NA ) & (NA ) & (NA ) & (NA ) \tabularnewline
\hline
\end{tabular}
%Source: https://freestatistics.org/blog/index.php?pk=300588&T=1

[TABLE]
[ROW][C]ARIMA Parameter Estimation and Backward Selection[/C][/ROW]
[ROW][C]Iteration[/C][C]ar1[/C][C]ar2[/C][C]ar3[/C][C]ma1[/C][C]sar1[/C][C]sar2[/C][C]sma1[/C][/ROW]
[ROW][C]Estimates ( 1 )[/C][C]-0.2166[/C][C]-0.188[/C][C]0.2373[/C][C]-0.8506[/C][C]0.4368[/C][C]0.0144[/C][C]-0.8506[/C][/ROW]
[ROW][C](p-val)[/C][C](0.6879 )[/C][C](0.5286 )[/C][C](0.3171 )[/C][C](0 )[/C][C](0.4006 )[/C][C](0.9499 )[/C][C](0 )[/C][/ROW]
[ROW][C]Estimates ( 2 )[/C][C]-0.2384[/C][C]-0.1921[/C][C]0.2321[/C][C]-0.8489[/C][C]0.4563[/C][C]0[/C][C]-0.8489[/C][/ROW]
[ROW][C](p-val)[/C][C](0.6106 )[/C][C](0.5619 )[/C][C](0.3498 )[/C][C](0 )[/C][C](0.3313 )[/C][C](NA )[/C][C](0 )[/C][/ROW]
[ROW][C]Estimates ( 3 )[/C][C]0[/C][C]-0.0646[/C][C]0.3203[/C][C]-0.863[/C][C]0.2498[/C][C]0[/C][C]-0.863[/C][/ROW]
[ROW][C](p-val)[/C][C](NA )[/C][C](0.561 )[/C][C](0.0052 )[/C][C](0 )[/C][C](0.0531 )[/C][C](NA )[/C][C](0 )[/C][/ROW]
[ROW][C]Estimates ( 4 )[/C][C]0[/C][C]0[/C][C]0.3451[/C][C]-0.8777[/C][C]0.27[/C][C]0[/C][C]-0.8777[/C][/ROW]
[ROW][C](p-val)[/C][C](NA )[/C][C](NA )[/C][C](0.0018 )[/C][C](0 )[/C][C](0.03 )[/C][C](NA )[/C][C](0 )[/C][/ROW]
[ROW][C]Estimates ( 5 )[/C][C]NA[/C][C]NA[/C][C]NA[/C][C]NA[/C][C]NA[/C][C]NA[/C][C]NA[/C][/ROW]
[ROW][C](p-val)[/C][C](NA )[/C][C](NA )[/C][C](NA )[/C][C](NA )[/C][C](NA )[/C][C](NA )[/C][C](NA )[/C][/ROW]
[ROW][C]Estimates ( 6 )[/C][C]NA[/C][C]NA[/C][C]NA[/C][C]NA[/C][C]NA[/C][C]NA[/C][C]NA[/C][/ROW]
[ROW][C](p-val)[/C][C](NA )[/C][C](NA )[/C][C](NA )[/C][C](NA )[/C][C](NA )[/C][C](NA )[/C][C](NA )[/C][/ROW]
[ROW][C]Estimates ( 7 )[/C][C]NA[/C][C]NA[/C][C]NA[/C][C]NA[/C][C]NA[/C][C]NA[/C][C]NA[/C][/ROW]
[ROW][C](p-val)[/C][C](NA )[/C][C](NA )[/C][C](NA )[/C][C](NA )[/C][C](NA )[/C][C](NA )[/C][C](NA )[/C][/ROW]
[ROW][C]Estimates ( 8 )[/C][C]NA[/C][C]NA[/C][C]NA[/C][C]NA[/C][C]NA[/C][C]NA[/C][C]NA[/C][/ROW]
[ROW][C](p-val)[/C][C](NA )[/C][C](NA )[/C][C](NA )[/C][C](NA )[/C][C](NA )[/C][C](NA )[/C][C](NA )[/C][/ROW]
[ROW][C]Estimates ( 9 )[/C][C]NA[/C][C]NA[/C][C]NA[/C][C]NA[/C][C]NA[/C][C]NA[/C][C]NA[/C][/ROW]
[ROW][C](p-val)[/C][C](NA )[/C][C](NA )[/C][C](NA )[/C][C](NA )[/C][C](NA )[/C][C](NA )[/C][C](NA )[/C][/ROW]
[ROW][C]Estimates ( 10 )[/C][C]NA[/C][C]NA[/C][C]NA[/C][C]NA[/C][C]NA[/C][C]NA[/C][C]NA[/C][/ROW]
[ROW][C](p-val)[/C][C](NA )[/C][C](NA )[/C][C](NA )[/C][C](NA )[/C][C](NA )[/C][C](NA )[/C][C](NA )[/C][/ROW]
[ROW][C]Estimates ( 11 )[/C][C]NA[/C][C]NA[/C][C]NA[/C][C]NA[/C][C]NA[/C][C]NA[/C][C]NA[/C][/ROW]
[ROW][C](p-val)[/C][C](NA )[/C][C](NA )[/C][C](NA )[/C][C](NA )[/C][C](NA )[/C][C](NA )[/C][C](NA )[/C][/ROW]
[ROW][C]Estimates ( 12 )[/C][C]NA[/C][C]NA[/C][C]NA[/C][C]NA[/C][C]NA[/C][C]NA[/C][C]NA[/C][/ROW]
[ROW][C](p-val)[/C][C](NA )[/C][C](NA )[/C][C](NA )[/C][C](NA )[/C][C](NA )[/C][C](NA )[/C][C](NA )[/C][/ROW]
[ROW][C]Estimates ( 13 )[/C][C]NA[/C][C]NA[/C][C]NA[/C][C]NA[/C][C]NA[/C][C]NA[/C][C]NA[/C][/ROW]
[ROW][C](p-val)[/C][C](NA )[/C][C](NA )[/C][C](NA )[/C][C](NA )[/C][C](NA )[/C][C](NA )[/C][C](NA )[/C][/ROW]
[/TABLE]
Source: https://freestatistics.org/blog/index.php?pk=300588&T=1

Globally Unique Identifier (entire table): ba.freestatistics.org/blog/index.php?pk=300588&T=1

As an alternative you can also use a QR Code:  

The GUIDs for individual cells are displayed in the table below:

ARIMA Parameter Estimation and Backward Selection
Iterationar1ar2ar3ma1sar1sar2sma1
Estimates ( 1 )-0.2166-0.1880.2373-0.85060.43680.0144-0.8506
(p-val)(0.6879 )(0.5286 )(0.3171 )(0 )(0.4006 )(0.9499 )(0 )
Estimates ( 2 )-0.2384-0.19210.2321-0.84890.45630-0.8489
(p-val)(0.6106 )(0.5619 )(0.3498 )(0 )(0.3313 )(NA )(0 )
Estimates ( 3 )0-0.06460.3203-0.8630.24980-0.863
(p-val)(NA )(0.561 )(0.0052 )(0 )(0.0531 )(NA )(0 )
Estimates ( 4 )000.3451-0.87770.270-0.8777
(p-val)(NA )(NA )(0.0018 )(0 )(0.03 )(NA )(0 )
Estimates ( 5 )NANANANANANANA
(p-val)(NA )(NA )(NA )(NA )(NA )(NA )(NA )
Estimates ( 6 )NANANANANANANA
(p-val)(NA )(NA )(NA )(NA )(NA )(NA )(NA )
Estimates ( 7 )NANANANANANANA
(p-val)(NA )(NA )(NA )(NA )(NA )(NA )(NA )
Estimates ( 8 )NANANANANANANA
(p-val)(NA )(NA )(NA )(NA )(NA )(NA )(NA )
Estimates ( 9 )NANANANANANANA
(p-val)(NA )(NA )(NA )(NA )(NA )(NA )(NA )
Estimates ( 10 )NANANANANANANA
(p-val)(NA )(NA )(NA )(NA )(NA )(NA )(NA )
Estimates ( 11 )NANANANANANANA
(p-val)(NA )(NA )(NA )(NA )(NA )(NA )(NA )
Estimates ( 12 )NANANANANANANA
(p-val)(NA )(NA )(NA )(NA )(NA )(NA )(NA )
Estimates ( 13 )NANANANANANANA
(p-val)(NA )(NA )(NA )(NA )(NA )(NA )(NA )


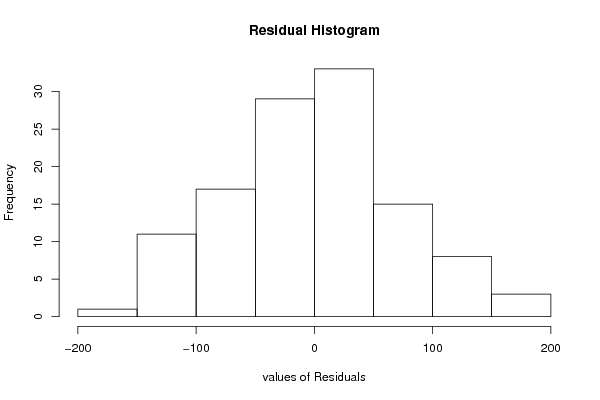
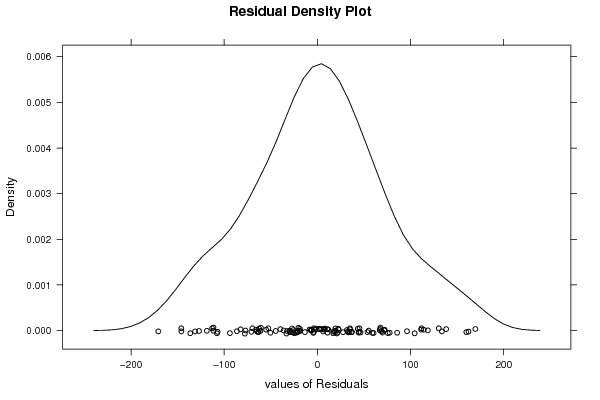
Estimated ARIMA Residuals
Value
-6.6035087725837
60.2577454772137
45.2101179022948
67.0251699858676
71.7338648077441
-3.80632306818539
44.7664446935658
75.6743024200545
32.7666591566215
8.00363225158368
34.9569775941302
33.1309115015733
-60.6944567334932
-27.199822943423
-18.8236887486817
-6.02828251833757
22.9481744161398
-86.4209544040114
6.48932902344932
53.7461891621487
-118.67888344892
-21.4185481396897
27.4998234213628
-28.3835579573393
17.0142690487099
6.13877399033648
4.14309955809621
-33.1840270979293
34.9601307207876
-146.074148986867
19.0191483464247
20.8958347804864
-29.5306082356542
-20.3621610517927
96.1553423164242
133.571824646089
-145.97908011078
-107.078955140203
-111.56801026551
-19.1557651720504
-3.78622451817609
-77.2760261527027
85.5485309787238
-7.03624772744791
10.8372506207766
-82.4269013811841
114.141386954146
77.5753877501297
-23.0268262308419
-111.670089009968
-131.315647050188
43.36772180975
10.5269103132021
-44.7443465808762
19.4415138366313
-8.3883363935386
67.6486038346894
18.7634820641714
111.720851320506
-2.35039318889931
-63.6186787509122
-107.782976740471
67.5708337946594
-62.5016202269768
55.0320841461926
22.2442547435458
-21.1246610726143
44.22766130797
58.9222743163843
1.91754065365993
169.528779589979
36.7085788818127
7.41383032162172
-52.655502245146
104.390859800652
-77.879076575198
-4.38902020310264
-63.0525005012363
138.174774126005
118.550474898785
68.9806833977363
-26.5556539540884
31.6707389904506
-18.6420857347561
-64.9860847838605
-36.3312338939445
11.5625012851466
-39.7259826227563
159.830777828329
-55.0089515504203
34.5226619064711
162.19140487869
-32.5094406884325
69.9695574987626
21.4262665986732
46.3421911782516
-61.101009528074
-136.481267003704
-113.052585384078
-29.7916601303807
130.297300198934
-170.768254516053
17.1808871041576
37.0713775292058
-69.7844474416774
-1.40226335069824
72.2873094494751
-65.9090384731177
-24.9613088560438
-93.9387384194623
-70.9152492570377
-50.4455450850173
-25.7848433005912
-127.085445137377
111.367150581696
-13.4192271963845

\begin{tabular}{lllllllll}
\hline
Estimated ARIMA Residuals \tabularnewline
Value \tabularnewline
-6.6035087725837 \tabularnewline
60.2577454772137 \tabularnewline
45.2101179022948 \tabularnewline
67.0251699858676 \tabularnewline
71.7338648077441 \tabularnewline
-3.80632306818539 \tabularnewline
44.7664446935658 \tabularnewline
75.6743024200545 \tabularnewline
32.7666591566215 \tabularnewline
8.00363225158368 \tabularnewline
34.9569775941302 \tabularnewline
33.1309115015733 \tabularnewline
-60.6944567334932 \tabularnewline
-27.199822943423 \tabularnewline
-18.8236887486817 \tabularnewline
-6.02828251833757 \tabularnewline
22.9481744161398 \tabularnewline
-86.4209544040114 \tabularnewline
6.48932902344932 \tabularnewline
53.7461891621487 \tabularnewline
-118.67888344892 \tabularnewline
-21.4185481396897 \tabularnewline
27.4998234213628 \tabularnewline
-28.3835579573393 \tabularnewline
17.0142690487099 \tabularnewline
6.13877399033648 \tabularnewline
4.14309955809621 \tabularnewline
-33.1840270979293 \tabularnewline
34.9601307207876 \tabularnewline
-146.074148986867 \tabularnewline
19.0191483464247 \tabularnewline
20.8958347804864 \tabularnewline
-29.5306082356542 \tabularnewline
-20.3621610517927 \tabularnewline
96.1553423164242 \tabularnewline
133.571824646089 \tabularnewline
-145.97908011078 \tabularnewline
-107.078955140203 \tabularnewline
-111.56801026551 \tabularnewline
-19.1557651720504 \tabularnewline
-3.78622451817609 \tabularnewline
-77.2760261527027 \tabularnewline
85.5485309787238 \tabularnewline
-7.03624772744791 \tabularnewline
10.8372506207766 \tabularnewline
-82.4269013811841 \tabularnewline
114.141386954146 \tabularnewline
77.5753877501297 \tabularnewline
-23.0268262308419 \tabularnewline
-111.670089009968 \tabularnewline
-131.315647050188 \tabularnewline
43.36772180975 \tabularnewline
10.5269103132021 \tabularnewline
-44.7443465808762 \tabularnewline
19.4415138366313 \tabularnewline
-8.3883363935386 \tabularnewline
67.6486038346894 \tabularnewline
18.7634820641714 \tabularnewline
111.720851320506 \tabularnewline
-2.35039318889931 \tabularnewline
-63.6186787509122 \tabularnewline
-107.782976740471 \tabularnewline
67.5708337946594 \tabularnewline
-62.5016202269768 \tabularnewline
55.0320841461926 \tabularnewline
22.2442547435458 \tabularnewline
-21.1246610726143 \tabularnewline
44.22766130797 \tabularnewline
58.9222743163843 \tabularnewline
1.91754065365993 \tabularnewline
169.528779589979 \tabularnewline
36.7085788818127 \tabularnewline
7.41383032162172 \tabularnewline
-52.655502245146 \tabularnewline
104.390859800652 \tabularnewline
-77.879076575198 \tabularnewline
-4.38902020310264 \tabularnewline
-63.0525005012363 \tabularnewline
138.174774126005 \tabularnewline
118.550474898785 \tabularnewline
68.9806833977363 \tabularnewline
-26.5556539540884 \tabularnewline
31.6707389904506 \tabularnewline
-18.6420857347561 \tabularnewline
-64.9860847838605 \tabularnewline
-36.3312338939445 \tabularnewline
11.5625012851466 \tabularnewline
-39.7259826227563 \tabularnewline
159.830777828329 \tabularnewline
-55.0089515504203 \tabularnewline
34.5226619064711 \tabularnewline
162.19140487869 \tabularnewline
-32.5094406884325 \tabularnewline
69.9695574987626 \tabularnewline
21.4262665986732 \tabularnewline
46.3421911782516 \tabularnewline
-61.101009528074 \tabularnewline
-136.481267003704 \tabularnewline
-113.052585384078 \tabularnewline
-29.7916601303807 \tabularnewline
130.297300198934 \tabularnewline
-170.768254516053 \tabularnewline
17.1808871041576 \tabularnewline
37.0713775292058 \tabularnewline
-69.7844474416774 \tabularnewline
-1.40226335069824 \tabularnewline
72.2873094494751 \tabularnewline
-65.9090384731177 \tabularnewline
-24.9613088560438 \tabularnewline
-93.9387384194623 \tabularnewline
-70.9152492570377 \tabularnewline
-50.4455450850173 \tabularnewline
-25.7848433005912 \tabularnewline
-127.085445137377 \tabularnewline
111.367150581696 \tabularnewline
-13.4192271963845 \tabularnewline
\hline
\end{tabular}
%Source: https://freestatistics.org/blog/index.php?pk=300588&T=2

[TABLE]
[ROW][C]Estimated ARIMA Residuals[/C][/ROW]
[ROW][C]Value[/C][/ROW]
[ROW][C]-6.6035087725837[/C][/ROW]
[ROW][C]60.2577454772137[/C][/ROW]
[ROW][C]45.2101179022948[/C][/ROW]
[ROW][C]67.0251699858676[/C][/ROW]
[ROW][C]71.7338648077441[/C][/ROW]
[ROW][C]-3.80632306818539[/C][/ROW]
[ROW][C]44.7664446935658[/C][/ROW]
[ROW][C]75.6743024200545[/C][/ROW]
[ROW][C]32.7666591566215[/C][/ROW]
[ROW][C]8.00363225158368[/C][/ROW]
[ROW][C]34.9569775941302[/C][/ROW]
[ROW][C]33.1309115015733[/C][/ROW]
[ROW][C]-60.6944567334932[/C][/ROW]
[ROW][C]-27.199822943423[/C][/ROW]
[ROW][C]-18.8236887486817[/C][/ROW]
[ROW][C]-6.02828251833757[/C][/ROW]
[ROW][C]22.9481744161398[/C][/ROW]
[ROW][C]-86.4209544040114[/C][/ROW]
[ROW][C]6.48932902344932[/C][/ROW]
[ROW][C]53.7461891621487[/C][/ROW]
[ROW][C]-118.67888344892[/C][/ROW]
[ROW][C]-21.4185481396897[/C][/ROW]
[ROW][C]27.4998234213628[/C][/ROW]
[ROW][C]-28.3835579573393[/C][/ROW]
[ROW][C]17.0142690487099[/C][/ROW]
[ROW][C]6.13877399033648[/C][/ROW]
[ROW][C]4.14309955809621[/C][/ROW]
[ROW][C]-33.1840270979293[/C][/ROW]
[ROW][C]34.9601307207876[/C][/ROW]
[ROW][C]-146.074148986867[/C][/ROW]
[ROW][C]19.0191483464247[/C][/ROW]
[ROW][C]20.8958347804864[/C][/ROW]
[ROW][C]-29.5306082356542[/C][/ROW]
[ROW][C]-20.3621610517927[/C][/ROW]
[ROW][C]96.1553423164242[/C][/ROW]
[ROW][C]133.571824646089[/C][/ROW]
[ROW][C]-145.97908011078[/C][/ROW]
[ROW][C]-107.078955140203[/C][/ROW]
[ROW][C]-111.56801026551[/C][/ROW]
[ROW][C]-19.1557651720504[/C][/ROW]
[ROW][C]-3.78622451817609[/C][/ROW]
[ROW][C]-77.2760261527027[/C][/ROW]
[ROW][C]85.5485309787238[/C][/ROW]
[ROW][C]-7.03624772744791[/C][/ROW]
[ROW][C]10.8372506207766[/C][/ROW]
[ROW][C]-82.4269013811841[/C][/ROW]
[ROW][C]114.141386954146[/C][/ROW]
[ROW][C]77.5753877501297[/C][/ROW]
[ROW][C]-23.0268262308419[/C][/ROW]
[ROW][C]-111.670089009968[/C][/ROW]
[ROW][C]-131.315647050188[/C][/ROW]
[ROW][C]43.36772180975[/C][/ROW]
[ROW][C]10.5269103132021[/C][/ROW]
[ROW][C]-44.7443465808762[/C][/ROW]
[ROW][C]19.4415138366313[/C][/ROW]
[ROW][C]-8.3883363935386[/C][/ROW]
[ROW][C]67.6486038346894[/C][/ROW]
[ROW][C]18.7634820641714[/C][/ROW]
[ROW][C]111.720851320506[/C][/ROW]
[ROW][C]-2.35039318889931[/C][/ROW]
[ROW][C]-63.6186787509122[/C][/ROW]
[ROW][C]-107.782976740471[/C][/ROW]
[ROW][C]67.5708337946594[/C][/ROW]
[ROW][C]-62.5016202269768[/C][/ROW]
[ROW][C]55.0320841461926[/C][/ROW]
[ROW][C]22.2442547435458[/C][/ROW]
[ROW][C]-21.1246610726143[/C][/ROW]
[ROW][C]44.22766130797[/C][/ROW]
[ROW][C]58.9222743163843[/C][/ROW]
[ROW][C]1.91754065365993[/C][/ROW]
[ROW][C]169.528779589979[/C][/ROW]
[ROW][C]36.7085788818127[/C][/ROW]
[ROW][C]7.41383032162172[/C][/ROW]
[ROW][C]-52.655502245146[/C][/ROW]
[ROW][C]104.390859800652[/C][/ROW]
[ROW][C]-77.879076575198[/C][/ROW]
[ROW][C]-4.38902020310264[/C][/ROW]
[ROW][C]-63.0525005012363[/C][/ROW]
[ROW][C]138.174774126005[/C][/ROW]
[ROW][C]118.550474898785[/C][/ROW]
[ROW][C]68.9806833977363[/C][/ROW]
[ROW][C]-26.5556539540884[/C][/ROW]
[ROW][C]31.6707389904506[/C][/ROW]
[ROW][C]-18.6420857347561[/C][/ROW]
[ROW][C]-64.9860847838605[/C][/ROW]
[ROW][C]-36.3312338939445[/C][/ROW]
[ROW][C]11.5625012851466[/C][/ROW]
[ROW][C]-39.7259826227563[/C][/ROW]
[ROW][C]159.830777828329[/C][/ROW]
[ROW][C]-55.0089515504203[/C][/ROW]
[ROW][C]34.5226619064711[/C][/ROW]
[ROW][C]162.19140487869[/C][/ROW]
[ROW][C]-32.5094406884325[/C][/ROW]
[ROW][C]69.9695574987626[/C][/ROW]
[ROW][C]21.4262665986732[/C][/ROW]
[ROW][C]46.3421911782516[/C][/ROW]
[ROW][C]-61.101009528074[/C][/ROW]
[ROW][C]-136.481267003704[/C][/ROW]
[ROW][C]-113.052585384078[/C][/ROW]
[ROW][C]-29.7916601303807[/C][/ROW]
[ROW][C]130.297300198934[/C][/ROW]
[ROW][C]-170.768254516053[/C][/ROW]
[ROW][C]17.1808871041576[/C][/ROW]
[ROW][C]37.0713775292058[/C][/ROW]
[ROW][C]-69.7844474416774[/C][/ROW]
[ROW][C]-1.40226335069824[/C][/ROW]
[ROW][C]72.2873094494751[/C][/ROW]
[ROW][C]-65.9090384731177[/C][/ROW]
[ROW][C]-24.9613088560438[/C][/ROW]
[ROW][C]-93.9387384194623[/C][/ROW]
[ROW][C]-70.9152492570377[/C][/ROW]
[ROW][C]-50.4455450850173[/C][/ROW]
[ROW][C]-25.7848433005912[/C][/ROW]
[ROW][C]-127.085445137377[/C][/ROW]
[ROW][C]111.367150581696[/C][/ROW]
[ROW][C]-13.4192271963845[/C][/ROW]
[/TABLE]
Source: https://freestatistics.org/blog/index.php?pk=300588&T=2

Globally Unique Identifier (entire table): ba.freestatistics.org/blog/index.php?pk=300588&T=2

As an alternative you can also use a QR Code:  

The GUIDs for individual cells are displayed in the table below:

Estimated ARIMA Residuals
Value
-6.6035087725837
60.2577454772137
45.2101179022948
67.0251699858676
71.7338648077441
-3.80632306818539
44.7664446935658
75.6743024200545
32.7666591566215
8.00363225158368
34.9569775941302
33.1309115015733
-60.6944567334932
-27.199822943423
-18.8236887486817
-6.02828251833757
22.9481744161398
-86.4209544040114
6.48932902344932
53.7461891621487
-118.67888344892
-21.4185481396897
27.4998234213628
-28.3835579573393
17.0142690487099
6.13877399033648
4.14309955809621
-33.1840270979293
34.9601307207876
-146.074148986867
19.0191483464247
20.8958347804864
-29.5306082356542
-20.3621610517927
96.1553423164242
133.571824646089
-145.97908011078
-107.078955140203
-111.56801026551
-19.1557651720504
-3.78622451817609
-77.2760261527027
85.5485309787238
-7.03624772744791
10.8372506207766
-82.4269013811841
114.141386954146
77.5753877501297
-23.0268262308419
-111.670089009968
-131.315647050188
43.36772180975
10.5269103132021
-44.7443465808762
19.4415138366313
-8.3883363935386
67.6486038346894
18.7634820641714
111.720851320506
-2.35039318889931
-63.6186787509122
-107.782976740471
67.5708337946594
-62.5016202269768
55.0320841461926
22.2442547435458
-21.1246610726143
44.22766130797
58.9222743163843
1.91754065365993
169.528779589979
36.7085788818127
7.41383032162172
-52.655502245146
104.390859800652
-77.879076575198
-4.38902020310264
-63.0525005012363
138.174774126005
118.550474898785
68.9806833977363
-26.5556539540884
31.6707389904506
-18.6420857347561
-64.9860847838605
-36.3312338939445
11.5625012851466
-39.7259826227563
159.830777828329
-55.0089515504203
34.5226619064711
162.19140487869
-32.5094406884325
69.9695574987626
21.4262665986732
46.3421911782516
-61.101009528074
-136.481267003704
-113.052585384078
-29.7916601303807
130.297300198934
-170.768254516053
17.1808871041576
37.0713775292058
-69.7844474416774
-1.40226335069824
72.2873094494751
-65.9090384731177
-24.9613088560438
-93.9387384194623
-70.9152492570377
-50.4455450850173
-25.7848433005912
-127.085445137377
111.367150581696
-13.4192271963845


Parameters (Session):
par1 = 12 ; par2 = 1 ; par3 = 0 ; par4 = 1 ; par5 = 1 ; par6 = 2 ; par7 = 1 ; par8 = 0 ; par9 = 0 ; par10 = FALSE ;
Parameters (R input):
par1 = 12 ; par2 = 1 ; par3 = 1 ; par4 = 1 ; par5 = 1 ; par6 = 3 ; par7 = 1 ; par8 = 2 ; par9 = 1 ;
R code (references can be found in the software module):
par9 <- '0'
par8 <- '0'
par7 <- '1'
par6 <- '2'
par5 <- '1'
par4 <- '1'
par3 <- '1'
par2 <- '1'
par1 <- '12'
library(lattice)
if (par1 == 'TRUE') par1 <- TRUE
if (par1 == 'FALSE') par1 <- FALSE
par2 <- as.numeric(par2) #Box-Cox lambda transformation parameter
par3 <- as.numeric(par3) #degree of non-seasonal differencing
par4 <- as.numeric(par4) #degree of seasonal differencing
par5 <- as.numeric(par5) #seasonal period
par6 <- as.numeric(par6) #degree (p) of the non-seasonal AR(p) polynomial
par7 <- as.numeric(par7) #degree (q) of the non-seasonal MA(q) polynomial
par8 <- as.numeric(par8) #degree (P) of the seasonal AR(P) polynomial
par9 <- as.numeric(par9) #degree (Q) of the seasonal MA(Q) polynomial
armaGR <- function(arima.out, names, n){
try1 <- arima.out$coef
try2 <- sqrt(diag(arima.out$var.coef))
try.data.frame <- data.frame(matrix(NA,ncol=4,nrow=length(names)))
dimnames(try.data.frame) <- list(names,c('coef','std','tstat','pv'))
try.data.frame[,1] <- try1
for(i in 1:length(try2)) try.data.frame[which(rownames(try.data.frame)==names(try2)[i]),2] <- try2[i]
try.data.frame[,3] <- try.data.frame[,1] / try.data.frame[,2]
try.data.frame[,4] <- round((1-pt(abs(try.data.frame[,3]),df=n-(length(try2)+1)))*2,5)
vector <- rep(NA,length(names))
vector[is.na(try.data.frame[,4])] <- 0
maxi <- which.max(try.data.frame[,4])
continue <- max(try.data.frame[,4],na.rm=TRUE) > .05
vector[maxi] <- 0
list(summary=try.data.frame,next.vector=vector,continue=continue)
}
arimaSelect <- function(series, order=c(13,0,0), seasonal=list(order=c(2,0,0),period=12), include.mean=F){
nrc <- order[1]+order[3]+seasonal$order[1]+seasonal$order[3]
coeff <- matrix(NA, nrow=nrc*2, ncol=nrc)
pval <- matrix(NA, nrow=nrc*2, ncol=nrc)
mylist <- rep(list(NULL), nrc)
names <- NULL
if(order[1] > 0) names <- paste('ar',1:order[1],sep='')
if(order[3] > 0) names <- c( names , paste('ma',1:order[3],sep='') )
if(seasonal$order[1] > 0) names <- c(names, paste('sar',1:seasonal$order[1],sep=''))
if(seasonal$order[3] > 0) names <- c(names, paste('sma',1:seasonal$order[3],sep=''))
arima.out <- arima(series, order=order, seasonal=seasonal, include.mean=include.mean, method='ML')
mylist[[1]] <- arima.out
last.arma <- armaGR(arima.out, names, length(series))
mystop <- FALSE
i <- 1
coeff[i,] <- last.arma[[1]][,1]
pval [i,] <- last.arma[[1]][,4]
i <- 2
aic <- arima.out$aic
while(!mystop){
mylist[[i]] <- arima.out
arima.out <- arima(series, order=order, seasonal=seasonal, include.mean=include.mean, method='ML', fixed=last.arma$next.vector)
aic <- c(aic, arima.out$aic)
last.arma <- armaGR(arima.out, names, length(series))
mystop <- !last.arma$continue
coeff[i,] <- last.arma[[1]][,1]
pval [i,] <- last.arma[[1]][,4]
i <- i+1
}
list(coeff, pval, mylist, aic=aic)
}
arimaSelectplot <- function(arimaSelect.out,noms,choix){
noms <- names(arimaSelect.out[[3]][[1]]$coef)
coeff <- arimaSelect.out[[1]]
k <- min(which(is.na(coeff[,1])))-1
coeff <- coeff[1:k,]
pval <- arimaSelect.out[[2]][1:k,]
aic <- arimaSelect.out$aic[1:k]
coeff[coeff==0] <- NA
n <- ncol(coeff)
if(missing(choix)) choix <- k
layout(matrix(c(1,1,1,2,
3,3,3,2,
3,3,3,4,
5,6,7,7),nr=4),
widths=c(10,35,45,15),
heights=c(30,30,15,15))
couleurs <- rainbow(75)[1:50]#(50)
ticks <- pretty(coeff)
par(mar=c(1,1,3,1))
plot(aic,k:1-.5,type='o',pch=21,bg='blue',cex=2,axes=F,lty=2,xpd=NA)
points(aic[choix],k-choix+.5,pch=21,cex=4,bg=2,xpd=NA)
title('aic',line=2)
par(mar=c(3,0,0,0))
plot(0,axes=F,xlab='',ylab='',xlim=range(ticks),ylim=c(.1,1))
rect(xleft = min(ticks) + (0:49)/50*(max(ticks)-min(ticks)),
xright = min(ticks) + (1:50)/50*(max(ticks)-min(ticks)),
ytop = rep(1,50),
ybottom= rep(0,50),col=couleurs,border=NA)
axis(1,ticks)
rect(xleft=min(ticks),xright=max(ticks),ytop=1,ybottom=0)
text(mean(coeff,na.rm=T),.5,'coefficients',cex=2,font=2)
par(mar=c(1,1,3,1))
image(1:n,1:k,t(coeff[k:1,]),axes=F,col=couleurs,zlim=range(ticks))
for(i in 1:n) for(j in 1:k) if(!is.na(coeff[j,i])) {
if(pval[j,i]<.01) symb = 'green'
else if( (pval[j,i]<.05) & (pval[j,i]>=.01)) symb = 'orange'
else if( (pval[j,i]<.1) & (pval[j,i]>=.05)) symb = 'red'
else symb = 'black'
polygon(c(i+.5 ,i+.2 ,i+.5 ,i+.5),
c(k-j+0.5,k-j+0.5,k-j+0.8,k-j+0.5),
col=symb)
if(j==choix) {
rect(xleft=i-.5,
xright=i+.5,
ybottom=k-j+1.5,
ytop=k-j+.5,
lwd=4)
text(i,
k-j+1,
round(coeff[j,i],2),
cex=1.2,
font=2)
}
else{
rect(xleft=i-.5,xright=i+.5,ybottom=k-j+1.5,ytop=k-j+.5)
text(i,k-j+1,round(coeff[j,i],2),cex=1.2,font=1)
}
}
axis(3,1:n,noms)
par(mar=c(0.5,0,0,0.5))
plot(0,axes=F,xlab='',ylab='',type='n',xlim=c(0,8),ylim=c(-.2,.8))
cols <- c('green','orange','red','black')
niv <- c('0','0.01','0.05','0.1')
for(i in 0:3){
polygon(c(1+2*i ,1+2*i ,1+2*i-.5 ,1+2*i),
c(.4 ,.7 , .4 , .4),
col=cols[i+1])
text(2*i,0.5,niv[i+1],cex=1.5)
}
text(8,.5,1,cex=1.5)
text(4,0,'p-value',cex=2)
box()
residus <- arimaSelect.out[[3]][[choix]]$res
par(mar=c(1,2,4,1))
acf(residus,main='')
title('acf',line=.5)
par(mar=c(1,2,4,1))
pacf(residus,main='')
title('pacf',line=.5)
par(mar=c(2,2,4,1))
qqnorm(residus,main='')
title('qq-norm',line=.5)
qqline(residus)
residus
}
if (par2 == 0) x <- log(x)
if (par2 != 0) x <- x^par2
(selection <- arimaSelect(x, order=c(par6,par3,par7), seasonal=list(order=c(par8,par4,par9), period=par5)))
bitmap(file='test1.png')
resid <- arimaSelectplot(selection)
dev.off()
resid
bitmap(file='test2.png')
acf(resid,length(resid)/2, main='Residual Autocorrelation Function')
dev.off()
bitmap(file='test3.png')
pacf(resid,length(resid)/2, main='Residual Partial Autocorrelation Function')
dev.off()
bitmap(file='test4.png')
cpgram(resid, main='Residual Cumulative Periodogram')
dev.off()
bitmap(file='test5.png')
hist(resid, main='Residual Histogram', xlab='values of Residuals')
dev.off()
bitmap(file='test6.png')
densityplot(~resid,col='black',main='Residual Density Plot', xlab='values of Residuals')
dev.off()
bitmap(file='test7.png')
qqnorm(resid, main='Residual Normal Q-Q Plot')
qqline(resid)
dev.off()
ncols <- length(selection[[1]][1,])
nrows <- length(selection[[2]][,1])-1
load(file='createtable')
a<-table.start()
a<-table.row.start(a)
a<-table.element(a,'ARIMA Parameter Estimation and Backward Selection', ncols+1,TRUE)
a<-table.row.end(a)
a<-table.row.start(a)
a<-table.element(a,'Iteration', header=TRUE)
for (i in 1:ncols) {
a<-table.element(a,names(selection[[3]][[1]]$coef)[i],header=TRUE)
}
a<-table.row.end(a)
for (j in 1:nrows) {
a<-table.row.start(a)
mydum <- 'Estimates ('
mydum <- paste(mydum,j)
mydum <- paste(mydum,')')
a<-table.element(a,mydum, header=TRUE)
for (i in 1:ncols) {
a<-table.element(a,round(selection[[1]][j,i],4))
}
a<-table.row.end(a)
a<-table.row.start(a)
a<-table.element(a,'(p-val)', header=TRUE)
for (i in 1:ncols) {
mydum <- '('
mydum <- paste(mydum,round(selection[[2]][j,i],4),sep='')
mydum <- paste(mydum,')')
a<-table.element(a,mydum)
}
a<-table.row.end(a)
}
a<-table.end(a)
table.save(a,file='mytable.tab')
a<-table.start()
a<-table.row.start(a)
a<-table.element(a,'Estimated ARIMA Residuals', 1,TRUE)
a<-table.row.end(a)
a<-table.row.start(a)
a<-table.element(a,'Value', 1,TRUE)
a<-table.row.end(a)
for (i in (par4*par5+par3):length(resid)) {
a<-table.row.start(a)
a<-table.element(a,resid[i])
a<-table.row.end(a)
}
a<-table.end(a)
table.save(a,file='mytable1.tab')