Free Statistics
of Irreproducible Research!
Description of Statistical Computation | ||||||||||||||||||||||||||||||||||||||||||||||||||||||||||||||||||||||||||||||||||||||||||||||||||||||||||||||||||||||||||||||||||||||||||||||||||||||
|---|---|---|---|---|---|---|---|---|---|---|---|---|---|---|---|---|---|---|---|---|---|---|---|---|---|---|---|---|---|---|---|---|---|---|---|---|---|---|---|---|---|---|---|---|---|---|---|---|---|---|---|---|---|---|---|---|---|---|---|---|---|---|---|---|---|---|---|---|---|---|---|---|---|---|---|---|---|---|---|---|---|---|---|---|---|---|---|---|---|---|---|---|---|---|---|---|---|---|---|---|---|---|---|---|---|---|---|---|---|---|---|---|---|---|---|---|---|---|---|---|---|---|---|---|---|---|---|---|---|---|---|---|---|---|---|---|---|---|---|---|---|---|---|---|---|---|---|---|---|---|
| Author's title | ||||||||||||||||||||||||||||||||||||||||||||||||||||||||||||||||||||||||||||||||||||||||||||||||||||||||||||||||||||||||||||||||||||||||||||||||||||||
| Author | *The author of this computation has been verified* | |||||||||||||||||||||||||||||||||||||||||||||||||||||||||||||||||||||||||||||||||||||||||||||||||||||||||||||||||||||||||||||||||||||||||||||||||||||
| R Software Module | rwasp_notchedbox1.wasp | |||||||||||||||||||||||||||||||||||||||||||||||||||||||||||||||||||||||||||||||||||||||||||||||||||||||||||||||||||||||||||||||||||||||||||||||||||||
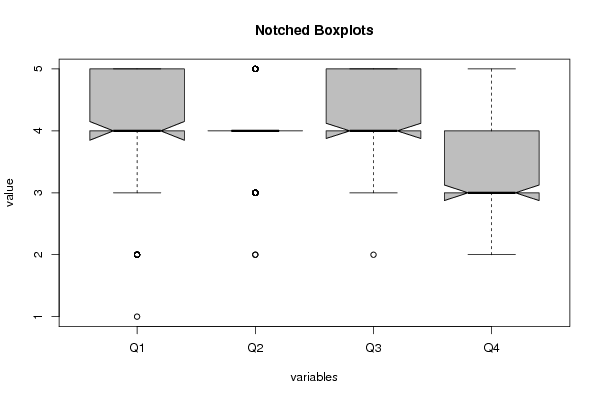
| Title produced by software | Notched Boxplots | |||||||||||||||||||||||||||||||||||||||||||||||||||||||||||||||||||||||||||||||||||||||||||||||||||||||||||||||||||||||||||||||||||||||||||||||||||||
| Date of computation | Sat, 17 Dec 2016 08:57:17 +0100 | |||||||||||||||||||||||||||||||||||||||||||||||||||||||||||||||||||||||||||||||||||||||||||||||||||||||||||||||||||||||||||||||||||||||||||||||||||||
| Cite this page as follows | Statistical Computations at FreeStatistics.org, Office for Research Development and Education, URL https://freestatistics.org/blog/index.php?v=date/2016/Dec/17/t1481961470ueioat1dd8sv76j.htm/, Retrieved Wed, 01 May 2024 23:50:38 +0000 | |||||||||||||||||||||||||||||||||||||||||||||||||||||||||||||||||||||||||||||||||||||||||||||||||||||||||||||||||||||||||||||||||||||||||||||||||||||
| Statistical Computations at FreeStatistics.org, Office for Research Development and Education, URL https://freestatistics.org/blog/index.php?pk=300605, Retrieved Wed, 01 May 2024 23:50:38 +0000 | ||||||||||||||||||||||||||||||||||||||||||||||||||||||||||||||||||||||||||||||||||||||||||||||||||||||||||||||||||||||||||||||||||||||||||||||||||||||
| QR Codes: | ||||||||||||||||||||||||||||||||||||||||||||||||||||||||||||||||||||||||||||||||||||||||||||||||||||||||||||||||||||||||||||||||||||||||||||||||||||||
|
| ||||||||||||||||||||||||||||||||||||||||||||||||||||||||||||||||||||||||||||||||||||||||||||||||||||||||||||||||||||||||||||||||||||||||||||||||||||||
| Original text written by user: | ||||||||||||||||||||||||||||||||||||||||||||||||||||||||||||||||||||||||||||||||||||||||||||||||||||||||||||||||||||||||||||||||||||||||||||||||||||||
| IsPrivate? | No (this computation is public) | |||||||||||||||||||||||||||||||||||||||||||||||||||||||||||||||||||||||||||||||||||||||||||||||||||||||||||||||||||||||||||||||||||||||||||||||||||||
| User-defined keywords | ||||||||||||||||||||||||||||||||||||||||||||||||||||||||||||||||||||||||||||||||||||||||||||||||||||||||||||||||||||||||||||||||||||||||||||||||||||||
| Estimated Impact | 107 | |||||||||||||||||||||||||||||||||||||||||||||||||||||||||||||||||||||||||||||||||||||||||||||||||||||||||||||||||||||||||||||||||||||||||||||||||||||
Tree of Dependent Computations | ||||||||||||||||||||||||||||||||||||||||||||||||||||||||||||||||||||||||||||||||||||||||||||||||||||||||||||||||||||||||||||||||||||||||||||||||||||||
| Family? (F = Feedback message, R = changed R code, M = changed R Module, P = changed Parameters, D = changed Data) | ||||||||||||||||||||||||||||||||||||||||||||||||||||||||||||||||||||||||||||||||||||||||||||||||||||||||||||||||||||||||||||||||||||||||||||||||||||||
| - [Notched Boxplots] [Notched boxplot TVDC] [2016-12-17 07:57:17] [5f1120677e74ff8306822a772764e796] [Current] | ||||||||||||||||||||||||||||||||||||||||||||||||||||||||||||||||||||||||||||||||||||||||||||||||||||||||||||||||||||||||||||||||||||||||||||||||||||||
| Feedback Forum | ||||||||||||||||||||||||||||||||||||||||||||||||||||||||||||||||||||||||||||||||||||||||||||||||||||||||||||||||||||||||||||||||||||||||||||||||||||||
Post a new message | ||||||||||||||||||||||||||||||||||||||||||||||||||||||||||||||||||||||||||||||||||||||||||||||||||||||||||||||||||||||||||||||||||||||||||||||||||||||
Dataset | ||||||||||||||||||||||||||||||||||||||||||||||||||||||||||||||||||||||||||||||||||||||||||||||||||||||||||||||||||||||||||||||||||||||||||||||||||||||
| Dataseries X: | ||||||||||||||||||||||||||||||||||||||||||||||||||||||||||||||||||||||||||||||||||||||||||||||||||||||||||||||||||||||||||||||||||||||||||||||||||||||
4 3 3 3 5 4 4 3 4 5 5 3 NA 4 4 3 NA 4 4 4 5 3 5 3 5 3 5 NA NA 4 5 3 NA 4 5 4 5 4 5 3 5 4 5 3 4 4 4 3 4 4 4 4 4 3 4 3 4 4 4 4 5 4 5 3 NA 4 4 4 NA NA NA NA 3 4 4 NA NA 4 5 4 5 4 4 3 NA 4 4 3 5 4 4 3 NA 4 4 3 NA 4 5 4 NA 3 5 3 4 4 4 4 4 4 4 3 4 4 5 3 4 4 5 3 3 4 3 3 4 3 5 3 5 4 4 4 NA 4 5 2 4 2 4 3 5 4 5 3 NA 4 4 3 3 3 4 4 2 4 4 4 5 4 5 4 NA 4 4 3 5 4 5 3 4 3 3 3 4 4 5 3 4 4 4 3 3 4 5 3 NA 4 5 3 4 4 4 3 3 4 3 3 NA 3 NA NA 5 4 5 3 NA 5 5 3 NA 5 4 4 2 3 3 3 3 4 4 3 2 4 4 3 NA 4 4 3 5 5 4 3 4 4 4 4 NA 4 4 3 5 4 5 3 5 4 4 3 4 5 4 3 5 4 4 3 4 4 4 3 4 2 4 2 5 4 5 3 3 4 4 3 2 4 4 4 5 4 4 3 NA 4 4 3 NA 4 4 3 NA 4 3 3 NA 3 4 3 NA 5 4 4 4 4 4 3 5 3 5 3 3 4 4 3 2 4 4 5 5 4 5 3 NA 4 5 3 1 3 3 3 NA 4 5 3 5 4 4 4 NA 4 5 4 5 5 5 5 4 4 5 4 5 4 5 4 NA 4 4 3 5 4 4 4 5 4 2 3 NA 4 4 3 4 5 5 3 NA 4 5 3 4 5 5 3 NA 4 4 3 4 4 4 4 4 5 4 5 5 4 5 4 5 4 4 3 NA 4 NA NA NA 4 5 4 4 4 4 3 2 4 4 3 NA 4 4 3 NA 4 5 4 NA 4 4 4 NA 4 5 3 NA 4 4 3 4 4 4 4 NA 4 4 4 NA 4 3 3 NA 4 4 3 3 3 3 3 5 4 5 NA 4 4 4 4 5 4 4 3 NA 4 5 4 5 4 4 3 3 4 4 3 4 4 4 3 3 4 4 3 NA 4 4 4 4 4 4 3 NA 4 5 4 4 4 4 3 5 4 4 3 NA 4 5 3 NA 4 4 3 NA 4 4 3 2 3 3 3 4 4 4 NA 4 5 4 5 NA 3 4 3 2 3 3 3 NA 4 4 NA 4 4 5 5 NA NA 3 NA 4 4 4 3 5 5 5 4 4 5 5 3 NA 3 4 3 3 4 4 3 4 4 4 NA 3 4 3 3 4 5 5 3 2 4 4 4 5 5 5 4 4 3 4 3 NA 4 4 4 NA 3 3 3 4 4 4 4 5 4 4 3 4 4 4 3 2 4 3 3 NA 4 4 3 5 4 5 3 NA 4 3 3 NA 4 4 3 5 4 5 4 4 4 4 3 5 5 5 3 3 4 4 4 NA 4 4 3 4 NA 4 4 NA 3 4 3 4 4 4 4 NA 4 3 3 3 4 4 5 | ||||||||||||||||||||||||||||||||||||||||||||||||||||||||||||||||||||||||||||||||||||||||||||||||||||||||||||||||||||||||||||||||||||||||||||||||||||||
Tables (Output of Computation) | ||||||||||||||||||||||||||||||||||||||||||||||||||||||||||||||||||||||||||||||||||||||||||||||||||||||||||||||||||||||||||||||||||||||||||||||||||||||
| ||||||||||||||||||||||||||||||||||||||||||||||||||||||||||||||||||||||||||||||||||||||||||||||||||||||||||||||||||||||||||||||||||||||||||||||||||||||
Figures (Output of Computation) | ||||||||||||||||||||||||||||||||||||||||||||||||||||||||||||||||||||||||||||||||||||||||||||||||||||||||||||||||||||||||||||||||||||||||||||||||||||||
Input Parameters & R Code | ||||||||||||||||||||||||||||||||||||||||||||||||||||||||||||||||||||||||||||||||||||||||||||||||||||||||||||||||||||||||||||||||||||||||||||||||||||||
| Parameters (Session): | ||||||||||||||||||||||||||||||||||||||||||||||||||||||||||||||||||||||||||||||||||||||||||||||||||||||||||||||||||||||||||||||||||||||||||||||||||||||
| par1 = grey ; par2 = no ; | ||||||||||||||||||||||||||||||||||||||||||||||||||||||||||||||||||||||||||||||||||||||||||||||||||||||||||||||||||||||||||||||||||||||||||||||||||||||
| Parameters (R input): | ||||||||||||||||||||||||||||||||||||||||||||||||||||||||||||||||||||||||||||||||||||||||||||||||||||||||||||||||||||||||||||||||||||||||||||||||||||||
| par1 = grey ; par2 = no ; | ||||||||||||||||||||||||||||||||||||||||||||||||||||||||||||||||||||||||||||||||||||||||||||||||||||||||||||||||||||||||||||||||||||||||||||||||||||||
| R code (references can be found in the software module): | ||||||||||||||||||||||||||||||||||||||||||||||||||||||||||||||||||||||||||||||||||||||||||||||||||||||||||||||||||||||||||||||||||||||||||||||||||||||
if(par2=='yes') { | ||||||||||||||||||||||||||||||||||||||||||||||||||||||||||||||||||||||||||||||||||||||||||||||||||||||||||||||||||||||||||||||||||||||||||||||||||||||