Free Statistics

of Irreproducible Research!

Author's title

Author*The author of this computation has been verified*
R Software Modulerwasp_exponentialsmoothing.wasp
Title produced by softwareExponential Smoothing
Date of computationSat, 17 Dec 2016 10:40:21 +0100
Cite this page as followsStatistical Computations at FreeStatistics.org, Office for Research Development and Education, URL https://freestatistics.org/blog/index.php?v=date/2016/Dec/17/t1481967641fxzol02lic7ch2q.htm/, Retrieved Thu, 02 May 2024 00:24:28 +0000
Statistical Computations at FreeStatistics.org, Office for Research Development and Education, URL https://freestatistics.org/blog/index.php?pk=300642, Retrieved Thu, 02 May 2024 00:24:28 +0000
QR Codes:

Original text written by user:
IsPrivate?No (this computation is public)
User-defined keywords
Estimated Impact78
Family? (F = Feedback message, R = changed R code, M = changed R Module, P = changed Parameters, D = changed Data)
-       [Exponential Smoothing] [] [2016-12-17 09:40:21] [57f1f1af0ba442a9c0352eeef9ded060] [Current]
Feedback Forum

Post a new message
Dataseries X:
4304
4380
4465
4528
4557.5
4557.5
4588.5
4627.5
4711
4776.5
4781.5
4603
4770.5
4792
4803.5
4747.5
4838
4854
4902.5
4953.5
4969.5
4971
4998.5
5080
5111
5110.5
5096
4939.5
5108
5137.5
5185.5
5103
5168
5208
5250.5
5204.5
5293.5
5339.5
5484
5533
5513
5595.5
5605
5919.5


Summary of computational transaction
Raw Input view raw input (R code)
Raw Outputview raw output of R engine
Computing time1 seconds
R ServerBig Analytics Cloud Computing Center

\begin{tabular}{lllllllll}
\hline
Summary of computational transaction \tabularnewline
Raw Input view raw input (R code)  \tabularnewline
Raw Outputview raw output of R engine  \tabularnewline
Computing time1 seconds \tabularnewline
R ServerBig Analytics Cloud Computing Center \tabularnewline
\hline
\end{tabular}
%Source: https://freestatistics.org/blog/index.php?pk=300642&T=0

[TABLE]
[ROW]
Summary of computational transaction[/C][/ROW] [ROW]Raw Input[/C] view raw input (R code) [/C][/ROW] [ROW]Raw Output[/C]view raw output of R engine [/C][/ROW] [ROW]Computing time[/C]1 seconds[/C][/ROW] [ROW]R Server[/C]Big Analytics Cloud Computing Center[/C][/ROW] [/TABLE] Source: https://freestatistics.org/blog/index.php?pk=300642&T=0

Globally Unique Identifier (entire table): ba.freestatistics.org/blog/index.php?pk=300642&T=0

As an alternative you can also use a QR Code:  

The GUIDs for individual cells are displayed in the table below:

Summary of computational transaction
Raw Input view raw input (R code)
Raw Outputview raw output of R engine
Computing time1 seconds
R ServerBig Analytics Cloud Computing Center


Estimated Parameters of Exponential Smoothing
ParameterValue
alpha0.228662049546275
beta0.914718927347398
gammaFALSE

\begin{tabular}{lllllllll}
\hline
Estimated Parameters of Exponential Smoothing \tabularnewline
Parameter & Value \tabularnewline
alpha & 0.228662049546275 \tabularnewline
beta & 0.914718927347398 \tabularnewline
gamma & FALSE \tabularnewline
\hline
\end{tabular}
%Source: https://freestatistics.org/blog/index.php?pk=300642&T=1

[TABLE]
[ROW][C]Estimated Parameters of Exponential Smoothing[/C][/ROW]
[ROW][C]Parameter[/C][C]Value[/C][/ROW]
[ROW][C]alpha[/C][C]0.228662049546275[/C][/ROW]
[ROW][C]beta[/C][C]0.914718927347398[/C][/ROW]
[ROW][C]gamma[/C][C]FALSE[/C][/ROW]
[/TABLE]
Source: https://freestatistics.org/blog/index.php?pk=300642&T=1

Globally Unique Identifier (entire table): ba.freestatistics.org/blog/index.php?pk=300642&T=1

As an alternative you can also use a QR Code:  

The GUIDs for individual cells are displayed in the table below:

Estimated Parameters of Exponential Smoothing
ParameterValue
alpha0.228662049546275
beta0.914718927347398
gammaFALSE


Interpolation Forecasts of Exponential Smoothing
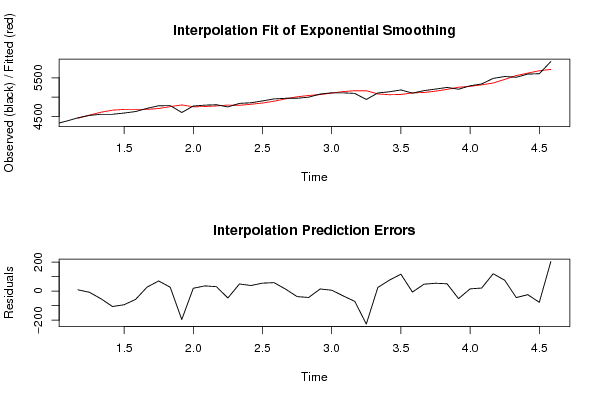
tObservedFittedResiduals
3446544569
445284535.94041198809-7.940411988091
54557.54610.34636613157-52.8463661315709
64557.54663.4306073065-105.930607306503
74588.54682.21989187923-93.7198918792337
84627.54684.19871006352-56.6987100635188
947114682.7836800477728.216319952232
104776.54706.6872627706169.8127372293866
114781.54754.7045046869826.7954953130156
1246034798.48992201941-195.489922019408
134770.54750.5581339998219.9418660001829
1447924756.0584908650535.941509134951
154803.54772.7349390528430.7650609471611
164747.54794.6625964281-47.1625964281047
1748384788.906556317849.0934436821999
1848544815.4290781711138.5709218288857
194902.54847.6130506579154.8869493420898
204953.54895.0081163483558.4918836516536
214969.54955.4617441029914.0382558970141
2249715008.68677695207-37.6867769520686
234998.55042.20163480297-43.7016348029701
2450805065.2004232373314.7995767626726
2551115104.671720353626.32827964637909
265110.55143.5295858019-33.0295858018981
2750965166.47928320553-70.4792832055255
284939.55166.12410312149-226.624103121491
2951085082.6634900824325.3365099175744
305137.55062.1161297636675.38387023634
315185.55068.78010515745116.719894842546
3251035109.30936948986-6.30936948985982
3351685120.3868328697347.6131671302719
3452085153.7531756697354.2468243302746
355250.55199.9827315224250.5172684775789
365204.55255.92574737734-51.4257473773396
375293.55277.801977588915.6980224111048
385339.55318.3102885616521.1897114383491
3954845364.50641233115119.493587668845
4055335458.1743605150174.8256394849859
4155135557.2790874619-44.2790874618986
425595.55619.8876028748-24.3876028748027
4356055681.94359820893-76.9435982089317
445919.55715.88839315668203.611606843323

\begin{tabular}{lllllllll}
\hline
Interpolation Forecasts of Exponential Smoothing \tabularnewline
t & Observed & Fitted & Residuals \tabularnewline
3 & 4465 & 4456 & 9 \tabularnewline
4 & 4528 & 4535.94041198809 & -7.940411988091 \tabularnewline
5 & 4557.5 & 4610.34636613157 & -52.8463661315709 \tabularnewline
6 & 4557.5 & 4663.4306073065 & -105.930607306503 \tabularnewline
7 & 4588.5 & 4682.21989187923 & -93.7198918792337 \tabularnewline
8 & 4627.5 & 4684.19871006352 & -56.6987100635188 \tabularnewline
9 & 4711 & 4682.78368004777 & 28.216319952232 \tabularnewline
10 & 4776.5 & 4706.68726277061 & 69.8127372293866 \tabularnewline
11 & 4781.5 & 4754.70450468698 & 26.7954953130156 \tabularnewline
12 & 4603 & 4798.48992201941 & -195.489922019408 \tabularnewline
13 & 4770.5 & 4750.55813399982 & 19.9418660001829 \tabularnewline
14 & 4792 & 4756.05849086505 & 35.941509134951 \tabularnewline
15 & 4803.5 & 4772.73493905284 & 30.7650609471611 \tabularnewline
16 & 4747.5 & 4794.6625964281 & -47.1625964281047 \tabularnewline
17 & 4838 & 4788.9065563178 & 49.0934436821999 \tabularnewline
18 & 4854 & 4815.42907817111 & 38.5709218288857 \tabularnewline
19 & 4902.5 & 4847.61305065791 & 54.8869493420898 \tabularnewline
20 & 4953.5 & 4895.00811634835 & 58.4918836516536 \tabularnewline
21 & 4969.5 & 4955.46174410299 & 14.0382558970141 \tabularnewline
22 & 4971 & 5008.68677695207 & -37.6867769520686 \tabularnewline
23 & 4998.5 & 5042.20163480297 & -43.7016348029701 \tabularnewline
24 & 5080 & 5065.20042323733 & 14.7995767626726 \tabularnewline
25 & 5111 & 5104.67172035362 & 6.32827964637909 \tabularnewline
26 & 5110.5 & 5143.5295858019 & -33.0295858018981 \tabularnewline
27 & 5096 & 5166.47928320553 & -70.4792832055255 \tabularnewline
28 & 4939.5 & 5166.12410312149 & -226.624103121491 \tabularnewline
29 & 5108 & 5082.66349008243 & 25.3365099175744 \tabularnewline
30 & 5137.5 & 5062.11612976366 & 75.38387023634 \tabularnewline
31 & 5185.5 & 5068.78010515745 & 116.719894842546 \tabularnewline
32 & 5103 & 5109.30936948986 & -6.30936948985982 \tabularnewline
33 & 5168 & 5120.38683286973 & 47.6131671302719 \tabularnewline
34 & 5208 & 5153.75317566973 & 54.2468243302746 \tabularnewline
35 & 5250.5 & 5199.98273152242 & 50.5172684775789 \tabularnewline
36 & 5204.5 & 5255.92574737734 & -51.4257473773396 \tabularnewline
37 & 5293.5 & 5277.8019775889 & 15.6980224111048 \tabularnewline
38 & 5339.5 & 5318.31028856165 & 21.1897114383491 \tabularnewline
39 & 5484 & 5364.50641233115 & 119.493587668845 \tabularnewline
40 & 5533 & 5458.17436051501 & 74.8256394849859 \tabularnewline
41 & 5513 & 5557.2790874619 & -44.2790874618986 \tabularnewline
42 & 5595.5 & 5619.8876028748 & -24.3876028748027 \tabularnewline
43 & 5605 & 5681.94359820893 & -76.9435982089317 \tabularnewline
44 & 5919.5 & 5715.88839315668 & 203.611606843323 \tabularnewline
\hline
\end{tabular}
%Source: https://freestatistics.org/blog/index.php?pk=300642&T=2

[TABLE]
[ROW][C]Interpolation Forecasts of Exponential Smoothing[/C][/ROW]
[ROW][C]t[/C][C]Observed[/C][C]Fitted[/C][C]Residuals[/C][/ROW]
[ROW][C]3[/C][C]4465[/C][C]4456[/C][C]9[/C][/ROW]
[ROW][C]4[/C][C]4528[/C][C]4535.94041198809[/C][C]-7.940411988091[/C][/ROW]
[ROW][C]5[/C][C]4557.5[/C][C]4610.34636613157[/C][C]-52.8463661315709[/C][/ROW]
[ROW][C]6[/C][C]4557.5[/C][C]4663.4306073065[/C][C]-105.930607306503[/C][/ROW]
[ROW][C]7[/C][C]4588.5[/C][C]4682.21989187923[/C][C]-93.7198918792337[/C][/ROW]
[ROW][C]8[/C][C]4627.5[/C][C]4684.19871006352[/C][C]-56.6987100635188[/C][/ROW]
[ROW][C]9[/C][C]4711[/C][C]4682.78368004777[/C][C]28.216319952232[/C][/ROW]
[ROW][C]10[/C][C]4776.5[/C][C]4706.68726277061[/C][C]69.8127372293866[/C][/ROW]
[ROW][C]11[/C][C]4781.5[/C][C]4754.70450468698[/C][C]26.7954953130156[/C][/ROW]
[ROW][C]12[/C][C]4603[/C][C]4798.48992201941[/C][C]-195.489922019408[/C][/ROW]
[ROW][C]13[/C][C]4770.5[/C][C]4750.55813399982[/C][C]19.9418660001829[/C][/ROW]
[ROW][C]14[/C][C]4792[/C][C]4756.05849086505[/C][C]35.941509134951[/C][/ROW]
[ROW][C]15[/C][C]4803.5[/C][C]4772.73493905284[/C][C]30.7650609471611[/C][/ROW]
[ROW][C]16[/C][C]4747.5[/C][C]4794.6625964281[/C][C]-47.1625964281047[/C][/ROW]
[ROW][C]17[/C][C]4838[/C][C]4788.9065563178[/C][C]49.0934436821999[/C][/ROW]
[ROW][C]18[/C][C]4854[/C][C]4815.42907817111[/C][C]38.5709218288857[/C][/ROW]
[ROW][C]19[/C][C]4902.5[/C][C]4847.61305065791[/C][C]54.8869493420898[/C][/ROW]
[ROW][C]20[/C][C]4953.5[/C][C]4895.00811634835[/C][C]58.4918836516536[/C][/ROW]
[ROW][C]21[/C][C]4969.5[/C][C]4955.46174410299[/C][C]14.0382558970141[/C][/ROW]
[ROW][C]22[/C][C]4971[/C][C]5008.68677695207[/C][C]-37.6867769520686[/C][/ROW]
[ROW][C]23[/C][C]4998.5[/C][C]5042.20163480297[/C][C]-43.7016348029701[/C][/ROW]
[ROW][C]24[/C][C]5080[/C][C]5065.20042323733[/C][C]14.7995767626726[/C][/ROW]
[ROW][C]25[/C][C]5111[/C][C]5104.67172035362[/C][C]6.32827964637909[/C][/ROW]
[ROW][C]26[/C][C]5110.5[/C][C]5143.5295858019[/C][C]-33.0295858018981[/C][/ROW]
[ROW][C]27[/C][C]5096[/C][C]5166.47928320553[/C][C]-70.4792832055255[/C][/ROW]
[ROW][C]28[/C][C]4939.5[/C][C]5166.12410312149[/C][C]-226.624103121491[/C][/ROW]
[ROW][C]29[/C][C]5108[/C][C]5082.66349008243[/C][C]25.3365099175744[/C][/ROW]
[ROW][C]30[/C][C]5137.5[/C][C]5062.11612976366[/C][C]75.38387023634[/C][/ROW]
[ROW][C]31[/C][C]5185.5[/C][C]5068.78010515745[/C][C]116.719894842546[/C][/ROW]
[ROW][C]32[/C][C]5103[/C][C]5109.30936948986[/C][C]-6.30936948985982[/C][/ROW]
[ROW][C]33[/C][C]5168[/C][C]5120.38683286973[/C][C]47.6131671302719[/C][/ROW]
[ROW][C]34[/C][C]5208[/C][C]5153.75317566973[/C][C]54.2468243302746[/C][/ROW]
[ROW][C]35[/C][C]5250.5[/C][C]5199.98273152242[/C][C]50.5172684775789[/C][/ROW]
[ROW][C]36[/C][C]5204.5[/C][C]5255.92574737734[/C][C]-51.4257473773396[/C][/ROW]
[ROW][C]37[/C][C]5293.5[/C][C]5277.8019775889[/C][C]15.6980224111048[/C][/ROW]
[ROW][C]38[/C][C]5339.5[/C][C]5318.31028856165[/C][C]21.1897114383491[/C][/ROW]
[ROW][C]39[/C][C]5484[/C][C]5364.50641233115[/C][C]119.493587668845[/C][/ROW]
[ROW][C]40[/C][C]5533[/C][C]5458.17436051501[/C][C]74.8256394849859[/C][/ROW]
[ROW][C]41[/C][C]5513[/C][C]5557.2790874619[/C][C]-44.2790874618986[/C][/ROW]
[ROW][C]42[/C][C]5595.5[/C][C]5619.8876028748[/C][C]-24.3876028748027[/C][/ROW]
[ROW][C]43[/C][C]5605[/C][C]5681.94359820893[/C][C]-76.9435982089317[/C][/ROW]
[ROW][C]44[/C][C]5919.5[/C][C]5715.88839315668[/C][C]203.611606843323[/C][/ROW]
[/TABLE]
Source: https://freestatistics.org/blog/index.php?pk=300642&T=2

Globally Unique Identifier (entire table): ba.freestatistics.org/blog/index.php?pk=300642&T=2

As an alternative you can also use a QR Code:  

The GUIDs for individual cells are displayed in the table below:

Interpolation Forecasts of Exponential Smoothing
tObservedFittedResiduals
3446544569
445284535.94041198809-7.940411988091
54557.54610.34636613157-52.8463661315709
64557.54663.4306073065-105.930607306503
74588.54682.21989187923-93.7198918792337
84627.54684.19871006352-56.6987100635188
947114682.7836800477728.216319952232
104776.54706.6872627706169.8127372293866
114781.54754.7045046869826.7954953130156
1246034798.48992201941-195.489922019408
134770.54750.5581339998219.9418660001829
1447924756.0584908650535.941509134951
154803.54772.7349390528430.7650609471611
164747.54794.6625964281-47.1625964281047
1748384788.906556317849.0934436821999
1848544815.4290781711138.5709218288857
194902.54847.6130506579154.8869493420898
204953.54895.0081163483558.4918836516536
214969.54955.4617441029914.0382558970141
2249715008.68677695207-37.6867769520686
234998.55042.20163480297-43.7016348029701
2450805065.2004232373314.7995767626726
2551115104.671720353626.32827964637909
265110.55143.5295858019-33.0295858018981
2750965166.47928320553-70.4792832055255
284939.55166.12410312149-226.624103121491
2951085082.6634900824325.3365099175744
305137.55062.1161297636675.38387023634
315185.55068.78010515745116.719894842546
3251035109.30936948986-6.30936948985982
3351685120.3868328697347.6131671302719
3452085153.7531756697354.2468243302746
355250.55199.9827315224250.5172684775789
365204.55255.92574737734-51.4257473773396
375293.55277.801977588915.6980224111048
385339.55318.3102885616521.1897114383491
3954845364.50641233115119.493587668845
4055335458.1743605150174.8256394849859
4155135557.2790874619-44.2790874618986
425595.55619.8876028748-24.3876028748027
4356055681.94359820893-76.9435982089317
445919.55715.88839315668203.611606843323


Extrapolation Forecasts of Exponential Smoothing
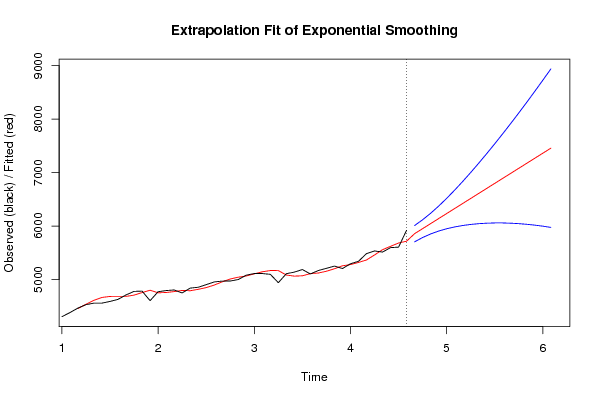
tForecast95% Lower Bound95% Upper Bound
455856.573226361445704.176809933466008.96964278941
465950.699812233995784.336980250286117.0626442177
476044.826398106545851.440261610956238.21253460214
486138.95298397915905.668659837526372.23730812068
496233.079569851655948.863425779746517.29571392357
506327.206155724215982.964946464796671.44736498363
516421.332741596766009.47931248036833.18617071322
526515.459327469326029.481326218377001.43732872027
536609.585913341876043.734155009377175.43767167437
546703.712499214426052.793055980257354.6319424486
556797.839085086986057.075671035137538.60249913882
566891.965670959536056.906843785487727.02449813358
576986.092256832096052.547057234387919.63745642979
587080.218842704646044.210777808168116.22690760112
597174.345428577196032.078582460168316.61227469423
607268.472014449756016.30539546668520.6386334329
617362.59860032235997.026235786428728.17096485819
627456.725186194865974.36033185428939.09004053551

\begin{tabular}{lllllllll}
\hline
Extrapolation Forecasts of Exponential Smoothing \tabularnewline
t & Forecast & 95% Lower Bound & 95% Upper Bound \tabularnewline
45 & 5856.57322636144 & 5704.17680993346 & 6008.96964278941 \tabularnewline
46 & 5950.69981223399 & 5784.33698025028 & 6117.0626442177 \tabularnewline
47 & 6044.82639810654 & 5851.44026161095 & 6238.21253460214 \tabularnewline
48 & 6138.9529839791 & 5905.66865983752 & 6372.23730812068 \tabularnewline
49 & 6233.07956985165 & 5948.86342577974 & 6517.29571392357 \tabularnewline
50 & 6327.20615572421 & 5982.96494646479 & 6671.44736498363 \tabularnewline
51 & 6421.33274159676 & 6009.4793124803 & 6833.18617071322 \tabularnewline
52 & 6515.45932746932 & 6029.48132621837 & 7001.43732872027 \tabularnewline
53 & 6609.58591334187 & 6043.73415500937 & 7175.43767167437 \tabularnewline
54 & 6703.71249921442 & 6052.79305598025 & 7354.6319424486 \tabularnewline
55 & 6797.83908508698 & 6057.07567103513 & 7538.60249913882 \tabularnewline
56 & 6891.96567095953 & 6056.90684378548 & 7727.02449813358 \tabularnewline
57 & 6986.09225683209 & 6052.54705723438 & 7919.63745642979 \tabularnewline
58 & 7080.21884270464 & 6044.21077780816 & 8116.22690760112 \tabularnewline
59 & 7174.34542857719 & 6032.07858246016 & 8316.61227469423 \tabularnewline
60 & 7268.47201444975 & 6016.3053954666 & 8520.6386334329 \tabularnewline
61 & 7362.5986003223 & 5997.02623578642 & 8728.17096485819 \tabularnewline
62 & 7456.72518619486 & 5974.3603318542 & 8939.09004053551 \tabularnewline
\hline
\end{tabular}
%Source: https://freestatistics.org/blog/index.php?pk=300642&T=3

[TABLE]
[ROW][C]Extrapolation Forecasts of Exponential Smoothing[/C][/ROW]
[ROW][C]t[/C][C]Forecast[/C][C]95% Lower Bound[/C][C]95% Upper Bound[/C][/ROW]
[ROW][C]45[/C][C]5856.57322636144[/C][C]5704.17680993346[/C][C]6008.96964278941[/C][/ROW]
[ROW][C]46[/C][C]5950.69981223399[/C][C]5784.33698025028[/C][C]6117.0626442177[/C][/ROW]
[ROW][C]47[/C][C]6044.82639810654[/C][C]5851.44026161095[/C][C]6238.21253460214[/C][/ROW]
[ROW][C]48[/C][C]6138.9529839791[/C][C]5905.66865983752[/C][C]6372.23730812068[/C][/ROW]
[ROW][C]49[/C][C]6233.07956985165[/C][C]5948.86342577974[/C][C]6517.29571392357[/C][/ROW]
[ROW][C]50[/C][C]6327.20615572421[/C][C]5982.96494646479[/C][C]6671.44736498363[/C][/ROW]
[ROW][C]51[/C][C]6421.33274159676[/C][C]6009.4793124803[/C][C]6833.18617071322[/C][/ROW]
[ROW][C]52[/C][C]6515.45932746932[/C][C]6029.48132621837[/C][C]7001.43732872027[/C][/ROW]
[ROW][C]53[/C][C]6609.58591334187[/C][C]6043.73415500937[/C][C]7175.43767167437[/C][/ROW]
[ROW][C]54[/C][C]6703.71249921442[/C][C]6052.79305598025[/C][C]7354.6319424486[/C][/ROW]
[ROW][C]55[/C][C]6797.83908508698[/C][C]6057.07567103513[/C][C]7538.60249913882[/C][/ROW]
[ROW][C]56[/C][C]6891.96567095953[/C][C]6056.90684378548[/C][C]7727.02449813358[/C][/ROW]
[ROW][C]57[/C][C]6986.09225683209[/C][C]6052.54705723438[/C][C]7919.63745642979[/C][/ROW]
[ROW][C]58[/C][C]7080.21884270464[/C][C]6044.21077780816[/C][C]8116.22690760112[/C][/ROW]
[ROW][C]59[/C][C]7174.34542857719[/C][C]6032.07858246016[/C][C]8316.61227469423[/C][/ROW]
[ROW][C]60[/C][C]7268.47201444975[/C][C]6016.3053954666[/C][C]8520.6386334329[/C][/ROW]
[ROW][C]61[/C][C]7362.5986003223[/C][C]5997.02623578642[/C][C]8728.17096485819[/C][/ROW]
[ROW][C]62[/C][C]7456.72518619486[/C][C]5974.3603318542[/C][C]8939.09004053551[/C][/ROW]
[/TABLE]
Source: https://freestatistics.org/blog/index.php?pk=300642&T=3

Globally Unique Identifier (entire table): ba.freestatistics.org/blog/index.php?pk=300642&T=3

As an alternative you can also use a QR Code:  

The GUIDs for individual cells are displayed in the table below:

Extrapolation Forecasts of Exponential Smoothing
tForecast95% Lower Bound95% Upper Bound
455856.573226361445704.176809933466008.96964278941
465950.699812233995784.336980250286117.0626442177
476044.826398106545851.440261610956238.21253460214
486138.95298397915905.668659837526372.23730812068
496233.079569851655948.863425779746517.29571392357
506327.206155724215982.964946464796671.44736498363
516421.332741596766009.47931248036833.18617071322
526515.459327469326029.481326218377001.43732872027
536609.585913341876043.734155009377175.43767167437
546703.712499214426052.793055980257354.6319424486
556797.839085086986057.075671035137538.60249913882
566891.965670959536056.906843785487727.02449813358
576986.092256832096052.547057234387919.63745642979
587080.218842704646044.210777808168116.22690760112
597174.345428577196032.078582460168316.61227469423
607268.472014449756016.30539546668520.6386334329
617362.59860032235997.026235786428728.17096485819
627456.725186194865974.36033185428939.09004053551


Parameters (Session):
par1 = 12 ; par2 = Double ; par3 = additive ; par4 = 18 ;
Parameters (R input):
par1 = 12 ; par2 = Double ; par3 = additive ; par4 = 18 ;
R code (references can be found in the software module):
par1 <- as.numeric(par1)
par4 <- as.numeric(par4)
if (par2 == 'Single') K <- 1
if (par2 == 'Double') K <- 2
if (par2 == 'Triple') K <- par1
nx <- length(x)
nxmK <- nx - K
x <- ts(x, frequency = par1)
if (par2 == 'Single') fit <- HoltWinters(x, gamma=F, beta=F)
if (par2 == 'Double') fit <- HoltWinters(x, gamma=F)
if (par2 == 'Triple') fit <- HoltWinters(x, seasonal=par3)
fit
myresid <- x - fit$fitted[,'xhat']
bitmap(file='test1.png')
op <- par(mfrow=c(2,1))
plot(fit,ylab='Observed (black) / Fitted (red)',main='Interpolation Fit of Exponential Smoothing')
plot(myresid,ylab='Residuals',main='Interpolation Prediction Errors')
par(op)
dev.off()
bitmap(file='test2.png')
p <- predict(fit, par4, prediction.interval=TRUE)
np <- length(p[,1])
plot(fit,p,ylab='Observed (black) / Fitted (red)',main='Extrapolation Fit of Exponential Smoothing')
dev.off()
bitmap(file='test3.png')
op <- par(mfrow = c(2,2))
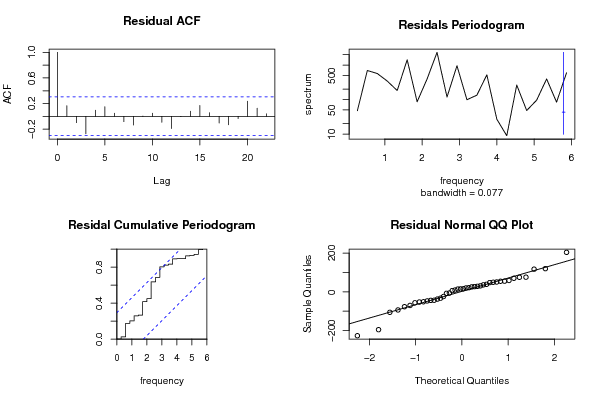
acf(as.numeric(myresid),lag.max = nx/2,main='Residual ACF')
spectrum(myresid,main='Residals Periodogram')
cpgram(myresid,main='Residal Cumulative Periodogram')
qqnorm(myresid,main='Residual Normal QQ Plot')
qqline(myresid)
par(op)
dev.off()
load(file='createtable')
a<-table.start()
a<-table.row.start(a)
a<-table.element(a,'Estimated Parameters of Exponential Smoothing',2,TRUE)
a<-table.row.end(a)
a<-table.row.start(a)
a<-table.element(a,'Parameter',header=TRUE)
a<-table.element(a,'Value',header=TRUE)
a<-table.row.end(a)
a<-table.row.start(a)
a<-table.element(a,'alpha',header=TRUE)
a<-table.element(a,fit$alpha)
a<-table.row.end(a)
a<-table.row.start(a)
a<-table.element(a,'beta',header=TRUE)
a<-table.element(a,fit$beta)
a<-table.row.end(a)
a<-table.row.start(a)
a<-table.element(a,'gamma',header=TRUE)
a<-table.element(a,fit$gamma)
a<-table.row.end(a)
a<-table.end(a)
table.save(a,file='mytable.tab')
a<-table.start()
a<-table.row.start(a)
a<-table.element(a,'Interpolation Forecasts of Exponential Smoothing',4,TRUE)
a<-table.row.end(a)
a<-table.row.start(a)
a<-table.element(a,'t',header=TRUE)
a<-table.element(a,'Observed',header=TRUE)
a<-table.element(a,'Fitted',header=TRUE)
a<-table.element(a,'Residuals',header=TRUE)
a<-table.row.end(a)
for (i in 1:nxmK) {
a<-table.row.start(a)
a<-table.element(a,i+K,header=TRUE)
a<-table.element(a,x[i+K])
a<-table.element(a,fit$fitted[i,'xhat'])
a<-table.element(a,myresid[i])
a<-table.row.end(a)
}
a<-table.end(a)
table.save(a,file='mytable1.tab')
a<-table.start()
a<-table.row.start(a)
a<-table.element(a,'Extrapolation Forecasts of Exponential Smoothing',4,TRUE)
a<-table.row.end(a)
a<-table.row.start(a)
a<-table.element(a,'t',header=TRUE)
a<-table.element(a,'Forecast',header=TRUE)
a<-table.element(a,'95% Lower Bound',header=TRUE)
a<-table.element(a,'95% Upper Bound',header=TRUE)
a<-table.row.end(a)
for (i in 1:np) {
a<-table.row.start(a)
a<-table.element(a,nx+i,header=TRUE)
a<-table.element(a,p[i,'fit'])
a<-table.element(a,p[i,'lwr'])
a<-table.element(a,p[i,'upr'])
a<-table.row.end(a)
}
a<-table.end(a)
table.save(a,file='mytable2.tab')