Free Statistics

of Irreproducible Research!

Author's title

Author*The author of this computation has been verified*
R Software Modulerwasp_exponentialsmoothing.wasp
Title produced by softwareExponential Smoothing
Date of computationSat, 17 Dec 2016 10:41:29 +0100
Cite this page as followsStatistical Computations at FreeStatistics.org, Office for Research Development and Education, URL https://freestatistics.org/blog/index.php?v=date/2016/Dec/17/t1481967703hvjp14cslwnvmzm.htm/, Retrieved Thu, 02 May 2024 12:43:50 +0000
Statistical Computations at FreeStatistics.org, Office for Research Development and Education, URL https://freestatistics.org/blog/index.php?pk=300643, Retrieved Thu, 02 May 2024 12:43:50 +0000
QR Codes:

Original text written by user:
IsPrivate?No (this computation is public)
User-defined keywords
Estimated Impact74
Family? (F = Feedback message, R = changed R code, M = changed R Module, P = changed Parameters, D = changed Data)
-       [Exponential Smoothing] [] [2016-12-17 09:41:29] [57f1f1af0ba442a9c0352eeef9ded060] [Current]
Feedback Forum

Post a new message
Dataseries X:
4304
4380
4465
4528
4557.5
4557.5
4588.5
4627.5
4711
4776.5
4781.5
4603
4770.5
4792
4803.5
4747.5
4838
4854
4902.5
4953.5
4969.5
4971
4998.5
5080
5111
5110.5
5096
4939.5
5108
5137.5
5185.5
5103
5168
5208
5250.5
5204.5
5293.5
5339.5
5484
5533
5513
5595.5
5605
5919.5


Summary of computational transaction
Raw Input view raw input (R code)
Raw Outputview raw output of R engine
Computing time1 seconds
R ServerBig Analytics Cloud Computing Center

\begin{tabular}{lllllllll}
\hline
Summary of computational transaction \tabularnewline
Raw Input view raw input (R code)  \tabularnewline
Raw Outputview raw output of R engine  \tabularnewline
Computing time1 seconds \tabularnewline
R ServerBig Analytics Cloud Computing Center \tabularnewline
\hline
\end{tabular}
%Source: https://freestatistics.org/blog/index.php?pk=300643&T=0

[TABLE]
[ROW]
Summary of computational transaction[/C][/ROW] [ROW]Raw Input[/C] view raw input (R code) [/C][/ROW] [ROW]Raw Output[/C]view raw output of R engine [/C][/ROW] [ROW]Computing time[/C]1 seconds[/C][/ROW] [ROW]R Server[/C]Big Analytics Cloud Computing Center[/C][/ROW] [/TABLE] Source: https://freestatistics.org/blog/index.php?pk=300643&T=0

Globally Unique Identifier (entire table): ba.freestatistics.org/blog/index.php?pk=300643&T=0

As an alternative you can also use a QR Code:  

The GUIDs for individual cells are displayed in the table below:

Summary of computational transaction
Raw Input view raw input (R code)
Raw Outputview raw output of R engine
Computing time1 seconds
R ServerBig Analytics Cloud Computing Center


Estimated Parameters of Exponential Smoothing
ParameterValue
alpha0.637474899644399
beta0.0279775873902042
gamma0

\begin{tabular}{lllllllll}
\hline
Estimated Parameters of Exponential Smoothing \tabularnewline
Parameter & Value \tabularnewline
alpha & 0.637474899644399 \tabularnewline
beta & 0.0279775873902042 \tabularnewline
gamma & 0 \tabularnewline
\hline
\end{tabular}
%Source: https://freestatistics.org/blog/index.php?pk=300643&T=1

[TABLE]
[ROW][C]Estimated Parameters of Exponential Smoothing[/C][/ROW]
[ROW][C]Parameter[/C][C]Value[/C][/ROW]
[ROW][C]alpha[/C][C]0.637474899644399[/C][/ROW]
[ROW][C]beta[/C][C]0.0279775873902042[/C][/ROW]
[ROW][C]gamma[/C][C]0[/C][/ROW]
[/TABLE]
Source: https://freestatistics.org/blog/index.php?pk=300643&T=1

Globally Unique Identifier (entire table): ba.freestatistics.org/blog/index.php?pk=300643&T=1

As an alternative you can also use a QR Code:  

The GUIDs for individual cells are displayed in the table below:

Estimated Parameters of Exponential Smoothing
ParameterValue
alpha0.637474899644399
beta0.0279775873902042
gamma0


Interpolation Forecasts of Exponential Smoothing
tObservedFittedResiduals
134770.54620.6000267094149.899973290599
1447924738.0103789549353.9896210450661
154803.54787.5556944436715.9443055563279
164747.54751.11160977044-3.61160977043528
1748384850.36587350814-12.3658735081399
1848544857.54813504072-3.54813504072081
194902.54895.100702494997.39929750500596
204953.54930.2639499555923.2360500444056
214969.55025.77047816353-56.2704781635293
2249715059.61083908972-88.6108390897189
234998.55013.17132317077-14.6713231707708
2450804826.89639621741253.103603782589
2551115160.43953584967-49.4395358496722
265110.55153.00809663796-42.5080966379619
2750965141.54964362567-45.5496436256726
284939.55065.31906908277-125.81906908277
2951085083.9039329494724.0960670505265
305137.55112.2148534345125.285146565494
315185.55166.5472430986318.9527569013744
3251035207.68091590054-104.680915900542
3351685217.96757372178-49.9675737217785
3452085252.26227502826-44.262275028258
355250.55231.3212096084119.1787903915874
365204.55064.45595158002140.044048419983
375293.55321.74111541437-28.2411154143729
385339.55324.0158640873715.4841359126312
3954845346.75302267638137.246977323615
4055335387.53790421472145.46209578528
4155135584.38320212796-71.3832021279641
425595.55555.4511120789140.048887921088
4356055623.08095475615-18.0809547561475
445919.55643.83200780266275.667992197345

\begin{tabular}{lllllllll}
\hline
Interpolation Forecasts of Exponential Smoothing \tabularnewline
t & Observed & Fitted & Residuals \tabularnewline
13 & 4770.5 & 4620.6000267094 & 149.899973290599 \tabularnewline
14 & 4792 & 4738.01037895493 & 53.9896210450661 \tabularnewline
15 & 4803.5 & 4787.55569444367 & 15.9443055563279 \tabularnewline
16 & 4747.5 & 4751.11160977044 & -3.61160977043528 \tabularnewline
17 & 4838 & 4850.36587350814 & -12.3658735081399 \tabularnewline
18 & 4854 & 4857.54813504072 & -3.54813504072081 \tabularnewline
19 & 4902.5 & 4895.10070249499 & 7.39929750500596 \tabularnewline
20 & 4953.5 & 4930.26394995559 & 23.2360500444056 \tabularnewline
21 & 4969.5 & 5025.77047816353 & -56.2704781635293 \tabularnewline
22 & 4971 & 5059.61083908972 & -88.6108390897189 \tabularnewline
23 & 4998.5 & 5013.17132317077 & -14.6713231707708 \tabularnewline
24 & 5080 & 4826.89639621741 & 253.103603782589 \tabularnewline
25 & 5111 & 5160.43953584967 & -49.4395358496722 \tabularnewline
26 & 5110.5 & 5153.00809663796 & -42.5080966379619 \tabularnewline
27 & 5096 & 5141.54964362567 & -45.5496436256726 \tabularnewline
28 & 4939.5 & 5065.31906908277 & -125.81906908277 \tabularnewline
29 & 5108 & 5083.90393294947 & 24.0960670505265 \tabularnewline
30 & 5137.5 & 5112.21485343451 & 25.285146565494 \tabularnewline
31 & 5185.5 & 5166.54724309863 & 18.9527569013744 \tabularnewline
32 & 5103 & 5207.68091590054 & -104.680915900542 \tabularnewline
33 & 5168 & 5217.96757372178 & -49.9675737217785 \tabularnewline
34 & 5208 & 5252.26227502826 & -44.262275028258 \tabularnewline
35 & 5250.5 & 5231.32120960841 & 19.1787903915874 \tabularnewline
36 & 5204.5 & 5064.45595158002 & 140.044048419983 \tabularnewline
37 & 5293.5 & 5321.74111541437 & -28.2411154143729 \tabularnewline
38 & 5339.5 & 5324.01586408737 & 15.4841359126312 \tabularnewline
39 & 5484 & 5346.75302267638 & 137.246977323615 \tabularnewline
40 & 5533 & 5387.53790421472 & 145.46209578528 \tabularnewline
41 & 5513 & 5584.38320212796 & -71.3832021279641 \tabularnewline
42 & 5595.5 & 5555.45111207891 & 40.048887921088 \tabularnewline
43 & 5605 & 5623.08095475615 & -18.0809547561475 \tabularnewline
44 & 5919.5 & 5643.83200780266 & 275.667992197345 \tabularnewline
\hline
\end{tabular}
%Source: https://freestatistics.org/blog/index.php?pk=300643&T=2

[TABLE]
[ROW][C]Interpolation Forecasts of Exponential Smoothing[/C][/ROW]
[ROW][C]t[/C][C]Observed[/C][C]Fitted[/C][C]Residuals[/C][/ROW]
[ROW][C]13[/C][C]4770.5[/C][C]4620.6000267094[/C][C]149.899973290599[/C][/ROW]
[ROW][C]14[/C][C]4792[/C][C]4738.01037895493[/C][C]53.9896210450661[/C][/ROW]
[ROW][C]15[/C][C]4803.5[/C][C]4787.55569444367[/C][C]15.9443055563279[/C][/ROW]
[ROW][C]16[/C][C]4747.5[/C][C]4751.11160977044[/C][C]-3.61160977043528[/C][/ROW]
[ROW][C]17[/C][C]4838[/C][C]4850.36587350814[/C][C]-12.3658735081399[/C][/ROW]
[ROW][C]18[/C][C]4854[/C][C]4857.54813504072[/C][C]-3.54813504072081[/C][/ROW]
[ROW][C]19[/C][C]4902.5[/C][C]4895.10070249499[/C][C]7.39929750500596[/C][/ROW]
[ROW][C]20[/C][C]4953.5[/C][C]4930.26394995559[/C][C]23.2360500444056[/C][/ROW]
[ROW][C]21[/C][C]4969.5[/C][C]5025.77047816353[/C][C]-56.2704781635293[/C][/ROW]
[ROW][C]22[/C][C]4971[/C][C]5059.61083908972[/C][C]-88.6108390897189[/C][/ROW]
[ROW][C]23[/C][C]4998.5[/C][C]5013.17132317077[/C][C]-14.6713231707708[/C][/ROW]
[ROW][C]24[/C][C]5080[/C][C]4826.89639621741[/C][C]253.103603782589[/C][/ROW]
[ROW][C]25[/C][C]5111[/C][C]5160.43953584967[/C][C]-49.4395358496722[/C][/ROW]
[ROW][C]26[/C][C]5110.5[/C][C]5153.00809663796[/C][C]-42.5080966379619[/C][/ROW]
[ROW][C]27[/C][C]5096[/C][C]5141.54964362567[/C][C]-45.5496436256726[/C][/ROW]
[ROW][C]28[/C][C]4939.5[/C][C]5065.31906908277[/C][C]-125.81906908277[/C][/ROW]
[ROW][C]29[/C][C]5108[/C][C]5083.90393294947[/C][C]24.0960670505265[/C][/ROW]
[ROW][C]30[/C][C]5137.5[/C][C]5112.21485343451[/C][C]25.285146565494[/C][/ROW]
[ROW][C]31[/C][C]5185.5[/C][C]5166.54724309863[/C][C]18.9527569013744[/C][/ROW]
[ROW][C]32[/C][C]5103[/C][C]5207.68091590054[/C][C]-104.680915900542[/C][/ROW]
[ROW][C]33[/C][C]5168[/C][C]5217.96757372178[/C][C]-49.9675737217785[/C][/ROW]
[ROW][C]34[/C][C]5208[/C][C]5252.26227502826[/C][C]-44.262275028258[/C][/ROW]
[ROW][C]35[/C][C]5250.5[/C][C]5231.32120960841[/C][C]19.1787903915874[/C][/ROW]
[ROW][C]36[/C][C]5204.5[/C][C]5064.45595158002[/C][C]140.044048419983[/C][/ROW]
[ROW][C]37[/C][C]5293.5[/C][C]5321.74111541437[/C][C]-28.2411154143729[/C][/ROW]
[ROW][C]38[/C][C]5339.5[/C][C]5324.01586408737[/C][C]15.4841359126312[/C][/ROW]
[ROW][C]39[/C][C]5484[/C][C]5346.75302267638[/C][C]137.246977323615[/C][/ROW]
[ROW][C]40[/C][C]5533[/C][C]5387.53790421472[/C][C]145.46209578528[/C][/ROW]
[ROW][C]41[/C][C]5513[/C][C]5584.38320212796[/C][C]-71.3832021279641[/C][/ROW]
[ROW][C]42[/C][C]5595.5[/C][C]5555.45111207891[/C][C]40.048887921088[/C][/ROW]
[ROW][C]43[/C][C]5605[/C][C]5623.08095475615[/C][C]-18.0809547561475[/C][/ROW]
[ROW][C]44[/C][C]5919.5[/C][C]5643.83200780266[/C][C]275.667992197345[/C][/ROW]
[/TABLE]
Source: https://freestatistics.org/blog/index.php?pk=300643&T=2

Globally Unique Identifier (entire table): ba.freestatistics.org/blog/index.php?pk=300643&T=2

As an alternative you can also use a QR Code:  

The GUIDs for individual cells are displayed in the table below:

Interpolation Forecasts of Exponential Smoothing
tObservedFittedResiduals
134770.54620.6000267094149.899973290599
1447924738.0103789549353.9896210450661
154803.54787.5556944436715.9443055563279
164747.54751.11160977044-3.61160977043528
1748384850.36587350814-12.3658735081399
1848544857.54813504072-3.54813504072081
194902.54895.100702494997.39929750500596
204953.54930.2639499555923.2360500444056
214969.55025.77047816353-56.2704781635293
2249715059.61083908972-88.6108390897189
234998.55013.17132317077-14.6713231707708
2450804826.89639621741253.103603782589
2551115160.43953584967-49.4395358496722
265110.55153.00809663796-42.5080966379619
2750965141.54964362567-45.5496436256726
284939.55065.31906908277-125.81906908277
2951085083.9039329494724.0960670505265
305137.55112.2148534345125.285146565494
315185.55166.5472430986318.9527569013744
3251035207.68091590054-104.680915900542
3351685217.96757372178-49.9675737217785
3452085252.26227502826-44.262275028258
355250.55231.3212096084119.1787903915874
365204.55064.45595158002140.044048419983
375293.55321.74111541437-28.2411154143729
385339.55324.0158640873715.4841359126312
3954845346.75302267638137.246977323615
4055335387.53790421472145.46209578528
4155135584.38320212796-71.3832021279641
425595.55555.4511120789140.048887921088
4356055623.08095475615-18.0809547561475
445919.55643.83200780266275.667992197345


Extrapolation Forecasts of Exponential Smoothing
tForecast95% Lower Bound95% Upper Bound
455906.590515980965722.272767733266090.90826422867
465983.638431831435763.270312115456204.0065515474
476002.603014348565749.707567034916255.49846166221
485834.859263532365551.704460690786118.01406637394
496011.719679382825699.877850426716323.56150833893
506041.350928566625701.963580814856380.73827631839
516063.294677750425697.21600894716429.37334655374
526023.217593600895631.099755570176415.3354316316
536131.369676118025713.716942306926549.02240992911
546153.250925301815710.455909492576596.04594111106
556199.944674485615732.31354678196667.57580218933
566237.138423669415744.909050740096729.36779659874
576324.165506186545807.520859688536840.81015268455
586401.213422037015860.291717963216942.13512611081
596420.178004554145855.080520997336985.27548811095
606252.434253737945663.231460545166841.63704693071
616429.29466958845816.031105132987042.55823404383
626458.92591877225821.624120039347096.22771750506

\begin{tabular}{lllllllll}
\hline
Extrapolation Forecasts of Exponential Smoothing \tabularnewline
t & Forecast & 95% Lower Bound & 95% Upper Bound \tabularnewline
45 & 5906.59051598096 & 5722.27276773326 & 6090.90826422867 \tabularnewline
46 & 5983.63843183143 & 5763.27031211545 & 6204.0065515474 \tabularnewline
47 & 6002.60301434856 & 5749.70756703491 & 6255.49846166221 \tabularnewline
48 & 5834.85926353236 & 5551.70446069078 & 6118.01406637394 \tabularnewline
49 & 6011.71967938282 & 5699.87785042671 & 6323.56150833893 \tabularnewline
50 & 6041.35092856662 & 5701.96358081485 & 6380.73827631839 \tabularnewline
51 & 6063.29467775042 & 5697.2160089471 & 6429.37334655374 \tabularnewline
52 & 6023.21759360089 & 5631.09975557017 & 6415.3354316316 \tabularnewline
53 & 6131.36967611802 & 5713.71694230692 & 6549.02240992911 \tabularnewline
54 & 6153.25092530181 & 5710.45590949257 & 6596.04594111106 \tabularnewline
55 & 6199.94467448561 & 5732.3135467819 & 6667.57580218933 \tabularnewline
56 & 6237.13842366941 & 5744.90905074009 & 6729.36779659874 \tabularnewline
57 & 6324.16550618654 & 5807.52085968853 & 6840.81015268455 \tabularnewline
58 & 6401.21342203701 & 5860.29171796321 & 6942.13512611081 \tabularnewline
59 & 6420.17800455414 & 5855.08052099733 & 6985.27548811095 \tabularnewline
60 & 6252.43425373794 & 5663.23146054516 & 6841.63704693071 \tabularnewline
61 & 6429.2946695884 & 5816.03110513298 & 7042.55823404383 \tabularnewline
62 & 6458.9259187722 & 5821.62412003934 & 7096.22771750506 \tabularnewline
\hline
\end{tabular}
%Source: https://freestatistics.org/blog/index.php?pk=300643&T=3

[TABLE]
[ROW][C]Extrapolation Forecasts of Exponential Smoothing[/C][/ROW]
[ROW][C]t[/C][C]Forecast[/C][C]95% Lower Bound[/C][C]95% Upper Bound[/C][/ROW]
[ROW][C]45[/C][C]5906.59051598096[/C][C]5722.27276773326[/C][C]6090.90826422867[/C][/ROW]
[ROW][C]46[/C][C]5983.63843183143[/C][C]5763.27031211545[/C][C]6204.0065515474[/C][/ROW]
[ROW][C]47[/C][C]6002.60301434856[/C][C]5749.70756703491[/C][C]6255.49846166221[/C][/ROW]
[ROW][C]48[/C][C]5834.85926353236[/C][C]5551.70446069078[/C][C]6118.01406637394[/C][/ROW]
[ROW][C]49[/C][C]6011.71967938282[/C][C]5699.87785042671[/C][C]6323.56150833893[/C][/ROW]
[ROW][C]50[/C][C]6041.35092856662[/C][C]5701.96358081485[/C][C]6380.73827631839[/C][/ROW]
[ROW][C]51[/C][C]6063.29467775042[/C][C]5697.2160089471[/C][C]6429.37334655374[/C][/ROW]
[ROW][C]52[/C][C]6023.21759360089[/C][C]5631.09975557017[/C][C]6415.3354316316[/C][/ROW]
[ROW][C]53[/C][C]6131.36967611802[/C][C]5713.71694230692[/C][C]6549.02240992911[/C][/ROW]
[ROW][C]54[/C][C]6153.25092530181[/C][C]5710.45590949257[/C][C]6596.04594111106[/C][/ROW]
[ROW][C]55[/C][C]6199.94467448561[/C][C]5732.3135467819[/C][C]6667.57580218933[/C][/ROW]
[ROW][C]56[/C][C]6237.13842366941[/C][C]5744.90905074009[/C][C]6729.36779659874[/C][/ROW]
[ROW][C]57[/C][C]6324.16550618654[/C][C]5807.52085968853[/C][C]6840.81015268455[/C][/ROW]
[ROW][C]58[/C][C]6401.21342203701[/C][C]5860.29171796321[/C][C]6942.13512611081[/C][/ROW]
[ROW][C]59[/C][C]6420.17800455414[/C][C]5855.08052099733[/C][C]6985.27548811095[/C][/ROW]
[ROW][C]60[/C][C]6252.43425373794[/C][C]5663.23146054516[/C][C]6841.63704693071[/C][/ROW]
[ROW][C]61[/C][C]6429.2946695884[/C][C]5816.03110513298[/C][C]7042.55823404383[/C][/ROW]
[ROW][C]62[/C][C]6458.9259187722[/C][C]5821.62412003934[/C][C]7096.22771750506[/C][/ROW]
[/TABLE]
Source: https://freestatistics.org/blog/index.php?pk=300643&T=3

Globally Unique Identifier (entire table): ba.freestatistics.org/blog/index.php?pk=300643&T=3

As an alternative you can also use a QR Code:  

The GUIDs for individual cells are displayed in the table below:

Extrapolation Forecasts of Exponential Smoothing
tForecast95% Lower Bound95% Upper Bound
455906.590515980965722.272767733266090.90826422867
465983.638431831435763.270312115456204.0065515474
476002.603014348565749.707567034916255.49846166221
485834.859263532365551.704460690786118.01406637394
496011.719679382825699.877850426716323.56150833893
506041.350928566625701.963580814856380.73827631839
516063.294677750425697.21600894716429.37334655374
526023.217593600895631.099755570176415.3354316316
536131.369676118025713.716942306926549.02240992911
546153.250925301815710.455909492576596.04594111106
556199.944674485615732.31354678196667.57580218933
566237.138423669415744.909050740096729.36779659874
576324.165506186545807.520859688536840.81015268455
586401.213422037015860.291717963216942.13512611081
596420.178004554145855.080520997336985.27548811095
606252.434253737945663.231460545166841.63704693071
616429.29466958845816.031105132987042.55823404383
626458.92591877225821.624120039347096.22771750506


Parameters (Session):
par1 = 12 ; par2 = Triple ; par3 = additive ; par4 = 18 ;
Parameters (R input):
par1 = 12 ; par2 = Triple ; par3 = additive ; par4 = 18 ;
R code (references can be found in the software module):
par1 <- as.numeric(par1)
par4 <- as.numeric(par4)
if (par2 == 'Single') K <- 1
if (par2 == 'Double') K <- 2
if (par2 == 'Triple') K <- par1
nx <- length(x)
nxmK <- nx - K
x <- ts(x, frequency = par1)
if (par2 == 'Single') fit <- HoltWinters(x, gamma=F, beta=F)
if (par2 == 'Double') fit <- HoltWinters(x, gamma=F)
if (par2 == 'Triple') fit <- HoltWinters(x, seasonal=par3)
fit
myresid <- x - fit$fitted[,'xhat']
bitmap(file='test1.png')
op <- par(mfrow=c(2,1))
plot(fit,ylab='Observed (black) / Fitted (red)',main='Interpolation Fit of Exponential Smoothing')
plot(myresid,ylab='Residuals',main='Interpolation Prediction Errors')
par(op)
dev.off()
bitmap(file='test2.png')
p <- predict(fit, par4, prediction.interval=TRUE)
np <- length(p[,1])
plot(fit,p,ylab='Observed (black) / Fitted (red)',main='Extrapolation Fit of Exponential Smoothing')
dev.off()
bitmap(file='test3.png')
op <- par(mfrow = c(2,2))
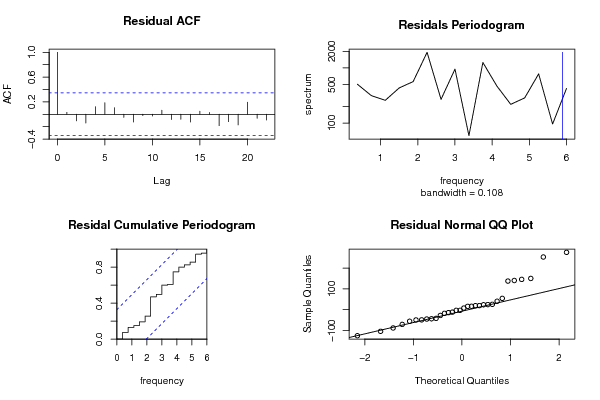
acf(as.numeric(myresid),lag.max = nx/2,main='Residual ACF')
spectrum(myresid,main='Residals Periodogram')
cpgram(myresid,main='Residal Cumulative Periodogram')
qqnorm(myresid,main='Residual Normal QQ Plot')
qqline(myresid)
par(op)
dev.off()
load(file='createtable')
a<-table.start()
a<-table.row.start(a)
a<-table.element(a,'Estimated Parameters of Exponential Smoothing',2,TRUE)
a<-table.row.end(a)
a<-table.row.start(a)
a<-table.element(a,'Parameter',header=TRUE)
a<-table.element(a,'Value',header=TRUE)
a<-table.row.end(a)
a<-table.row.start(a)
a<-table.element(a,'alpha',header=TRUE)
a<-table.element(a,fit$alpha)
a<-table.row.end(a)
a<-table.row.start(a)
a<-table.element(a,'beta',header=TRUE)
a<-table.element(a,fit$beta)
a<-table.row.end(a)
a<-table.row.start(a)
a<-table.element(a,'gamma',header=TRUE)
a<-table.element(a,fit$gamma)
a<-table.row.end(a)
a<-table.end(a)
table.save(a,file='mytable.tab')
a<-table.start()
a<-table.row.start(a)
a<-table.element(a,'Interpolation Forecasts of Exponential Smoothing',4,TRUE)
a<-table.row.end(a)
a<-table.row.start(a)
a<-table.element(a,'t',header=TRUE)
a<-table.element(a,'Observed',header=TRUE)
a<-table.element(a,'Fitted',header=TRUE)
a<-table.element(a,'Residuals',header=TRUE)
a<-table.row.end(a)
for (i in 1:nxmK) {
a<-table.row.start(a)
a<-table.element(a,i+K,header=TRUE)
a<-table.element(a,x[i+K])
a<-table.element(a,fit$fitted[i,'xhat'])
a<-table.element(a,myresid[i])
a<-table.row.end(a)
}
a<-table.end(a)
table.save(a,file='mytable1.tab')
a<-table.start()
a<-table.row.start(a)
a<-table.element(a,'Extrapolation Forecasts of Exponential Smoothing',4,TRUE)
a<-table.row.end(a)
a<-table.row.start(a)
a<-table.element(a,'t',header=TRUE)
a<-table.element(a,'Forecast',header=TRUE)
a<-table.element(a,'95% Lower Bound',header=TRUE)
a<-table.element(a,'95% Upper Bound',header=TRUE)
a<-table.row.end(a)
for (i in 1:np) {
a<-table.row.start(a)
a<-table.element(a,nx+i,header=TRUE)
a<-table.element(a,p[i,'fit'])
a<-table.element(a,p[i,'lwr'])
a<-table.element(a,p[i,'upr'])
a<-table.row.end(a)
}
a<-table.end(a)
table.save(a,file='mytable2.tab')