Free Statistics

of Irreproducible Research!

Author's title

Author*The author of this computation has been verified*
R Software Modulerwasp_autocorrelation.wasp
Title produced by software(Partial) Autocorrelation Function
Date of computationSat, 17 Dec 2016 10:48:24 +0100
Cite this page as followsStatistical Computations at FreeStatistics.org, Office for Research Development and Education, URL https://freestatistics.org/blog/index.php?v=date/2016/Dec/17/t1481968269oxj34sqzqycqdyc.htm/, Retrieved Thu, 02 May 2024 10:40:32 +0000
Statistical Computations at FreeStatistics.org, Office for Research Development and Education, URL https://freestatistics.org/blog/index.php?pk=300652, Retrieved Thu, 02 May 2024 10:40:32 +0000
QR Codes:

Original text written by user:
IsPrivate?No (this computation is public)
User-defined keywords
Estimated Impact57
Family? (F = Feedback message, R = changed R code, M = changed R Module, P = changed Parameters, D = changed Data)
-       [(Partial) Autocorrelation Function] [partial autocorre...] [2016-12-17 09:48:24] [e4ec2dc388263dc7bca2f210fca20b5e] [Current]
Feedback Forum

Post a new message
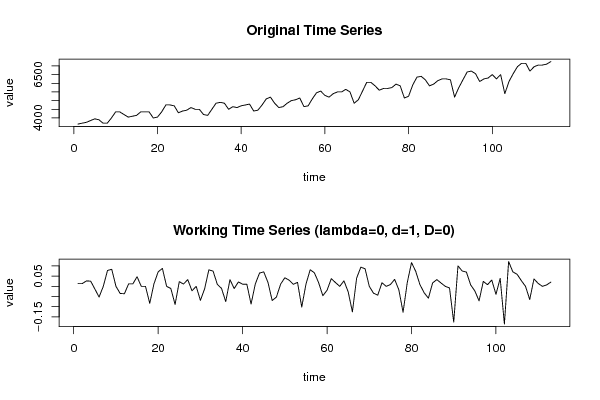
Dataseries X:
3650
3700
3750
3850
3950
3900
3700
3700
4000
4350
4350
4200
4050
4100
4150
4350
4350
4350
4000
4050
4350
4750
4750
4700
4300
4400
4450
4600
4500
4500
4200
4150
4500
4850
4900
4850
4500
4650
4600
4700
4750
4800
4400
4450
4750
5100
5200
4850
4600
4650
4850
5000
5050
5150
4650
4700
5100
5450
5550
5300
5200
5400
5500
5500
5650
5500
4850
5050
5550
6050
6050
5850
5600
5700
5700
5750
5950
5850
5150
5250
5900
6350
6400
6200
5850
5950
6150
6250
6250
6200
5200
5750
6200
6650
6700
6550
6100
6250
6300
6500
6250
6500
5400
6100
6550
6950
7150
7150
6700
6950
7050
7050
7100
7250


Summary of computational transaction
Raw Input view raw input (R code)
Raw Outputview raw output of R engine
Computing time2 seconds
R ServerBig Analytics Cloud Computing Center

\begin{tabular}{lllllllll}
\hline
Summary of computational transaction \tabularnewline
Raw Input view raw input (R code)  \tabularnewline
Raw Outputview raw output of R engine  \tabularnewline
Computing time2 seconds \tabularnewline
R ServerBig Analytics Cloud Computing Center \tabularnewline
\hline
\end{tabular}
%Source: https://freestatistics.org/blog/index.php?pk=300652&T=0

[TABLE]
[ROW]
Summary of computational transaction[/C][/ROW] [ROW]Raw Input[/C] view raw input (R code) [/C][/ROW] [ROW]Raw Output[/C]view raw output of R engine [/C][/ROW] [ROW]Computing time[/C]2 seconds[/C][/ROW] [ROW]R Server[/C]Big Analytics Cloud Computing Center[/C][/ROW] [/TABLE] Source: https://freestatistics.org/blog/index.php?pk=300652&T=0

Globally Unique Identifier (entire table): ba.freestatistics.org/blog/index.php?pk=300652&T=0

As an alternative you can also use a QR Code:  

The GUIDs for individual cells are displayed in the table below:

Summary of computational transaction
Raw Input view raw input (R code)
Raw Outputview raw output of R engine
Computing time2 seconds
R ServerBig Analytics Cloud Computing Center


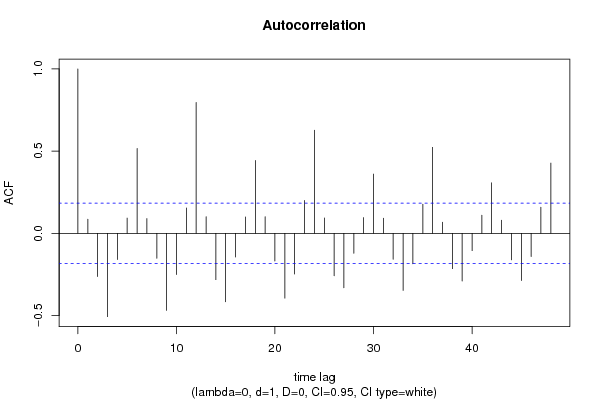
Autocorrelation Function
Time lag kACF(k)T-STATP-value
10.0853660.90750.18305
2-0.262378-2.78910.003102
3-0.506753-5.38690
4-0.159128-1.69150.046744
50.0926080.98440.163502
60.5161725.4870
70.0894840.95120.171759
8-0.151681-1.61240.054833
9-0.468626-4.98161e-06
10-0.250582-2.66370.004429
110.1537921.63480.052434
120.795728.45860
130.1004981.06830.14383
14-0.281795-2.99550.001684
15-0.416623-4.42881.1e-05
16-0.14443-1.53530.063751
170.0990451.05290.147325
180.4426614.70564e-06
190.1012381.07620.142071
20-0.168404-1.79020.038054
21-0.394018-4.18852.8e-05
22-0.247269-2.62850.004884
230.1998872.12480.01789
240.6269146.66420
250.0938110.99720.160393
26-0.257847-2.74090.003562
27-0.330763-3.51610.000316
28-0.12109-1.28720.100326
290.0958111.01850.155311
300.3605073.83220.000105
310.0923280.98150.164232
32-0.157787-1.67730.048124
33-0.347039-3.68910.000174
34-0.185501-1.97190.025532
350.1765961.87720.031532
360.5232165.56190
370.0677610.72030.23641
38-0.214654-2.28180.012187
39-0.290384-3.08680.001273
40-0.105309-1.11940.132662
410.1100131.16950.122341
420.307123.26470.000725
430.0801930.85250.197881
44-0.161247-1.71410.044628
45-0.287223-3.05320.001412
46-0.141307-1.50210.067928
470.1587851.68790.047094
480.4273934.54327e-06

\begin{tabular}{lllllllll}
\hline
Autocorrelation Function \tabularnewline
Time lag k & ACF(k) & T-STAT & P-value \tabularnewline
1 & 0.085366 & 0.9075 & 0.18305 \tabularnewline
2 & -0.262378 & -2.7891 & 0.003102 \tabularnewline
3 & -0.506753 & -5.3869 & 0 \tabularnewline
4 & -0.159128 & -1.6915 & 0.046744 \tabularnewline
5 & 0.092608 & 0.9844 & 0.163502 \tabularnewline
6 & 0.516172 & 5.487 & 0 \tabularnewline
7 & 0.089484 & 0.9512 & 0.171759 \tabularnewline
8 & -0.151681 & -1.6124 & 0.054833 \tabularnewline
9 & -0.468626 & -4.9816 & 1e-06 \tabularnewline
10 & -0.250582 & -2.6637 & 0.004429 \tabularnewline
11 & 0.153792 & 1.6348 & 0.052434 \tabularnewline
12 & 0.79572 & 8.4586 & 0 \tabularnewline
13 & 0.100498 & 1.0683 & 0.14383 \tabularnewline
14 & -0.281795 & -2.9955 & 0.001684 \tabularnewline
15 & -0.416623 & -4.4288 & 1.1e-05 \tabularnewline
16 & -0.14443 & -1.5353 & 0.063751 \tabularnewline
17 & 0.099045 & 1.0529 & 0.147325 \tabularnewline
18 & 0.442661 & 4.7056 & 4e-06 \tabularnewline
19 & 0.101238 & 1.0762 & 0.142071 \tabularnewline
20 & -0.168404 & -1.7902 & 0.038054 \tabularnewline
21 & -0.394018 & -4.1885 & 2.8e-05 \tabularnewline
22 & -0.247269 & -2.6285 & 0.004884 \tabularnewline
23 & 0.199887 & 2.1248 & 0.01789 \tabularnewline
24 & 0.626914 & 6.6642 & 0 \tabularnewline
25 & 0.093811 & 0.9972 & 0.160393 \tabularnewline
26 & -0.257847 & -2.7409 & 0.003562 \tabularnewline
27 & -0.330763 & -3.5161 & 0.000316 \tabularnewline
28 & -0.12109 & -1.2872 & 0.100326 \tabularnewline
29 & 0.095811 & 1.0185 & 0.155311 \tabularnewline
30 & 0.360507 & 3.8322 & 0.000105 \tabularnewline
31 & 0.092328 & 0.9815 & 0.164232 \tabularnewline
32 & -0.157787 & -1.6773 & 0.048124 \tabularnewline
33 & -0.347039 & -3.6891 & 0.000174 \tabularnewline
34 & -0.185501 & -1.9719 & 0.025532 \tabularnewline
35 & 0.176596 & 1.8772 & 0.031532 \tabularnewline
36 & 0.523216 & 5.5619 & 0 \tabularnewline
37 & 0.067761 & 0.7203 & 0.23641 \tabularnewline
38 & -0.214654 & -2.2818 & 0.012187 \tabularnewline
39 & -0.290384 & -3.0868 & 0.001273 \tabularnewline
40 & -0.105309 & -1.1194 & 0.132662 \tabularnewline
41 & 0.110013 & 1.1695 & 0.122341 \tabularnewline
42 & 0.30712 & 3.2647 & 0.000725 \tabularnewline
43 & 0.080193 & 0.8525 & 0.197881 \tabularnewline
44 & -0.161247 & -1.7141 & 0.044628 \tabularnewline
45 & -0.287223 & -3.0532 & 0.001412 \tabularnewline
46 & -0.141307 & -1.5021 & 0.067928 \tabularnewline
47 & 0.158785 & 1.6879 & 0.047094 \tabularnewline
48 & 0.427393 & 4.5432 & 7e-06 \tabularnewline
\hline
\end{tabular}
%Source: https://freestatistics.org/blog/index.php?pk=300652&T=1

[TABLE]
[ROW][C]Autocorrelation Function[/C][/ROW]
[ROW][C]Time lag k[/C][C]ACF(k)[/C][C]T-STAT[/C][C]P-value[/C][/ROW]
[ROW][C]1[/C][C]0.085366[/C][C]0.9075[/C][C]0.18305[/C][/ROW]
[ROW][C]2[/C][C]-0.262378[/C][C]-2.7891[/C][C]0.003102[/C][/ROW]
[ROW][C]3[/C][C]-0.506753[/C][C]-5.3869[/C][C]0[/C][/ROW]
[ROW][C]4[/C][C]-0.159128[/C][C]-1.6915[/C][C]0.046744[/C][/ROW]
[ROW][C]5[/C][C]0.092608[/C][C]0.9844[/C][C]0.163502[/C][/ROW]
[ROW][C]6[/C][C]0.516172[/C][C]5.487[/C][C]0[/C][/ROW]
[ROW][C]7[/C][C]0.089484[/C][C]0.9512[/C][C]0.171759[/C][/ROW]
[ROW][C]8[/C][C]-0.151681[/C][C]-1.6124[/C][C]0.054833[/C][/ROW]
[ROW][C]9[/C][C]-0.468626[/C][C]-4.9816[/C][C]1e-06[/C][/ROW]
[ROW][C]10[/C][C]-0.250582[/C][C]-2.6637[/C][C]0.004429[/C][/ROW]
[ROW][C]11[/C][C]0.153792[/C][C]1.6348[/C][C]0.052434[/C][/ROW]
[ROW][C]12[/C][C]0.79572[/C][C]8.4586[/C][C]0[/C][/ROW]
[ROW][C]13[/C][C]0.100498[/C][C]1.0683[/C][C]0.14383[/C][/ROW]
[ROW][C]14[/C][C]-0.281795[/C][C]-2.9955[/C][C]0.001684[/C][/ROW]
[ROW][C]15[/C][C]-0.416623[/C][C]-4.4288[/C][C]1.1e-05[/C][/ROW]
[ROW][C]16[/C][C]-0.14443[/C][C]-1.5353[/C][C]0.063751[/C][/ROW]
[ROW][C]17[/C][C]0.099045[/C][C]1.0529[/C][C]0.147325[/C][/ROW]
[ROW][C]18[/C][C]0.442661[/C][C]4.7056[/C][C]4e-06[/C][/ROW]
[ROW][C]19[/C][C]0.101238[/C][C]1.0762[/C][C]0.142071[/C][/ROW]
[ROW][C]20[/C][C]-0.168404[/C][C]-1.7902[/C][C]0.038054[/C][/ROW]
[ROW][C]21[/C][C]-0.394018[/C][C]-4.1885[/C][C]2.8e-05[/C][/ROW]
[ROW][C]22[/C][C]-0.247269[/C][C]-2.6285[/C][C]0.004884[/C][/ROW]
[ROW][C]23[/C][C]0.199887[/C][C]2.1248[/C][C]0.01789[/C][/ROW]
[ROW][C]24[/C][C]0.626914[/C][C]6.6642[/C][C]0[/C][/ROW]
[ROW][C]25[/C][C]0.093811[/C][C]0.9972[/C][C]0.160393[/C][/ROW]
[ROW][C]26[/C][C]-0.257847[/C][C]-2.7409[/C][C]0.003562[/C][/ROW]
[ROW][C]27[/C][C]-0.330763[/C][C]-3.5161[/C][C]0.000316[/C][/ROW]
[ROW][C]28[/C][C]-0.12109[/C][C]-1.2872[/C][C]0.100326[/C][/ROW]
[ROW][C]29[/C][C]0.095811[/C][C]1.0185[/C][C]0.155311[/C][/ROW]
[ROW][C]30[/C][C]0.360507[/C][C]3.8322[/C][C]0.000105[/C][/ROW]
[ROW][C]31[/C][C]0.092328[/C][C]0.9815[/C][C]0.164232[/C][/ROW]
[ROW][C]32[/C][C]-0.157787[/C][C]-1.6773[/C][C]0.048124[/C][/ROW]
[ROW][C]33[/C][C]-0.347039[/C][C]-3.6891[/C][C]0.000174[/C][/ROW]
[ROW][C]34[/C][C]-0.185501[/C][C]-1.9719[/C][C]0.025532[/C][/ROW]
[ROW][C]35[/C][C]0.176596[/C][C]1.8772[/C][C]0.031532[/C][/ROW]
[ROW][C]36[/C][C]0.523216[/C][C]5.5619[/C][C]0[/C][/ROW]
[ROW][C]37[/C][C]0.067761[/C][C]0.7203[/C][C]0.23641[/C][/ROW]
[ROW][C]38[/C][C]-0.214654[/C][C]-2.2818[/C][C]0.012187[/C][/ROW]
[ROW][C]39[/C][C]-0.290384[/C][C]-3.0868[/C][C]0.001273[/C][/ROW]
[ROW][C]40[/C][C]-0.105309[/C][C]-1.1194[/C][C]0.132662[/C][/ROW]
[ROW][C]41[/C][C]0.110013[/C][C]1.1695[/C][C]0.122341[/C][/ROW]
[ROW][C]42[/C][C]0.30712[/C][C]3.2647[/C][C]0.000725[/C][/ROW]
[ROW][C]43[/C][C]0.080193[/C][C]0.8525[/C][C]0.197881[/C][/ROW]
[ROW][C]44[/C][C]-0.161247[/C][C]-1.7141[/C][C]0.044628[/C][/ROW]
[ROW][C]45[/C][C]-0.287223[/C][C]-3.0532[/C][C]0.001412[/C][/ROW]
[ROW][C]46[/C][C]-0.141307[/C][C]-1.5021[/C][C]0.067928[/C][/ROW]
[ROW][C]47[/C][C]0.158785[/C][C]1.6879[/C][C]0.047094[/C][/ROW]
[ROW][C]48[/C][C]0.427393[/C][C]4.5432[/C][C]7e-06[/C][/ROW]
[/TABLE]
Source: https://freestatistics.org/blog/index.php?pk=300652&T=1

Globally Unique Identifier (entire table): ba.freestatistics.org/blog/index.php?pk=300652&T=1

As an alternative you can also use a QR Code:  

The GUIDs for individual cells are displayed in the table below:

Autocorrelation Function
Time lag kACF(k)T-STATP-value
10.0853660.90750.18305
2-0.262378-2.78910.003102
3-0.506753-5.38690
4-0.159128-1.69150.046744
50.0926080.98440.163502
60.5161725.4870
70.0894840.95120.171759
8-0.151681-1.61240.054833
9-0.468626-4.98161e-06
10-0.250582-2.66370.004429
110.1537921.63480.052434
120.795728.45860
130.1004981.06830.14383
14-0.281795-2.99550.001684
15-0.416623-4.42881.1e-05
16-0.14443-1.53530.063751
170.0990451.05290.147325
180.4426614.70564e-06
190.1012381.07620.142071
20-0.168404-1.79020.038054
21-0.394018-4.18852.8e-05
22-0.247269-2.62850.004884
230.1998872.12480.01789
240.6269146.66420
250.0938110.99720.160393
26-0.257847-2.74090.003562
27-0.330763-3.51610.000316
28-0.12109-1.28720.100326
290.0958111.01850.155311
300.3605073.83220.000105
310.0923280.98150.164232
32-0.157787-1.67730.048124
33-0.347039-3.68910.000174
34-0.185501-1.97190.025532
350.1765961.87720.031532
360.5232165.56190
370.0677610.72030.23641
38-0.214654-2.28180.012187
39-0.290384-3.08680.001273
40-0.105309-1.11940.132662
410.1100131.16950.122341
420.307123.26470.000725
430.0801930.85250.197881
44-0.161247-1.71410.044628
45-0.287223-3.05320.001412
46-0.141307-1.50210.067928
470.1587851.68790.047094
480.4273934.54327e-06


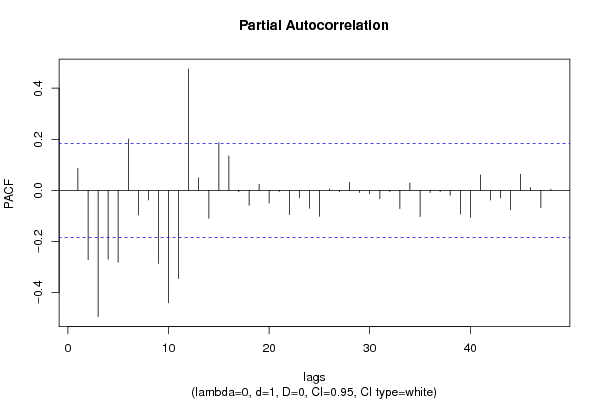
Partial Autocorrelation Function
Time lag kPACF(k)T-STATP-value
10.0853660.90750.18305
2-0.271645-2.88760.002326
3-0.494945-5.26130
4-0.269619-2.86610.002479
5-0.282142-2.99920.001665
60.2009242.13590.017425
7-0.096242-1.02310.154231
8-0.037602-0.39970.345062
9-0.286675-3.04740.001437
10-0.44085-4.68634e-06
11-0.345274-3.67030.000186
120.4755285.05491e-06
130.048680.51750.302918
14-0.109525-1.16430.123384
150.1861161.97840.025156
160.1346461.43130.077551
17-0.00518-0.05510.478091
18-0.058747-0.62450.266783
190.0237890.25290.400411
20-0.049535-0.52660.299765
21-0.004639-0.04930.480379
22-0.094778-1.00750.157923
23-0.02887-0.30690.379744
24-0.070514-0.74960.227536
25-0.101456-1.07850.141555
260.0054340.05780.477019
27-0.005856-0.06230.475237
280.0318740.33880.367683
29-0.008644-0.09190.463475
30-0.013741-0.14610.442064
31-0.033382-0.35490.361679
32-0.005719-0.06080.475815
33-0.071076-0.75550.225748
340.0286890.3050.380474
35-0.102577-1.09040.138926
36-0.008564-0.0910.463811
37-0.004599-0.04890.480549
38-0.019291-0.20510.418945
39-0.092723-0.98570.163203
40-0.106106-1.12790.130872
410.0599910.63770.262475
42-0.038-0.40390.343507
43-0.029662-0.31530.376555
44-0.075852-0.80630.210877
450.0630930.67070.251894
460.0111920.1190.452753
47-0.068377-0.72690.234408
480.0039430.04190.483319

\begin{tabular}{lllllllll}
\hline
Partial Autocorrelation Function \tabularnewline
Time lag k & PACF(k) & T-STAT & P-value \tabularnewline
1 & 0.085366 & 0.9075 & 0.18305 \tabularnewline
2 & -0.271645 & -2.8876 & 0.002326 \tabularnewline
3 & -0.494945 & -5.2613 & 0 \tabularnewline
4 & -0.269619 & -2.8661 & 0.002479 \tabularnewline
5 & -0.282142 & -2.9992 & 0.001665 \tabularnewline
6 & 0.200924 & 2.1359 & 0.017425 \tabularnewline
7 & -0.096242 & -1.0231 & 0.154231 \tabularnewline
8 & -0.037602 & -0.3997 & 0.345062 \tabularnewline
9 & -0.286675 & -3.0474 & 0.001437 \tabularnewline
10 & -0.44085 & -4.6863 & 4e-06 \tabularnewline
11 & -0.345274 & -3.6703 & 0.000186 \tabularnewline
12 & 0.475528 & 5.0549 & 1e-06 \tabularnewline
13 & 0.04868 & 0.5175 & 0.302918 \tabularnewline
14 & -0.109525 & -1.1643 & 0.123384 \tabularnewline
15 & 0.186116 & 1.9784 & 0.025156 \tabularnewline
16 & 0.134646 & 1.4313 & 0.077551 \tabularnewline
17 & -0.00518 & -0.0551 & 0.478091 \tabularnewline
18 & -0.058747 & -0.6245 & 0.266783 \tabularnewline
19 & 0.023789 & 0.2529 & 0.400411 \tabularnewline
20 & -0.049535 & -0.5266 & 0.299765 \tabularnewline
21 & -0.004639 & -0.0493 & 0.480379 \tabularnewline
22 & -0.094778 & -1.0075 & 0.157923 \tabularnewline
23 & -0.02887 & -0.3069 & 0.379744 \tabularnewline
24 & -0.070514 & -0.7496 & 0.227536 \tabularnewline
25 & -0.101456 & -1.0785 & 0.141555 \tabularnewline
26 & 0.005434 & 0.0578 & 0.477019 \tabularnewline
27 & -0.005856 & -0.0623 & 0.475237 \tabularnewline
28 & 0.031874 & 0.3388 & 0.367683 \tabularnewline
29 & -0.008644 & -0.0919 & 0.463475 \tabularnewline
30 & -0.013741 & -0.1461 & 0.442064 \tabularnewline
31 & -0.033382 & -0.3549 & 0.361679 \tabularnewline
32 & -0.005719 & -0.0608 & 0.475815 \tabularnewline
33 & -0.071076 & -0.7555 & 0.225748 \tabularnewline
34 & 0.028689 & 0.305 & 0.380474 \tabularnewline
35 & -0.102577 & -1.0904 & 0.138926 \tabularnewline
36 & -0.008564 & -0.091 & 0.463811 \tabularnewline
37 & -0.004599 & -0.0489 & 0.480549 \tabularnewline
38 & -0.019291 & -0.2051 & 0.418945 \tabularnewline
39 & -0.092723 & -0.9857 & 0.163203 \tabularnewline
40 & -0.106106 & -1.1279 & 0.130872 \tabularnewline
41 & 0.059991 & 0.6377 & 0.262475 \tabularnewline
42 & -0.038 & -0.4039 & 0.343507 \tabularnewline
43 & -0.029662 & -0.3153 & 0.376555 \tabularnewline
44 & -0.075852 & -0.8063 & 0.210877 \tabularnewline
45 & 0.063093 & 0.6707 & 0.251894 \tabularnewline
46 & 0.011192 & 0.119 & 0.452753 \tabularnewline
47 & -0.068377 & -0.7269 & 0.234408 \tabularnewline
48 & 0.003943 & 0.0419 & 0.483319 \tabularnewline
\hline
\end{tabular}
%Source: https://freestatistics.org/blog/index.php?pk=300652&T=2

[TABLE]
[ROW][C]Partial Autocorrelation Function[/C][/ROW]
[ROW][C]Time lag k[/C][C]PACF(k)[/C][C]T-STAT[/C][C]P-value[/C][/ROW]
[ROW][C]1[/C][C]0.085366[/C][C]0.9075[/C][C]0.18305[/C][/ROW]
[ROW][C]2[/C][C]-0.271645[/C][C]-2.8876[/C][C]0.002326[/C][/ROW]
[ROW][C]3[/C][C]-0.494945[/C][C]-5.2613[/C][C]0[/C][/ROW]
[ROW][C]4[/C][C]-0.269619[/C][C]-2.8661[/C][C]0.002479[/C][/ROW]
[ROW][C]5[/C][C]-0.282142[/C][C]-2.9992[/C][C]0.001665[/C][/ROW]
[ROW][C]6[/C][C]0.200924[/C][C]2.1359[/C][C]0.017425[/C][/ROW]
[ROW][C]7[/C][C]-0.096242[/C][C]-1.0231[/C][C]0.154231[/C][/ROW]
[ROW][C]8[/C][C]-0.037602[/C][C]-0.3997[/C][C]0.345062[/C][/ROW]
[ROW][C]9[/C][C]-0.286675[/C][C]-3.0474[/C][C]0.001437[/C][/ROW]
[ROW][C]10[/C][C]-0.44085[/C][C]-4.6863[/C][C]4e-06[/C][/ROW]
[ROW][C]11[/C][C]-0.345274[/C][C]-3.6703[/C][C]0.000186[/C][/ROW]
[ROW][C]12[/C][C]0.475528[/C][C]5.0549[/C][C]1e-06[/C][/ROW]
[ROW][C]13[/C][C]0.04868[/C][C]0.5175[/C][C]0.302918[/C][/ROW]
[ROW][C]14[/C][C]-0.109525[/C][C]-1.1643[/C][C]0.123384[/C][/ROW]
[ROW][C]15[/C][C]0.186116[/C][C]1.9784[/C][C]0.025156[/C][/ROW]
[ROW][C]16[/C][C]0.134646[/C][C]1.4313[/C][C]0.077551[/C][/ROW]
[ROW][C]17[/C][C]-0.00518[/C][C]-0.0551[/C][C]0.478091[/C][/ROW]
[ROW][C]18[/C][C]-0.058747[/C][C]-0.6245[/C][C]0.266783[/C][/ROW]
[ROW][C]19[/C][C]0.023789[/C][C]0.2529[/C][C]0.400411[/C][/ROW]
[ROW][C]20[/C][C]-0.049535[/C][C]-0.5266[/C][C]0.299765[/C][/ROW]
[ROW][C]21[/C][C]-0.004639[/C][C]-0.0493[/C][C]0.480379[/C][/ROW]
[ROW][C]22[/C][C]-0.094778[/C][C]-1.0075[/C][C]0.157923[/C][/ROW]
[ROW][C]23[/C][C]-0.02887[/C][C]-0.3069[/C][C]0.379744[/C][/ROW]
[ROW][C]24[/C][C]-0.070514[/C][C]-0.7496[/C][C]0.227536[/C][/ROW]
[ROW][C]25[/C][C]-0.101456[/C][C]-1.0785[/C][C]0.141555[/C][/ROW]
[ROW][C]26[/C][C]0.005434[/C][C]0.0578[/C][C]0.477019[/C][/ROW]
[ROW][C]27[/C][C]-0.005856[/C][C]-0.0623[/C][C]0.475237[/C][/ROW]
[ROW][C]28[/C][C]0.031874[/C][C]0.3388[/C][C]0.367683[/C][/ROW]
[ROW][C]29[/C][C]-0.008644[/C][C]-0.0919[/C][C]0.463475[/C][/ROW]
[ROW][C]30[/C][C]-0.013741[/C][C]-0.1461[/C][C]0.442064[/C][/ROW]
[ROW][C]31[/C][C]-0.033382[/C][C]-0.3549[/C][C]0.361679[/C][/ROW]
[ROW][C]32[/C][C]-0.005719[/C][C]-0.0608[/C][C]0.475815[/C][/ROW]
[ROW][C]33[/C][C]-0.071076[/C][C]-0.7555[/C][C]0.225748[/C][/ROW]
[ROW][C]34[/C][C]0.028689[/C][C]0.305[/C][C]0.380474[/C][/ROW]
[ROW][C]35[/C][C]-0.102577[/C][C]-1.0904[/C][C]0.138926[/C][/ROW]
[ROW][C]36[/C][C]-0.008564[/C][C]-0.091[/C][C]0.463811[/C][/ROW]
[ROW][C]37[/C][C]-0.004599[/C][C]-0.0489[/C][C]0.480549[/C][/ROW]
[ROW][C]38[/C][C]-0.019291[/C][C]-0.2051[/C][C]0.418945[/C][/ROW]
[ROW][C]39[/C][C]-0.092723[/C][C]-0.9857[/C][C]0.163203[/C][/ROW]
[ROW][C]40[/C][C]-0.106106[/C][C]-1.1279[/C][C]0.130872[/C][/ROW]
[ROW][C]41[/C][C]0.059991[/C][C]0.6377[/C][C]0.262475[/C][/ROW]
[ROW][C]42[/C][C]-0.038[/C][C]-0.4039[/C][C]0.343507[/C][/ROW]
[ROW][C]43[/C][C]-0.029662[/C][C]-0.3153[/C][C]0.376555[/C][/ROW]
[ROW][C]44[/C][C]-0.075852[/C][C]-0.8063[/C][C]0.210877[/C][/ROW]
[ROW][C]45[/C][C]0.063093[/C][C]0.6707[/C][C]0.251894[/C][/ROW]
[ROW][C]46[/C][C]0.011192[/C][C]0.119[/C][C]0.452753[/C][/ROW]
[ROW][C]47[/C][C]-0.068377[/C][C]-0.7269[/C][C]0.234408[/C][/ROW]
[ROW][C]48[/C][C]0.003943[/C][C]0.0419[/C][C]0.483319[/C][/ROW]
[/TABLE]
Source: https://freestatistics.org/blog/index.php?pk=300652&T=2

Globally Unique Identifier (entire table): ba.freestatistics.org/blog/index.php?pk=300652&T=2

As an alternative you can also use a QR Code:  

The GUIDs for individual cells are displayed in the table below:

Partial Autocorrelation Function
Time lag kPACF(k)T-STATP-value
10.0853660.90750.18305
2-0.271645-2.88760.002326
3-0.494945-5.26130
4-0.269619-2.86610.002479
5-0.282142-2.99920.001665
60.2009242.13590.017425
7-0.096242-1.02310.154231
8-0.037602-0.39970.345062
9-0.286675-3.04740.001437
10-0.44085-4.68634e-06
11-0.345274-3.67030.000186
120.4755285.05491e-06
130.048680.51750.302918
14-0.109525-1.16430.123384
150.1861161.97840.025156
160.1346461.43130.077551
17-0.00518-0.05510.478091
18-0.058747-0.62450.266783
190.0237890.25290.400411
20-0.049535-0.52660.299765
21-0.004639-0.04930.480379
22-0.094778-1.00750.157923
23-0.02887-0.30690.379744
24-0.070514-0.74960.227536
25-0.101456-1.07850.141555
260.0054340.05780.477019
27-0.005856-0.06230.475237
280.0318740.33880.367683
29-0.008644-0.09190.463475
30-0.013741-0.14610.442064
31-0.033382-0.35490.361679
32-0.005719-0.06080.475815
33-0.071076-0.75550.225748
340.0286890.3050.380474
35-0.102577-1.09040.138926
36-0.008564-0.0910.463811
37-0.004599-0.04890.480549
38-0.019291-0.20510.418945
39-0.092723-0.98570.163203
40-0.106106-1.12790.130872
410.0599910.63770.262475
42-0.038-0.40390.343507
43-0.029662-0.31530.376555
44-0.075852-0.80630.210877
450.0630930.67070.251894
460.0111920.1190.452753
47-0.068377-0.72690.234408
480.0039430.04190.483319


Parameters (Session):
par1 = 1 ; par2 = 0 ; par3 = 0 ; par4 = 1 ;
Parameters (R input):
par1 = 48 ; par2 = 0 ; par3 = 1 ; par4 = 0 ; par5 = 12 ; par6 = White Noise ; par7 = 0.95 ; par8 = ;
R code (references can be found in the software module):
par8 <- ''
par7 <- ''
par6 <- 'White Noise'
par5 <- '12'
par4 <- '0'
par3 <- '1'
par2 <- '0'
par1 <- '48'
if (par1 == 'Default') {
par1 = 10*log10(length(x))
} else {
par1 <- as.numeric(par1)
}
par2 <- as.numeric(par2)
par3 <- as.numeric(par3)
par4 <- as.numeric(par4)
par5 <- as.numeric(par5)
if (par6 == 'White Noise') par6 <- 'white' else par6 <- 'ma'
par7 <- as.numeric(par7)
if (par8 != '') par8 <- as.numeric(par8)
x <- na.omit(x)
ox <- x
if (par8 == '') {
if (par2 == 0) {
x <- log(x)
} else {
x <- (x ^ par2 - 1) / par2
}
} else {
x <- log(x,base=par8)
}
if (par3 > 0) x <- diff(x,lag=1,difference=par3)
if (par4 > 0) x <- diff(x,lag=par5,difference=par4)
bitmap(file='picts.png')
op <- par(mfrow=c(2,1))
plot(ox,type='l',main='Original Time Series',xlab='time',ylab='value')
if (par8=='') {
mytitle <- paste('Working Time Series (lambda=',par2,', d=',par3,', D=',par4,')',sep='')
mysub <- paste('(lambda=',par2,', d=',par3,', D=',par4,', CI=', par7, ', CI type=',par6,')',sep='')
} else {
mytitle <- paste('Working Time Series (base=',par8,', d=',par3,', D=',par4,')',sep='')
mysub <- paste('(base=',par8,', d=',par3,', D=',par4,', CI=', par7, ', CI type=',par6,')',sep='')
}
plot(x,type='l', main=mytitle,xlab='time',ylab='value')
par(op)
dev.off()
bitmap(file='pic1.png')
racf <- acf(x, par1, main='Autocorrelation', xlab='time lag', ylab='ACF', ci.type=par6, ci=par7, sub=mysub)
dev.off()
bitmap(file='pic2.png')
rpacf <- pacf(x,par1,main='Partial Autocorrelation',xlab='lags',ylab='PACF',sub=mysub)
dev.off()
(myacf <- c(racf$acf))
(mypacf <- c(rpacf$acf))
lengthx <- length(x)
sqrtn <- sqrt(lengthx)
load(file='createtable')
a<-table.start()
a<-table.row.start(a)
a<-table.element(a,'Autocorrelation Function',4,TRUE)
a<-table.row.end(a)
a<-table.row.start(a)
a<-table.element(a,'Time lag k',header=TRUE)
a<-table.element(a,'ACF(k)',header=TRUE)
a<-table.element(a,'T-STAT',header=TRUE)
a<-table.element(a,'P-value',header=TRUE)
a<-table.row.end(a)
for (i in 2:(par1+1)) {
a<-table.row.start(a)
a<-table.element(a,i-1,header=TRUE)
a<-table.element(a,round(myacf[i],6))
mytstat <- myacf[i]*sqrtn
a<-table.element(a,round(mytstat,4))
a<-table.element(a,round(1-pt(abs(mytstat),lengthx),6))
a<-table.row.end(a)
}
a<-table.end(a)
table.save(a,file='mytable.tab')
a<-table.start()
a<-table.row.start(a)
a<-table.element(a,'Partial Autocorrelation Function',4,TRUE)
a<-table.row.end(a)
a<-table.row.start(a)
a<-table.element(a,'Time lag k',header=TRUE)
a<-table.element(a,'PACF(k)',header=TRUE)
a<-table.element(a,'T-STAT',header=TRUE)
a<-table.element(a,'P-value',header=TRUE)
a<-table.row.end(a)
for (i in 1:par1) {
a<-table.row.start(a)
a<-table.element(a,i,header=TRUE)
a<-table.element(a,round(mypacf[i],6))
mytstat <- mypacf[i]*sqrtn
a<-table.element(a,round(mytstat,4))
a<-table.element(a,round(1-pt(abs(mytstat),lengthx),6))
a<-table.row.end(a)
}
a<-table.end(a)
table.save(a,file='mytable1.tab')