Free Statistics

of Irreproducible Research!

Author's title

Author*The author of this computation has been verified*
R Software Modulerwasp_autocorrelation.wasp
Title produced by software(Partial) Autocorrelation Function
Date of computationSat, 17 Dec 2016 10:52:56 +0100
Cite this page as followsStatistical Computations at FreeStatistics.org, Office for Research Development and Education, URL https://freestatistics.org/blog/index.php?v=date/2016/Dec/17/t1481968502w30w4is7dfguk8l.htm/, Retrieved Wed, 01 May 2024 23:29:21 +0000
Statistical Computations at FreeStatistics.org, Office for Research Development and Education, URL https://freestatistics.org/blog/index.php?pk=300656, Retrieved Wed, 01 May 2024 23:29:21 +0000
QR Codes:

Original text written by user:
IsPrivate?No (this computation is public)
User-defined keywords
Estimated Impact74
Family? (F = Feedback message, R = changed R code, M = changed R Module, P = changed Parameters, D = changed Data)
-       [(Partial) Autocorrelation Function] [partial autocorre...] [2016-12-17 09:52:56] [e4ec2dc388263dc7bca2f210fca20b5e] [Current]
Feedback Forum

Post a new message
Dataseries X:
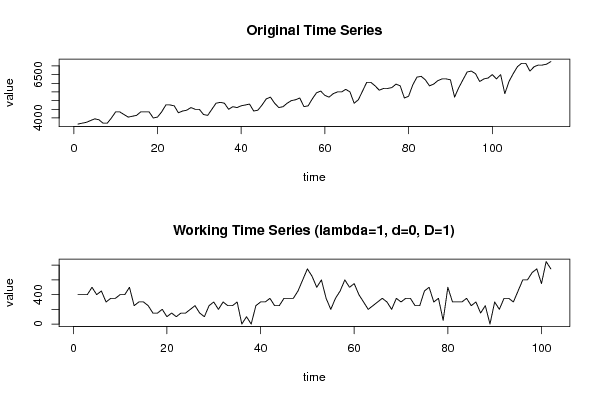
3650
3700
3750
3850
3950
3900
3700
3700
4000
4350
4350
4200
4050
4100
4150
4350
4350
4350
4000
4050
4350
4750
4750
4700
4300
4400
4450
4600
4500
4500
4200
4150
4500
4850
4900
4850
4500
4650
4600
4700
4750
4800
4400
4450
4750
5100
5200
4850
4600
4650
4850
5000
5050
5150
4650
4700
5100
5450
5550
5300
5200
5400
5500
5500
5650
5500
4850
5050
5550
6050
6050
5850
5600
5700
5700
5750
5950
5850
5150
5250
5900
6350
6400
6200
5850
5950
6150
6250
6250
6200
5200
5750
6200
6650
6700
6550
6100
6250
6300
6500
6250
6500
5400
6100
6550
6950
7150
7150
6700
6950
7050
7050
7100
7250


Summary of computational transaction
Raw Input view raw input (R code)
Raw Outputview raw output of R engine
Computing time1 seconds
R ServerBig Analytics Cloud Computing Center

\begin{tabular}{lllllllll}
\hline
Summary of computational transaction \tabularnewline
Raw Input view raw input (R code)  \tabularnewline
Raw Outputview raw output of R engine  \tabularnewline
Computing time1 seconds \tabularnewline
R ServerBig Analytics Cloud Computing Center \tabularnewline
\hline
\end{tabular}
%Source: https://freestatistics.org/blog/index.php?pk=300656&T=0

[TABLE]
[ROW]
Summary of computational transaction[/C][/ROW] [ROW]Raw Input[/C] view raw input (R code) [/C][/ROW] [ROW]Raw Output[/C]view raw output of R engine [/C][/ROW] [ROW]Computing time[/C]1 seconds[/C][/ROW] [ROW]R Server[/C]Big Analytics Cloud Computing Center[/C][/ROW] [/TABLE] Source: https://freestatistics.org/blog/index.php?pk=300656&T=0

Globally Unique Identifier (entire table): ba.freestatistics.org/blog/index.php?pk=300656&T=0

As an alternative you can also use a QR Code:  

The GUIDs for individual cells are displayed in the table below:

Summary of computational transaction
Raw Input view raw input (R code)
Raw Outputview raw output of R engine
Computing time1 seconds
R ServerBig Analytics Cloud Computing Center


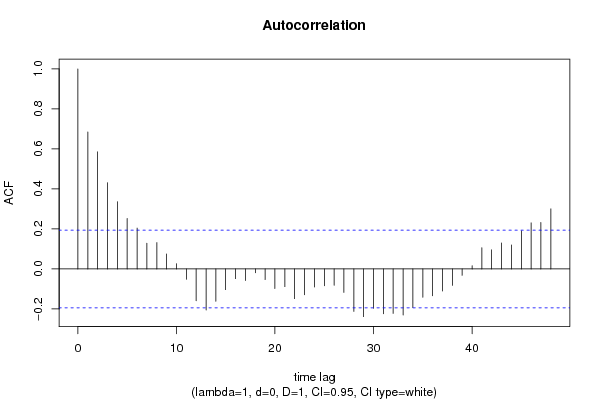
Autocorrelation Function
Time lag kACF(k)T-STATP-value
10.6846966.91510
20.5855175.91340
30.430784.35071.6e-05
40.3359863.39330.000492
50.2524382.54950.006138
60.2042082.06240.020855
70.1286381.29920.098405
80.1315991.32910.093393
90.0747720.75520.225948
100.0262320.26490.395798
11-0.051246-0.51760.302943
12-0.159177-1.60760.055506
13-0.205-2.07040.020471
14-0.161923-1.63530.05253
15-0.103388-1.04420.149438
16-0.048516-0.490.312598
17-0.057902-0.58480.279994
18-0.018815-0.190.424837
19-0.053236-0.53770.295991
20-0.09746-0.98430.16365
21-0.088429-0.89310.186955
22-0.148438-1.49910.068462
23-0.12897-1.30250.097833
24-0.090674-0.91580.180976
25-0.083879-0.84710.199451
26-0.081469-0.82280.206271
27-0.11725-1.18420.11955
28-0.212181-2.14290.017249
29-0.23847-2.40840.008908
30-0.196597-1.98550.024885
31-0.224003-2.26230.012899
32-0.222075-2.24280.013535
33-0.230188-2.32480.011032
34-0.192941-1.94860.027045
35-0.141181-1.42590.078482
36-0.134059-1.35390.089375
37-0.110121-1.11220.13434
38-0.081953-0.82770.204892
39-0.031947-0.32260.373813
400.0163060.16470.434761
410.106171.07230.143066
420.095340.96290.168941
430.129871.31160.096295
440.1199171.21110.114327
450.1905571.92450.028537
460.230352.32640.010987
470.2320372.34350.010523
480.3006143.03610.001521

\begin{tabular}{lllllllll}
\hline
Autocorrelation Function \tabularnewline
Time lag k & ACF(k) & T-STAT & P-value \tabularnewline
1 & 0.684696 & 6.9151 & 0 \tabularnewline
2 & 0.585517 & 5.9134 & 0 \tabularnewline
3 & 0.43078 & 4.3507 & 1.6e-05 \tabularnewline
4 & 0.335986 & 3.3933 & 0.000492 \tabularnewline
5 & 0.252438 & 2.5495 & 0.006138 \tabularnewline
6 & 0.204208 & 2.0624 & 0.020855 \tabularnewline
7 & 0.128638 & 1.2992 & 0.098405 \tabularnewline
8 & 0.131599 & 1.3291 & 0.093393 \tabularnewline
9 & 0.074772 & 0.7552 & 0.225948 \tabularnewline
10 & 0.026232 & 0.2649 & 0.395798 \tabularnewline
11 & -0.051246 & -0.5176 & 0.302943 \tabularnewline
12 & -0.159177 & -1.6076 & 0.055506 \tabularnewline
13 & -0.205 & -2.0704 & 0.020471 \tabularnewline
14 & -0.161923 & -1.6353 & 0.05253 \tabularnewline
15 & -0.103388 & -1.0442 & 0.149438 \tabularnewline
16 & -0.048516 & -0.49 & 0.312598 \tabularnewline
17 & -0.057902 & -0.5848 & 0.279994 \tabularnewline
18 & -0.018815 & -0.19 & 0.424837 \tabularnewline
19 & -0.053236 & -0.5377 & 0.295991 \tabularnewline
20 & -0.09746 & -0.9843 & 0.16365 \tabularnewline
21 & -0.088429 & -0.8931 & 0.186955 \tabularnewline
22 & -0.148438 & -1.4991 & 0.068462 \tabularnewline
23 & -0.12897 & -1.3025 & 0.097833 \tabularnewline
24 & -0.090674 & -0.9158 & 0.180976 \tabularnewline
25 & -0.083879 & -0.8471 & 0.199451 \tabularnewline
26 & -0.081469 & -0.8228 & 0.206271 \tabularnewline
27 & -0.11725 & -1.1842 & 0.11955 \tabularnewline
28 & -0.212181 & -2.1429 & 0.017249 \tabularnewline
29 & -0.23847 & -2.4084 & 0.008908 \tabularnewline
30 & -0.196597 & -1.9855 & 0.024885 \tabularnewline
31 & -0.224003 & -2.2623 & 0.012899 \tabularnewline
32 & -0.222075 & -2.2428 & 0.013535 \tabularnewline
33 & -0.230188 & -2.3248 & 0.011032 \tabularnewline
34 & -0.192941 & -1.9486 & 0.027045 \tabularnewline
35 & -0.141181 & -1.4259 & 0.078482 \tabularnewline
36 & -0.134059 & -1.3539 & 0.089375 \tabularnewline
37 & -0.110121 & -1.1122 & 0.13434 \tabularnewline
38 & -0.081953 & -0.8277 & 0.204892 \tabularnewline
39 & -0.031947 & -0.3226 & 0.373813 \tabularnewline
40 & 0.016306 & 0.1647 & 0.434761 \tabularnewline
41 & 0.10617 & 1.0723 & 0.143066 \tabularnewline
42 & 0.09534 & 0.9629 & 0.168941 \tabularnewline
43 & 0.12987 & 1.3116 & 0.096295 \tabularnewline
44 & 0.119917 & 1.2111 & 0.114327 \tabularnewline
45 & 0.190557 & 1.9245 & 0.028537 \tabularnewline
46 & 0.23035 & 2.3264 & 0.010987 \tabularnewline
47 & 0.232037 & 2.3435 & 0.010523 \tabularnewline
48 & 0.300614 & 3.0361 & 0.001521 \tabularnewline
\hline
\end{tabular}
%Source: https://freestatistics.org/blog/index.php?pk=300656&T=1

[TABLE]
[ROW][C]Autocorrelation Function[/C][/ROW]
[ROW][C]Time lag k[/C][C]ACF(k)[/C][C]T-STAT[/C][C]P-value[/C][/ROW]
[ROW][C]1[/C][C]0.684696[/C][C]6.9151[/C][C]0[/C][/ROW]
[ROW][C]2[/C][C]0.585517[/C][C]5.9134[/C][C]0[/C][/ROW]
[ROW][C]3[/C][C]0.43078[/C][C]4.3507[/C][C]1.6e-05[/C][/ROW]
[ROW][C]4[/C][C]0.335986[/C][C]3.3933[/C][C]0.000492[/C][/ROW]
[ROW][C]5[/C][C]0.252438[/C][C]2.5495[/C][C]0.006138[/C][/ROW]
[ROW][C]6[/C][C]0.204208[/C][C]2.0624[/C][C]0.020855[/C][/ROW]
[ROW][C]7[/C][C]0.128638[/C][C]1.2992[/C][C]0.098405[/C][/ROW]
[ROW][C]8[/C][C]0.131599[/C][C]1.3291[/C][C]0.093393[/C][/ROW]
[ROW][C]9[/C][C]0.074772[/C][C]0.7552[/C][C]0.225948[/C][/ROW]
[ROW][C]10[/C][C]0.026232[/C][C]0.2649[/C][C]0.395798[/C][/ROW]
[ROW][C]11[/C][C]-0.051246[/C][C]-0.5176[/C][C]0.302943[/C][/ROW]
[ROW][C]12[/C][C]-0.159177[/C][C]-1.6076[/C][C]0.055506[/C][/ROW]
[ROW][C]13[/C][C]-0.205[/C][C]-2.0704[/C][C]0.020471[/C][/ROW]
[ROW][C]14[/C][C]-0.161923[/C][C]-1.6353[/C][C]0.05253[/C][/ROW]
[ROW][C]15[/C][C]-0.103388[/C][C]-1.0442[/C][C]0.149438[/C][/ROW]
[ROW][C]16[/C][C]-0.048516[/C][C]-0.49[/C][C]0.312598[/C][/ROW]
[ROW][C]17[/C][C]-0.057902[/C][C]-0.5848[/C][C]0.279994[/C][/ROW]
[ROW][C]18[/C][C]-0.018815[/C][C]-0.19[/C][C]0.424837[/C][/ROW]
[ROW][C]19[/C][C]-0.053236[/C][C]-0.5377[/C][C]0.295991[/C][/ROW]
[ROW][C]20[/C][C]-0.09746[/C][C]-0.9843[/C][C]0.16365[/C][/ROW]
[ROW][C]21[/C][C]-0.088429[/C][C]-0.8931[/C][C]0.186955[/C][/ROW]
[ROW][C]22[/C][C]-0.148438[/C][C]-1.4991[/C][C]0.068462[/C][/ROW]
[ROW][C]23[/C][C]-0.12897[/C][C]-1.3025[/C][C]0.097833[/C][/ROW]
[ROW][C]24[/C][C]-0.090674[/C][C]-0.9158[/C][C]0.180976[/C][/ROW]
[ROW][C]25[/C][C]-0.083879[/C][C]-0.8471[/C][C]0.199451[/C][/ROW]
[ROW][C]26[/C][C]-0.081469[/C][C]-0.8228[/C][C]0.206271[/C][/ROW]
[ROW][C]27[/C][C]-0.11725[/C][C]-1.1842[/C][C]0.11955[/C][/ROW]
[ROW][C]28[/C][C]-0.212181[/C][C]-2.1429[/C][C]0.017249[/C][/ROW]
[ROW][C]29[/C][C]-0.23847[/C][C]-2.4084[/C][C]0.008908[/C][/ROW]
[ROW][C]30[/C][C]-0.196597[/C][C]-1.9855[/C][C]0.024885[/C][/ROW]
[ROW][C]31[/C][C]-0.224003[/C][C]-2.2623[/C][C]0.012899[/C][/ROW]
[ROW][C]32[/C][C]-0.222075[/C][C]-2.2428[/C][C]0.013535[/C][/ROW]
[ROW][C]33[/C][C]-0.230188[/C][C]-2.3248[/C][C]0.011032[/C][/ROW]
[ROW][C]34[/C][C]-0.192941[/C][C]-1.9486[/C][C]0.027045[/C][/ROW]
[ROW][C]35[/C][C]-0.141181[/C][C]-1.4259[/C][C]0.078482[/C][/ROW]
[ROW][C]36[/C][C]-0.134059[/C][C]-1.3539[/C][C]0.089375[/C][/ROW]
[ROW][C]37[/C][C]-0.110121[/C][C]-1.1122[/C][C]0.13434[/C][/ROW]
[ROW][C]38[/C][C]-0.081953[/C][C]-0.8277[/C][C]0.204892[/C][/ROW]
[ROW][C]39[/C][C]-0.031947[/C][C]-0.3226[/C][C]0.373813[/C][/ROW]
[ROW][C]40[/C][C]0.016306[/C][C]0.1647[/C][C]0.434761[/C][/ROW]
[ROW][C]41[/C][C]0.10617[/C][C]1.0723[/C][C]0.143066[/C][/ROW]
[ROW][C]42[/C][C]0.09534[/C][C]0.9629[/C][C]0.168941[/C][/ROW]
[ROW][C]43[/C][C]0.12987[/C][C]1.3116[/C][C]0.096295[/C][/ROW]
[ROW][C]44[/C][C]0.119917[/C][C]1.2111[/C][C]0.114327[/C][/ROW]
[ROW][C]45[/C][C]0.190557[/C][C]1.9245[/C][C]0.028537[/C][/ROW]
[ROW][C]46[/C][C]0.23035[/C][C]2.3264[/C][C]0.010987[/C][/ROW]
[ROW][C]47[/C][C]0.232037[/C][C]2.3435[/C][C]0.010523[/C][/ROW]
[ROW][C]48[/C][C]0.300614[/C][C]3.0361[/C][C]0.001521[/C][/ROW]
[/TABLE]
Source: https://freestatistics.org/blog/index.php?pk=300656&T=1

Globally Unique Identifier (entire table): ba.freestatistics.org/blog/index.php?pk=300656&T=1

As an alternative you can also use a QR Code:  

The GUIDs for individual cells are displayed in the table below:

Autocorrelation Function
Time lag kACF(k)T-STATP-value
10.6846966.91510
20.5855175.91340
30.430784.35071.6e-05
40.3359863.39330.000492
50.2524382.54950.006138
60.2042082.06240.020855
70.1286381.29920.098405
80.1315991.32910.093393
90.0747720.75520.225948
100.0262320.26490.395798
11-0.051246-0.51760.302943
12-0.159177-1.60760.055506
13-0.205-2.07040.020471
14-0.161923-1.63530.05253
15-0.103388-1.04420.149438
16-0.048516-0.490.312598
17-0.057902-0.58480.279994
18-0.018815-0.190.424837
19-0.053236-0.53770.295991
20-0.09746-0.98430.16365
21-0.088429-0.89310.186955
22-0.148438-1.49910.068462
23-0.12897-1.30250.097833
24-0.090674-0.91580.180976
25-0.083879-0.84710.199451
26-0.081469-0.82280.206271
27-0.11725-1.18420.11955
28-0.212181-2.14290.017249
29-0.23847-2.40840.008908
30-0.196597-1.98550.024885
31-0.224003-2.26230.012899
32-0.222075-2.24280.013535
33-0.230188-2.32480.011032
34-0.192941-1.94860.027045
35-0.141181-1.42590.078482
36-0.134059-1.35390.089375
37-0.110121-1.11220.13434
38-0.081953-0.82770.204892
39-0.031947-0.32260.373813
400.0163060.16470.434761
410.106171.07230.143066
420.095340.96290.168941
430.129871.31160.096295
440.1199171.21110.114327
450.1905571.92450.028537
460.230352.32640.010987
470.2320372.34350.010523
480.3006143.03610.001521


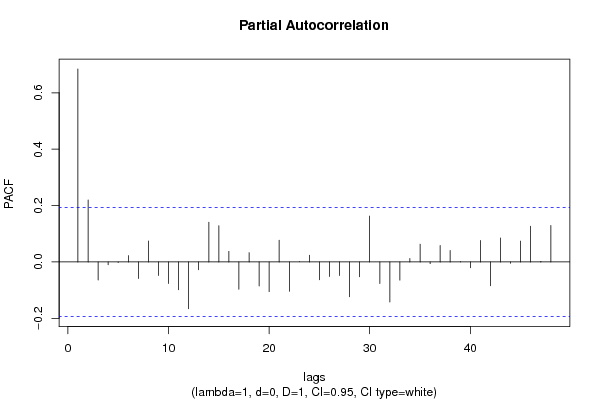
Partial Autocorrelation Function
Time lag kPACF(k)T-STATP-value
10.6846966.91510
20.2197112.2190.014352
3-0.064233-0.64870.258987
4-0.00993-0.10030.460154
5-0.001768-0.01790.492893
60.0225820.22810.410025
7-0.058985-0.59570.276342
80.0742710.75010.22746
9-0.048249-0.48730.313549
10-0.076192-0.76950.221686
11-0.098875-0.99860.160178
12-0.166037-1.67690.048313
13-0.027648-0.27920.390318
140.1410751.42480.078635
150.1282051.29480.099155
160.0374510.37820.35302
17-0.097139-0.98110.164444
180.0329860.33310.369857
19-0.085307-0.86160.195475
20-0.105384-1.06430.144847
210.0772680.78040.218491
22-0.103801-1.04830.148481
230.0004210.00420.498309
240.0237880.24030.405309
25-0.062896-0.63520.263356
26-0.051779-0.52290.301073
27-0.048019-0.4850.314368
28-0.12355-1.24780.107482
29-0.052565-0.53090.298327
300.162671.64290.051743
31-0.076541-0.7730.220648
32-0.142071-1.43490.077194
33-0.064512-0.65150.25808
340.012510.12630.449854
350.0631580.63790.262496
36-0.005917-0.05980.476233
370.058680.59260.277368
380.0408020.41210.340572
390.0007110.00720.497141
40-0.020498-0.2070.418204
410.0762610.77020.22148
42-0.084641-0.85480.197323
430.0847920.85640.196903
44-0.004923-0.04970.480222
450.0738830.74620.228636
460.1265021.27760.102144
470.0021430.02160.491387
480.1296021.30890.096752

\begin{tabular}{lllllllll}
\hline
Partial Autocorrelation Function \tabularnewline
Time lag k & PACF(k) & T-STAT & P-value \tabularnewline
1 & 0.684696 & 6.9151 & 0 \tabularnewline
2 & 0.219711 & 2.219 & 0.014352 \tabularnewline
3 & -0.064233 & -0.6487 & 0.258987 \tabularnewline
4 & -0.00993 & -0.1003 & 0.460154 \tabularnewline
5 & -0.001768 & -0.0179 & 0.492893 \tabularnewline
6 & 0.022582 & 0.2281 & 0.410025 \tabularnewline
7 & -0.058985 & -0.5957 & 0.276342 \tabularnewline
8 & 0.074271 & 0.7501 & 0.22746 \tabularnewline
9 & -0.048249 & -0.4873 & 0.313549 \tabularnewline
10 & -0.076192 & -0.7695 & 0.221686 \tabularnewline
11 & -0.098875 & -0.9986 & 0.160178 \tabularnewline
12 & -0.166037 & -1.6769 & 0.048313 \tabularnewline
13 & -0.027648 & -0.2792 & 0.390318 \tabularnewline
14 & 0.141075 & 1.4248 & 0.078635 \tabularnewline
15 & 0.128205 & 1.2948 & 0.099155 \tabularnewline
16 & 0.037451 & 0.3782 & 0.35302 \tabularnewline
17 & -0.097139 & -0.9811 & 0.164444 \tabularnewline
18 & 0.032986 & 0.3331 & 0.369857 \tabularnewline
19 & -0.085307 & -0.8616 & 0.195475 \tabularnewline
20 & -0.105384 & -1.0643 & 0.144847 \tabularnewline
21 & 0.077268 & 0.7804 & 0.218491 \tabularnewline
22 & -0.103801 & -1.0483 & 0.148481 \tabularnewline
23 & 0.000421 & 0.0042 & 0.498309 \tabularnewline
24 & 0.023788 & 0.2403 & 0.405309 \tabularnewline
25 & -0.062896 & -0.6352 & 0.263356 \tabularnewline
26 & -0.051779 & -0.5229 & 0.301073 \tabularnewline
27 & -0.048019 & -0.485 & 0.314368 \tabularnewline
28 & -0.12355 & -1.2478 & 0.107482 \tabularnewline
29 & -0.052565 & -0.5309 & 0.298327 \tabularnewline
30 & 0.16267 & 1.6429 & 0.051743 \tabularnewline
31 & -0.076541 & -0.773 & 0.220648 \tabularnewline
32 & -0.142071 & -1.4349 & 0.077194 \tabularnewline
33 & -0.064512 & -0.6515 & 0.25808 \tabularnewline
34 & 0.01251 & 0.1263 & 0.449854 \tabularnewline
35 & 0.063158 & 0.6379 & 0.262496 \tabularnewline
36 & -0.005917 & -0.0598 & 0.476233 \tabularnewline
37 & 0.05868 & 0.5926 & 0.277368 \tabularnewline
38 & 0.040802 & 0.4121 & 0.340572 \tabularnewline
39 & 0.000711 & 0.0072 & 0.497141 \tabularnewline
40 & -0.020498 & -0.207 & 0.418204 \tabularnewline
41 & 0.076261 & 0.7702 & 0.22148 \tabularnewline
42 & -0.084641 & -0.8548 & 0.197323 \tabularnewline
43 & 0.084792 & 0.8564 & 0.196903 \tabularnewline
44 & -0.004923 & -0.0497 & 0.480222 \tabularnewline
45 & 0.073883 & 0.7462 & 0.228636 \tabularnewline
46 & 0.126502 & 1.2776 & 0.102144 \tabularnewline
47 & 0.002143 & 0.0216 & 0.491387 \tabularnewline
48 & 0.129602 & 1.3089 & 0.096752 \tabularnewline
\hline
\end{tabular}
%Source: https://freestatistics.org/blog/index.php?pk=300656&T=2

[TABLE]
[ROW][C]Partial Autocorrelation Function[/C][/ROW]
[ROW][C]Time lag k[/C][C]PACF(k)[/C][C]T-STAT[/C][C]P-value[/C][/ROW]
[ROW][C]1[/C][C]0.684696[/C][C]6.9151[/C][C]0[/C][/ROW]
[ROW][C]2[/C][C]0.219711[/C][C]2.219[/C][C]0.014352[/C][/ROW]
[ROW][C]3[/C][C]-0.064233[/C][C]-0.6487[/C][C]0.258987[/C][/ROW]
[ROW][C]4[/C][C]-0.00993[/C][C]-0.1003[/C][C]0.460154[/C][/ROW]
[ROW][C]5[/C][C]-0.001768[/C][C]-0.0179[/C][C]0.492893[/C][/ROW]
[ROW][C]6[/C][C]0.022582[/C][C]0.2281[/C][C]0.410025[/C][/ROW]
[ROW][C]7[/C][C]-0.058985[/C][C]-0.5957[/C][C]0.276342[/C][/ROW]
[ROW][C]8[/C][C]0.074271[/C][C]0.7501[/C][C]0.22746[/C][/ROW]
[ROW][C]9[/C][C]-0.048249[/C][C]-0.4873[/C][C]0.313549[/C][/ROW]
[ROW][C]10[/C][C]-0.076192[/C][C]-0.7695[/C][C]0.221686[/C][/ROW]
[ROW][C]11[/C][C]-0.098875[/C][C]-0.9986[/C][C]0.160178[/C][/ROW]
[ROW][C]12[/C][C]-0.166037[/C][C]-1.6769[/C][C]0.048313[/C][/ROW]
[ROW][C]13[/C][C]-0.027648[/C][C]-0.2792[/C][C]0.390318[/C][/ROW]
[ROW][C]14[/C][C]0.141075[/C][C]1.4248[/C][C]0.078635[/C][/ROW]
[ROW][C]15[/C][C]0.128205[/C][C]1.2948[/C][C]0.099155[/C][/ROW]
[ROW][C]16[/C][C]0.037451[/C][C]0.3782[/C][C]0.35302[/C][/ROW]
[ROW][C]17[/C][C]-0.097139[/C][C]-0.9811[/C][C]0.164444[/C][/ROW]
[ROW][C]18[/C][C]0.032986[/C][C]0.3331[/C][C]0.369857[/C][/ROW]
[ROW][C]19[/C][C]-0.085307[/C][C]-0.8616[/C][C]0.195475[/C][/ROW]
[ROW][C]20[/C][C]-0.105384[/C][C]-1.0643[/C][C]0.144847[/C][/ROW]
[ROW][C]21[/C][C]0.077268[/C][C]0.7804[/C][C]0.218491[/C][/ROW]
[ROW][C]22[/C][C]-0.103801[/C][C]-1.0483[/C][C]0.148481[/C][/ROW]
[ROW][C]23[/C][C]0.000421[/C][C]0.0042[/C][C]0.498309[/C][/ROW]
[ROW][C]24[/C][C]0.023788[/C][C]0.2403[/C][C]0.405309[/C][/ROW]
[ROW][C]25[/C][C]-0.062896[/C][C]-0.6352[/C][C]0.263356[/C][/ROW]
[ROW][C]26[/C][C]-0.051779[/C][C]-0.5229[/C][C]0.301073[/C][/ROW]
[ROW][C]27[/C][C]-0.048019[/C][C]-0.485[/C][C]0.314368[/C][/ROW]
[ROW][C]28[/C][C]-0.12355[/C][C]-1.2478[/C][C]0.107482[/C][/ROW]
[ROW][C]29[/C][C]-0.052565[/C][C]-0.5309[/C][C]0.298327[/C][/ROW]
[ROW][C]30[/C][C]0.16267[/C][C]1.6429[/C][C]0.051743[/C][/ROW]
[ROW][C]31[/C][C]-0.076541[/C][C]-0.773[/C][C]0.220648[/C][/ROW]
[ROW][C]32[/C][C]-0.142071[/C][C]-1.4349[/C][C]0.077194[/C][/ROW]
[ROW][C]33[/C][C]-0.064512[/C][C]-0.6515[/C][C]0.25808[/C][/ROW]
[ROW][C]34[/C][C]0.01251[/C][C]0.1263[/C][C]0.449854[/C][/ROW]
[ROW][C]35[/C][C]0.063158[/C][C]0.6379[/C][C]0.262496[/C][/ROW]
[ROW][C]36[/C][C]-0.005917[/C][C]-0.0598[/C][C]0.476233[/C][/ROW]
[ROW][C]37[/C][C]0.05868[/C][C]0.5926[/C][C]0.277368[/C][/ROW]
[ROW][C]38[/C][C]0.040802[/C][C]0.4121[/C][C]0.340572[/C][/ROW]
[ROW][C]39[/C][C]0.000711[/C][C]0.0072[/C][C]0.497141[/C][/ROW]
[ROW][C]40[/C][C]-0.020498[/C][C]-0.207[/C][C]0.418204[/C][/ROW]
[ROW][C]41[/C][C]0.076261[/C][C]0.7702[/C][C]0.22148[/C][/ROW]
[ROW][C]42[/C][C]-0.084641[/C][C]-0.8548[/C][C]0.197323[/C][/ROW]
[ROW][C]43[/C][C]0.084792[/C][C]0.8564[/C][C]0.196903[/C][/ROW]
[ROW][C]44[/C][C]-0.004923[/C][C]-0.0497[/C][C]0.480222[/C][/ROW]
[ROW][C]45[/C][C]0.073883[/C][C]0.7462[/C][C]0.228636[/C][/ROW]
[ROW][C]46[/C][C]0.126502[/C][C]1.2776[/C][C]0.102144[/C][/ROW]
[ROW][C]47[/C][C]0.002143[/C][C]0.0216[/C][C]0.491387[/C][/ROW]
[ROW][C]48[/C][C]0.129602[/C][C]1.3089[/C][C]0.096752[/C][/ROW]
[/TABLE]
Source: https://freestatistics.org/blog/index.php?pk=300656&T=2

Globally Unique Identifier (entire table): ba.freestatistics.org/blog/index.php?pk=300656&T=2

As an alternative you can also use a QR Code:  

The GUIDs for individual cells are displayed in the table below:

Partial Autocorrelation Function
Time lag kPACF(k)T-STATP-value
10.6846966.91510
20.2197112.2190.014352
3-0.064233-0.64870.258987
4-0.00993-0.10030.460154
5-0.001768-0.01790.492893
60.0225820.22810.410025
7-0.058985-0.59570.276342
80.0742710.75010.22746
9-0.048249-0.48730.313549
10-0.076192-0.76950.221686
11-0.098875-0.99860.160178
12-0.166037-1.67690.048313
13-0.027648-0.27920.390318
140.1410751.42480.078635
150.1282051.29480.099155
160.0374510.37820.35302
17-0.097139-0.98110.164444
180.0329860.33310.369857
19-0.085307-0.86160.195475
20-0.105384-1.06430.144847
210.0772680.78040.218491
22-0.103801-1.04830.148481
230.0004210.00420.498309
240.0237880.24030.405309
25-0.062896-0.63520.263356
26-0.051779-0.52290.301073
27-0.048019-0.4850.314368
28-0.12355-1.24780.107482
29-0.052565-0.53090.298327
300.162671.64290.051743
31-0.076541-0.7730.220648
32-0.142071-1.43490.077194
33-0.064512-0.65150.25808
340.012510.12630.449854
350.0631580.63790.262496
36-0.005917-0.05980.476233
370.058680.59260.277368
380.0408020.41210.340572
390.0007110.00720.497141
40-0.020498-0.2070.418204
410.0762610.77020.22148
42-0.084641-0.85480.197323
430.0847920.85640.196903
44-0.004923-0.04970.480222
450.0738830.74620.228636
460.1265021.27760.102144
470.0021430.02160.491387
480.1296021.30890.096752


Parameters (Session):
par1 = 1 ; par2 = 0 ; par3 = 0 ; par4 = 1 ;
Parameters (R input):
par1 = 48 ; par2 = 1 ; par3 = 0 ; par4 = 1 ; par5 = 12 ; par6 = White Noise ; par7 = 0.95 ; par8 = ;
R code (references can be found in the software module):
par8 <- ''
par7 <- '0.95'
par6 <- 'White Noise'
par5 <- '12'
par4 <- '1'
par3 <- '0'
par2 <- '0'
par1 <- '48'
if (par1 == 'Default') {
par1 = 10*log10(length(x))
} else {
par1 <- as.numeric(par1)
}
par2 <- as.numeric(par2)
par3 <- as.numeric(par3)
par4 <- as.numeric(par4)
par5 <- as.numeric(par5)
if (par6 == 'White Noise') par6 <- 'white' else par6 <- 'ma'
par7 <- as.numeric(par7)
if (par8 != '') par8 <- as.numeric(par8)
x <- na.omit(x)
ox <- x
if (par8 == '') {
if (par2 == 0) {
x <- log(x)
} else {
x <- (x ^ par2 - 1) / par2
}
} else {
x <- log(x,base=par8)
}
if (par3 > 0) x <- diff(x,lag=1,difference=par3)
if (par4 > 0) x <- diff(x,lag=par5,difference=par4)
bitmap(file='picts.png')
op <- par(mfrow=c(2,1))
plot(ox,type='l',main='Original Time Series',xlab='time',ylab='value')
if (par8=='') {
mytitle <- paste('Working Time Series (lambda=',par2,', d=',par3,', D=',par4,')',sep='')
mysub <- paste('(lambda=',par2,', d=',par3,', D=',par4,', CI=', par7, ', CI type=',par6,')',sep='')
} else {
mytitle <- paste('Working Time Series (base=',par8,', d=',par3,', D=',par4,')',sep='')
mysub <- paste('(base=',par8,', d=',par3,', D=',par4,', CI=', par7, ', CI type=',par6,')',sep='')
}
plot(x,type='l', main=mytitle,xlab='time',ylab='value')
par(op)
dev.off()
bitmap(file='pic1.png')
racf <- acf(x, par1, main='Autocorrelation', xlab='time lag', ylab='ACF', ci.type=par6, ci=par7, sub=mysub)
dev.off()
bitmap(file='pic2.png')
rpacf <- pacf(x,par1,main='Partial Autocorrelation',xlab='lags',ylab='PACF',sub=mysub)
dev.off()
(myacf <- c(racf$acf))
(mypacf <- c(rpacf$acf))
lengthx <- length(x)
sqrtn <- sqrt(lengthx)
load(file='createtable')
a<-table.start()
a<-table.row.start(a)
a<-table.element(a,'Autocorrelation Function',4,TRUE)
a<-table.row.end(a)
a<-table.row.start(a)
a<-table.element(a,'Time lag k',header=TRUE)
a<-table.element(a,'ACF(k)',header=TRUE)
a<-table.element(a,'T-STAT',header=TRUE)
a<-table.element(a,'P-value',header=TRUE)
a<-table.row.end(a)
for (i in 2:(par1+1)) {
a<-table.row.start(a)
a<-table.element(a,i-1,header=TRUE)
a<-table.element(a,round(myacf[i],6))
mytstat <- myacf[i]*sqrtn
a<-table.element(a,round(mytstat,4))
a<-table.element(a,round(1-pt(abs(mytstat),lengthx),6))
a<-table.row.end(a)
}
a<-table.end(a)
table.save(a,file='mytable.tab')
a<-table.start()
a<-table.row.start(a)
a<-table.element(a,'Partial Autocorrelation Function',4,TRUE)
a<-table.row.end(a)
a<-table.row.start(a)
a<-table.element(a,'Time lag k',header=TRUE)
a<-table.element(a,'PACF(k)',header=TRUE)
a<-table.element(a,'T-STAT',header=TRUE)
a<-table.element(a,'P-value',header=TRUE)
a<-table.row.end(a)
for (i in 1:par1) {
a<-table.row.start(a)
a<-table.element(a,i,header=TRUE)
a<-table.element(a,round(mypacf[i],6))
mytstat <- mypacf[i]*sqrtn
a<-table.element(a,round(mytstat,4))
a<-table.element(a,round(1-pt(abs(mytstat),lengthx),6))
a<-table.row.end(a)
}
a<-table.end(a)
table.save(a,file='mytable1.tab')