Free Statistics

of Irreproducible Research!

Author's title

Author*Unverified author*
R Software Modulerwasp_autocorrelation.wasp
Title produced by software(Partial) Autocorrelation Function
Date of computationSat, 17 Dec 2016 11:51:39 +0100
Cite this page as followsStatistical Computations at FreeStatistics.org, Office for Research Development and Education, URL https://freestatistics.org/blog/index.php?v=date/2016/Dec/17/t1481971908qti8su4bos7iwsq.htm/, Retrieved Thu, 02 May 2024 00:35:55 +0000
Statistical Computations at FreeStatistics.org, Office for Research Development and Education, URL https://freestatistics.org/blog/index.php?pk=300681, Retrieved Thu, 02 May 2024 00:35:55 +0000
QR Codes:

Original text written by user:
IsPrivate?No (this computation is public)
User-defined keywords
Estimated Impact84
Family? (F = Feedback message, R = changed R code, M = changed R Module, P = changed Parameters, D = changed Data)
-       [(Partial) Autocorrelation Function] [ACF voorbeeld] [2016-12-17 10:51:39] [d41d8cd98f00b204e9800998ecf8427e] [Current]
Feedback Forum

Post a new message
Dataseries X:
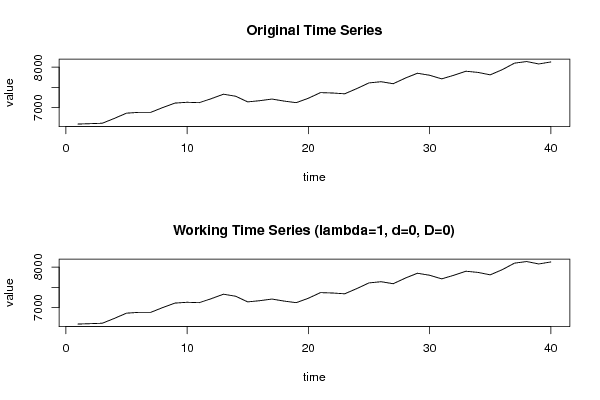
6590
6600
6610
6730
6860
6880
6880
7000
7110
7130
7120
7220
7330
7280
7140
7170
7210
7160
7120
7230
7370
7360
7340
7470
7610
7640
7590
7730
7850
7800
7710
7800
7900
7870
7810
7940
8100
8140
8080
8130


Summary of computational transaction
Raw Input view raw input (R code)
Raw Outputview raw output of R engine
Computing time2 seconds
R ServerBig Analytics Cloud Computing Center

\begin{tabular}{lllllllll}
\hline
Summary of computational transaction \tabularnewline
Raw Input view raw input (R code)  \tabularnewline
Raw Outputview raw output of R engine  \tabularnewline
Computing time2 seconds \tabularnewline
R ServerBig Analytics Cloud Computing Center \tabularnewline
\hline
\end{tabular}
%Source: https://freestatistics.org/blog/index.php?pk=300681&T=0

[TABLE]
[ROW]
Summary of computational transaction[/C][/ROW] [ROW]Raw Input[/C] view raw input (R code) [/C][/ROW] [ROW]Raw Output[/C]view raw output of R engine [/C][/ROW] [ROW]Computing time[/C]2 seconds[/C][/ROW] [ROW]R Server[/C]Big Analytics Cloud Computing Center[/C][/ROW] [/TABLE] Source: https://freestatistics.org/blog/index.php?pk=300681&T=0

Globally Unique Identifier (entire table): ba.freestatistics.org/blog/index.php?pk=300681&T=0

As an alternative you can also use a QR Code:  

The GUIDs for individual cells are displayed in the table below:

Summary of computational transaction
Raw Input view raw input (R code)
Raw Outputview raw output of R engine
Computing time2 seconds
R ServerBig Analytics Cloud Computing Center


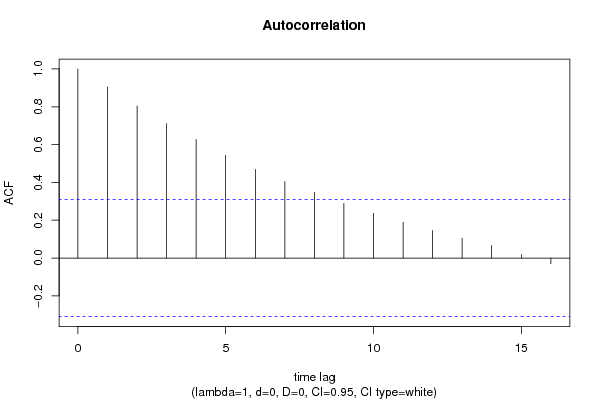
Autocorrelation Function
Time lag kACF(k)T-STATP-value
10.9047655.72221e-06
20.8033415.08085e-06
30.7101954.49172.9e-05
40.6264293.96190.000149
50.5429433.43390.000699
60.4682292.96130.002566
70.4043042.5570.007227
80.3477242.19920.016853
90.2888251.82670.037608
100.2364451.49540.071328
110.1892171.19670.119231
120.1458380.92240.180936
130.1046860.66210.255854
140.0665520.42090.338035
150.0180770.11430.454773
16-0.030052-0.19010.42511

\begin{tabular}{lllllllll}
\hline
Autocorrelation Function \tabularnewline
Time lag k & ACF(k) & T-STAT & P-value \tabularnewline
1 & 0.904765 & 5.7222 & 1e-06 \tabularnewline
2 & 0.803341 & 5.0808 & 5e-06 \tabularnewline
3 & 0.710195 & 4.4917 & 2.9e-05 \tabularnewline
4 & 0.626429 & 3.9619 & 0.000149 \tabularnewline
5 & 0.542943 & 3.4339 & 0.000699 \tabularnewline
6 & 0.468229 & 2.9613 & 0.002566 \tabularnewline
7 & 0.404304 & 2.557 & 0.007227 \tabularnewline
8 & 0.347724 & 2.1992 & 0.016853 \tabularnewline
9 & 0.288825 & 1.8267 & 0.037608 \tabularnewline
10 & 0.236445 & 1.4954 & 0.071328 \tabularnewline
11 & 0.189217 & 1.1967 & 0.119231 \tabularnewline
12 & 0.145838 & 0.9224 & 0.180936 \tabularnewline
13 & 0.104686 & 0.6621 & 0.255854 \tabularnewline
14 & 0.066552 & 0.4209 & 0.338035 \tabularnewline
15 & 0.018077 & 0.1143 & 0.454773 \tabularnewline
16 & -0.030052 & -0.1901 & 0.42511 \tabularnewline
\hline
\end{tabular}
%Source: https://freestatistics.org/blog/index.php?pk=300681&T=1

[TABLE]
[ROW][C]Autocorrelation Function[/C][/ROW]
[ROW][C]Time lag k[/C][C]ACF(k)[/C][C]T-STAT[/C][C]P-value[/C][/ROW]
[ROW][C]1[/C][C]0.904765[/C][C]5.7222[/C][C]1e-06[/C][/ROW]
[ROW][C]2[/C][C]0.803341[/C][C]5.0808[/C][C]5e-06[/C][/ROW]
[ROW][C]3[/C][C]0.710195[/C][C]4.4917[/C][C]2.9e-05[/C][/ROW]
[ROW][C]4[/C][C]0.626429[/C][C]3.9619[/C][C]0.000149[/C][/ROW]
[ROW][C]5[/C][C]0.542943[/C][C]3.4339[/C][C]0.000699[/C][/ROW]
[ROW][C]6[/C][C]0.468229[/C][C]2.9613[/C][C]0.002566[/C][/ROW]
[ROW][C]7[/C][C]0.404304[/C][C]2.557[/C][C]0.007227[/C][/ROW]
[ROW][C]8[/C][C]0.347724[/C][C]2.1992[/C][C]0.016853[/C][/ROW]
[ROW][C]9[/C][C]0.288825[/C][C]1.8267[/C][C]0.037608[/C][/ROW]
[ROW][C]10[/C][C]0.236445[/C][C]1.4954[/C][C]0.071328[/C][/ROW]
[ROW][C]11[/C][C]0.189217[/C][C]1.1967[/C][C]0.119231[/C][/ROW]
[ROW][C]12[/C][C]0.145838[/C][C]0.9224[/C][C]0.180936[/C][/ROW]
[ROW][C]13[/C][C]0.104686[/C][C]0.6621[/C][C]0.255854[/C][/ROW]
[ROW][C]14[/C][C]0.066552[/C][C]0.4209[/C][C]0.338035[/C][/ROW]
[ROW][C]15[/C][C]0.018077[/C][C]0.1143[/C][C]0.454773[/C][/ROW]
[ROW][C]16[/C][C]-0.030052[/C][C]-0.1901[/C][C]0.42511[/C][/ROW]
[/TABLE]
Source: https://freestatistics.org/blog/index.php?pk=300681&T=1

Globally Unique Identifier (entire table): ba.freestatistics.org/blog/index.php?pk=300681&T=1

As an alternative you can also use a QR Code:  

The GUIDs for individual cells are displayed in the table below:

Autocorrelation Function
Time lag kACF(k)T-STATP-value
10.9047655.72221e-06
20.8033415.08085e-06
30.7101954.49172.9e-05
40.6264293.96190.000149
50.5429433.43390.000699
60.4682292.96130.002566
70.4043042.5570.007227
80.3477242.19920.016853
90.2888251.82670.037608
100.2364451.49540.071328
110.1892171.19670.119231
120.1458380.92240.180936
130.1046860.66210.255854
140.0665520.42090.338035
150.0180770.11430.454773
16-0.030052-0.19010.42511


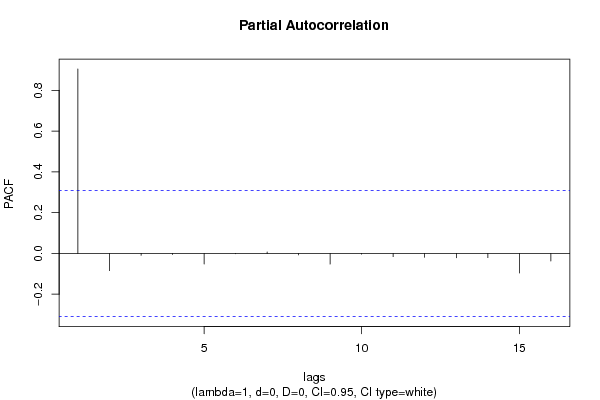
Partial Autocorrelation Function
Time lag kPACF(k)T-STATP-value
10.9047655.72221e-06
2-0.084115-0.5320.298838
3-0.00929-0.05880.476721
4-0.005368-0.03390.486544
5-0.051832-0.32780.37238
6-0.001781-0.01130.495534
70.0070520.04460.482324
8-0.007171-0.04540.482026
9-0.052213-0.33020.371478
10-0.003329-0.02110.491653
11-0.0155-0.0980.461198
12-0.018527-0.11720.453654
13-0.020981-0.13270.44755
14-0.020686-0.13080.448283
15-0.095517-0.60410.274594
16-0.037373-0.23640.407176

\begin{tabular}{lllllllll}
\hline
Partial Autocorrelation Function \tabularnewline
Time lag k & PACF(k) & T-STAT & P-value \tabularnewline
1 & 0.904765 & 5.7222 & 1e-06 \tabularnewline
2 & -0.084115 & -0.532 & 0.298838 \tabularnewline
3 & -0.00929 & -0.0588 & 0.476721 \tabularnewline
4 & -0.005368 & -0.0339 & 0.486544 \tabularnewline
5 & -0.051832 & -0.3278 & 0.37238 \tabularnewline
6 & -0.001781 & -0.0113 & 0.495534 \tabularnewline
7 & 0.007052 & 0.0446 & 0.482324 \tabularnewline
8 & -0.007171 & -0.0454 & 0.482026 \tabularnewline
9 & -0.052213 & -0.3302 & 0.371478 \tabularnewline
10 & -0.003329 & -0.0211 & 0.491653 \tabularnewline
11 & -0.0155 & -0.098 & 0.461198 \tabularnewline
12 & -0.018527 & -0.1172 & 0.453654 \tabularnewline
13 & -0.020981 & -0.1327 & 0.44755 \tabularnewline
14 & -0.020686 & -0.1308 & 0.448283 \tabularnewline
15 & -0.095517 & -0.6041 & 0.274594 \tabularnewline
16 & -0.037373 & -0.2364 & 0.407176 \tabularnewline
\hline
\end{tabular}
%Source: https://freestatistics.org/blog/index.php?pk=300681&T=2

[TABLE]
[ROW][C]Partial Autocorrelation Function[/C][/ROW]
[ROW][C]Time lag k[/C][C]PACF(k)[/C][C]T-STAT[/C][C]P-value[/C][/ROW]
[ROW][C]1[/C][C]0.904765[/C][C]5.7222[/C][C]1e-06[/C][/ROW]
[ROW][C]2[/C][C]-0.084115[/C][C]-0.532[/C][C]0.298838[/C][/ROW]
[ROW][C]3[/C][C]-0.00929[/C][C]-0.0588[/C][C]0.476721[/C][/ROW]
[ROW][C]4[/C][C]-0.005368[/C][C]-0.0339[/C][C]0.486544[/C][/ROW]
[ROW][C]5[/C][C]-0.051832[/C][C]-0.3278[/C][C]0.37238[/C][/ROW]
[ROW][C]6[/C][C]-0.001781[/C][C]-0.0113[/C][C]0.495534[/C][/ROW]
[ROW][C]7[/C][C]0.007052[/C][C]0.0446[/C][C]0.482324[/C][/ROW]
[ROW][C]8[/C][C]-0.007171[/C][C]-0.0454[/C][C]0.482026[/C][/ROW]
[ROW][C]9[/C][C]-0.052213[/C][C]-0.3302[/C][C]0.371478[/C][/ROW]
[ROW][C]10[/C][C]-0.003329[/C][C]-0.0211[/C][C]0.491653[/C][/ROW]
[ROW][C]11[/C][C]-0.0155[/C][C]-0.098[/C][C]0.461198[/C][/ROW]
[ROW][C]12[/C][C]-0.018527[/C][C]-0.1172[/C][C]0.453654[/C][/ROW]
[ROW][C]13[/C][C]-0.020981[/C][C]-0.1327[/C][C]0.44755[/C][/ROW]
[ROW][C]14[/C][C]-0.020686[/C][C]-0.1308[/C][C]0.448283[/C][/ROW]
[ROW][C]15[/C][C]-0.095517[/C][C]-0.6041[/C][C]0.274594[/C][/ROW]
[ROW][C]16[/C][C]-0.037373[/C][C]-0.2364[/C][C]0.407176[/C][/ROW]
[/TABLE]
Source: https://freestatistics.org/blog/index.php?pk=300681&T=2

Globally Unique Identifier (entire table): ba.freestatistics.org/blog/index.php?pk=300681&T=2

As an alternative you can also use a QR Code:  

The GUIDs for individual cells are displayed in the table below:

Partial Autocorrelation Function
Time lag kPACF(k)T-STATP-value
10.9047655.72221e-06
2-0.084115-0.5320.298838
3-0.00929-0.05880.476721
4-0.005368-0.03390.486544
5-0.051832-0.32780.37238
6-0.001781-0.01130.495534
70.0070520.04460.482324
8-0.007171-0.04540.482026
9-0.052213-0.33020.371478
10-0.003329-0.02110.491653
11-0.0155-0.0980.461198
12-0.018527-0.11720.453654
13-0.020981-0.13270.44755
14-0.020686-0.13080.448283
15-0.095517-0.60410.274594
16-0.037373-0.23640.407176


Parameters (Session):
par1 = Default ; par2 = 1 ; par3 = 0 ; par4 = 0 ; par5 = 12 ; par6 = White Noise ; par7 = 0.95 ;
Parameters (R input):
par1 = Default ; par2 = 1 ; par3 = 0 ; par4 = 0 ; par5 = 12 ; par6 = White Noise ; par7 = 0.95 ; par8 = ;
R code (references can be found in the software module):
if (par1 == 'Default') {
par1 = 10*log10(length(x))
} else {
par1 <- as.numeric(par1)
}
par2 <- as.numeric(par2)
par3 <- as.numeric(par3)
par4 <- as.numeric(par4)
par5 <- as.numeric(par5)
if (par6 == 'White Noise') par6 <- 'white' else par6 <- 'ma'
par7 <- as.numeric(par7)
if (par8 != '') par8 <- as.numeric(par8)
x <- na.omit(x)
ox <- x
if (par8 == '') {
if (par2 == 0) {
x <- log(x)
} else {
x <- (x ^ par2 - 1) / par2
}
} else {
x <- log(x,base=par8)
}
if (par3 > 0) x <- diff(x,lag=1,difference=par3)
if (par4 > 0) x <- diff(x,lag=par5,difference=par4)
bitmap(file='picts.png')
op <- par(mfrow=c(2,1))
plot(ox,type='l',main='Original Time Series',xlab='time',ylab='value')
if (par8=='') {
mytitle <- paste('Working Time Series (lambda=',par2,', d=',par3,', D=',par4,')',sep='')
mysub <- paste('(lambda=',par2,', d=',par3,', D=',par4,', CI=', par7, ', CI type=',par6,')',sep='')
} else {
mytitle <- paste('Working Time Series (base=',par8,', d=',par3,', D=',par4,')',sep='')
mysub <- paste('(base=',par8,', d=',par3,', D=',par4,', CI=', par7, ', CI type=',par6,')',sep='')
}
plot(x,type='l', main=mytitle,xlab='time',ylab='value')
par(op)
dev.off()
bitmap(file='pic1.png')
racf <- acf(x, par1, main='Autocorrelation', xlab='time lag', ylab='ACF', ci.type=par6, ci=par7, sub=mysub)
dev.off()
bitmap(file='pic2.png')
rpacf <- pacf(x,par1,main='Partial Autocorrelation',xlab='lags',ylab='PACF',sub=mysub)
dev.off()
(myacf <- c(racf$acf))
(mypacf <- c(rpacf$acf))
lengthx <- length(x)
sqrtn <- sqrt(lengthx)
load(file='createtable')
a<-table.start()
a<-table.row.start(a)
a<-table.element(a,'Autocorrelation Function',4,TRUE)
a<-table.row.end(a)
a<-table.row.start(a)
a<-table.element(a,'Time lag k',header=TRUE)
a<-table.element(a,'ACF(k)',header=TRUE)
a<-table.element(a,'T-STAT',header=TRUE)
a<-table.element(a,'P-value',header=TRUE)
a<-table.row.end(a)
for (i in 2:(par1+1)) {
a<-table.row.start(a)
a<-table.element(a,i-1,header=TRUE)
a<-table.element(a,round(myacf[i],6))
mytstat <- myacf[i]*sqrtn
a<-table.element(a,round(mytstat,4))
a<-table.element(a,round(1-pt(abs(mytstat),lengthx),6))
a<-table.row.end(a)
}
a<-table.end(a)
table.save(a,file='mytable.tab')
a<-table.start()
a<-table.row.start(a)
a<-table.element(a,'Partial Autocorrelation Function',4,TRUE)
a<-table.row.end(a)
a<-table.row.start(a)
a<-table.element(a,'Time lag k',header=TRUE)
a<-table.element(a,'PACF(k)',header=TRUE)
a<-table.element(a,'T-STAT',header=TRUE)
a<-table.element(a,'P-value',header=TRUE)
a<-table.row.end(a)
for (i in 1:par1) {
a<-table.row.start(a)
a<-table.element(a,i,header=TRUE)
a<-table.element(a,round(mypacf[i],6))
mytstat <- mypacf[i]*sqrtn
a<-table.element(a,round(mytstat,4))
a<-table.element(a,round(1-pt(abs(mytstat),lengthx),6))
a<-table.row.end(a)
}
a<-table.end(a)
table.save(a,file='mytable1.tab')