Free Statistics
of Irreproducible Research!
Description of Statistical Computation | ||||||||||||||||||||||||||||||||||||||||||
|---|---|---|---|---|---|---|---|---|---|---|---|---|---|---|---|---|---|---|---|---|---|---|---|---|---|---|---|---|---|---|---|---|---|---|---|---|---|---|---|---|---|---|
| Author's title | ||||||||||||||||||||||||||||||||||||||||||
| Author | *The author of this computation has been verified* | |||||||||||||||||||||||||||||||||||||||||
| R Software Module | rwasp_fitdistrchisq1.wasp | |||||||||||||||||||||||||||||||||||||||||
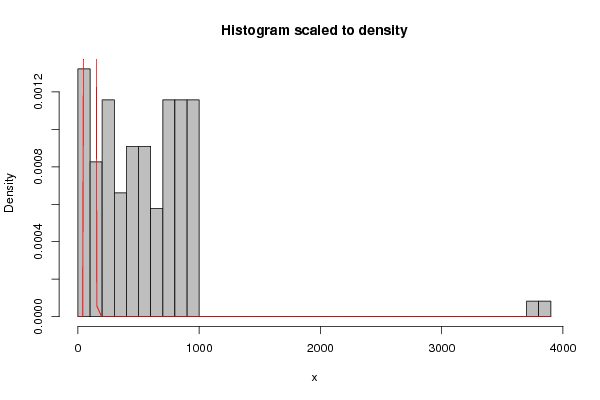
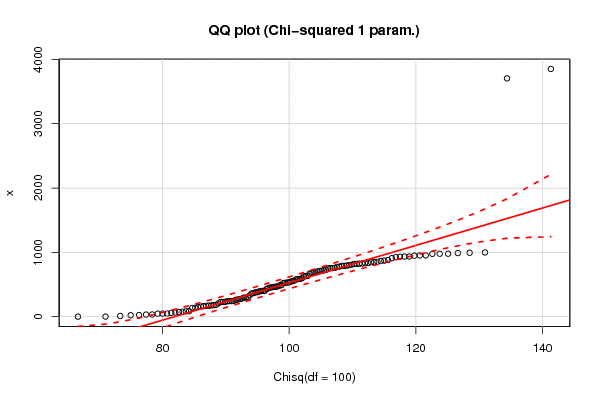
| Title produced by software | Maximum-likelihood Fitting - Chi-squared Distribution | |||||||||||||||||||||||||||||||||||||||||
| Date of computation | Sat, 17 Dec 2016 12:13:09 +0100 | |||||||||||||||||||||||||||||||||||||||||
| Cite this page as follows | Statistical Computations at FreeStatistics.org, Office for Research Development and Education, URL https://freestatistics.org/blog/index.php?v=date/2016/Dec/17/t1481973205kog03d1k67tdrdy.htm/, Retrieved Thu, 02 May 2024 13:02:56 +0000 | |||||||||||||||||||||||||||||||||||||||||
| Statistical Computations at FreeStatistics.org, Office for Research Development and Education, URL https://freestatistics.org/blog/index.php?pk=300694, Retrieved Thu, 02 May 2024 13:02:56 +0000 | ||||||||||||||||||||||||||||||||||||||||||
| QR Codes: | ||||||||||||||||||||||||||||||||||||||||||
|
| ||||||||||||||||||||||||||||||||||||||||||
| Original text written by user: | ||||||||||||||||||||||||||||||||||||||||||
| IsPrivate? | No (this computation is public) | |||||||||||||||||||||||||||||||||||||||||
| User-defined keywords | ||||||||||||||||||||||||||||||||||||||||||
| Estimated Impact | 73 | |||||||||||||||||||||||||||||||||||||||||
Tree of Dependent Computations | ||||||||||||||||||||||||||||||||||||||||||
| Family? (F = Feedback message, R = changed R code, M = changed R Module, P = changed Parameters, D = changed Data) | ||||||||||||||||||||||||||||||||||||||||||
| - [Maximum-likelihood Fitting - Chi-squared Distribution] [N 3028 chi squared] [2016-12-17 11:13:09] [0fbc99f8be9cad246c7cf6558103ab95] [Current] | ||||||||||||||||||||||||||||||||||||||||||
| Feedback Forum | ||||||||||||||||||||||||||||||||||||||||||
Post a new message | ||||||||||||||||||||||||||||||||||||||||||
Dataset | ||||||||||||||||||||||||||||||||||||||||||
| Dataseries X: | ||||||||||||||||||||||||||||||||||||||||||
587 526 635 84 821 953 86 367 486 136 833 241 35 925 1 755 801 865 464 758 176 380 793 48 301 597 275 583 402 48 629 999 458 808 791 703 379 948 910 531 431 65 708 714 185 60 2 171 402 682 74 774 953 229 979 11 362 472 820 561 688 778 826 756 149 555 846 872 523 296 77 671 158 749 267 332 729 489 979 849 231 26 465 932 398 824 245 994 685 836 533 50 444 33 262 23 393 242 790 179 989 455 542 881 207 164 3705 977 936 627 281 229 297 722 139 585 854 244 169 3851 934 | ||||||||||||||||||||||||||||||||||||||||||
Tables (Output of Computation) | ||||||||||||||||||||||||||||||||||||||||||
| ||||||||||||||||||||||||||||||||||||||||||
Figures (Output of Computation) | ||||||||||||||||||||||||||||||||||||||||||
Input Parameters & R Code | ||||||||||||||||||||||||||||||||||||||||||
| Parameters (Session): | ||||||||||||||||||||||||||||||||||||||||||
| par1 = TRUE ; | ||||||||||||||||||||||||||||||||||||||||||
| Parameters (R input): | ||||||||||||||||||||||||||||||||||||||||||
| R code (references can be found in the software module): | ||||||||||||||||||||||||||||||||||||||||||
library(MASS) | ||||||||||||||||||||||||||||||||||||||||||