Free Statistics

of Irreproducible Research!

Author's title

Author*The author of this computation has been verified*
R Software Modulerwasp_smp.wasp
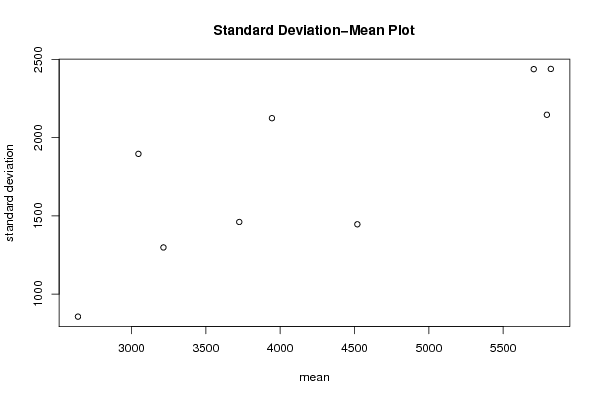
Title produced by softwareStandard Deviation-Mean Plot
Date of computationSat, 17 Dec 2016 12:26:43 +0100
Cite this page as followsStatistical Computations at FreeStatistics.org, Office for Research Development and Education, URL https://freestatistics.org/blog/index.php?v=date/2016/Dec/17/t1481974113jd068edwq0cwb61.htm/, Retrieved Thu, 02 May 2024 00:00:05 +0000
Statistical Computations at FreeStatistics.org, Office for Research Development and Education, URL https://freestatistics.org/blog/index.php?pk=300709, Retrieved Thu, 02 May 2024 00:00:05 +0000
QR Codes:

Original text written by user:
IsPrivate?No (this computation is public)
User-defined keywords
Estimated Impact64
Family? (F = Feedback message, R = changed R code, M = changed R Module, P = changed Parameters, D = changed Data)
-       [Standard Deviation-Mean Plot] [N1730 standard de...] [2016-12-17 11:26:43] [63af9ed1c5670c0e3049894fd77d93e0] [Current]
Feedback Forum

Post a new message
Dataseries X:
5610
3530
2370
11610
4630
8760
4130
5400
5630
7050
5620
5510
4240
3620
4220
3480
3400
4830
3060
8030
8480
7270
10030
7810
6470
5150
4580
2640
2180
6250
4310
6160
8560
6250
8940
8040
6290
2630
4760
3820
2350
2420
4780
6120
4290
5540
6120
5110
4800
2670
5120
2370
3280
4090
2250
2520
3670
6440
5490
2000
2130
1210
6770
2380
2380
3760
3860
4590
4580
8030
5880
1770
5440
4090
3360
1240
1890
3390
2980
5030
3720
3530
1620
2290
2050
2070
2760
1500
1850
2760
3360
2120
3970
3760
3630
1850
3160
2700
1080
1150
1230
2180
2310
2940
4370
4750
7810
2880


Summary of computational transaction
Raw Input view raw input (R code)
Raw Outputview raw output of R engine
Computing time1 seconds
R ServerBig Analytics Cloud Computing Center

\begin{tabular}{lllllllll}
\hline
Summary of computational transaction \tabularnewline
Raw Input view raw input (R code)  \tabularnewline
Raw Outputview raw output of R engine  \tabularnewline
Computing time1 seconds \tabularnewline
R ServerBig Analytics Cloud Computing Center \tabularnewline
\hline
\end{tabular}
%Source: https://freestatistics.org/blog/index.php?pk=300709&T=0

[TABLE]
[ROW]
Summary of computational transaction[/C][/ROW] [ROW]Raw Input[/C] view raw input (R code) [/C][/ROW] [ROW]Raw Output[/C]view raw output of R engine [/C][/ROW] [ROW]Computing time[/C]1 seconds[/C][/ROW] [ROW]R Server[/C]Big Analytics Cloud Computing Center[/C][/ROW] [/TABLE] Source: https://freestatistics.org/blog/index.php?pk=300709&T=0

Globally Unique Identifier (entire table): ba.freestatistics.org/blog/index.php?pk=300709&T=0

As an alternative you can also use a QR Code:  

The GUIDs for individual cells are displayed in the table below:

Summary of computational transaction
Raw Input view raw input (R code)
Raw Outputview raw output of R engine
Computing time1 seconds
R ServerBig Analytics Cloud Computing Center


Standard Deviation-Mean Plot
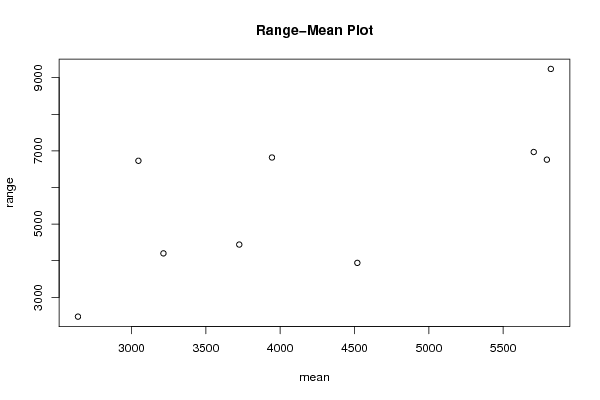
SectionMeanStandard DeviationRange
15820.833333333332440.046416597759240
25705.833333333332438.630235243226970
35794.166666666672146.855875813556760
44519.166666666671446.013066289093940
537251460.843467440524440
639452125.094650298496820
732151297.812845451224200
82640855.0279102302612470
93046.666666666671896.726046894946730

\begin{tabular}{lllllllll}
\hline
Standard Deviation-Mean Plot \tabularnewline
Section & Mean & Standard Deviation & Range \tabularnewline
1 & 5820.83333333333 & 2440.04641659775 & 9240 \tabularnewline
2 & 5705.83333333333 & 2438.63023524322 & 6970 \tabularnewline
3 & 5794.16666666667 & 2146.85587581355 & 6760 \tabularnewline
4 & 4519.16666666667 & 1446.01306628909 & 3940 \tabularnewline
5 & 3725 & 1460.84346744052 & 4440 \tabularnewline
6 & 3945 & 2125.09465029849 & 6820 \tabularnewline
7 & 3215 & 1297.81284545122 & 4200 \tabularnewline
8 & 2640 & 855.027910230261 & 2470 \tabularnewline
9 & 3046.66666666667 & 1896.72604689494 & 6730 \tabularnewline
\hline
\end{tabular}
%Source: https://freestatistics.org/blog/index.php?pk=300709&T=1

[TABLE]
[ROW][C]Standard Deviation-Mean Plot[/C][/ROW]
[ROW][C]Section[/C][C]Mean[/C][C]Standard Deviation[/C][C]Range[/C][/ROW]
[ROW][C]1[/C][C]5820.83333333333[/C][C]2440.04641659775[/C][C]9240[/C][/ROW]
[ROW][C]2[/C][C]5705.83333333333[/C][C]2438.63023524322[/C][C]6970[/C][/ROW]
[ROW][C]3[/C][C]5794.16666666667[/C][C]2146.85587581355[/C][C]6760[/C][/ROW]
[ROW][C]4[/C][C]4519.16666666667[/C][C]1446.01306628909[/C][C]3940[/C][/ROW]
[ROW][C]5[/C][C]3725[/C][C]1460.84346744052[/C][C]4440[/C][/ROW]
[ROW][C]6[/C][C]3945[/C][C]2125.09465029849[/C][C]6820[/C][/ROW]
[ROW][C]7[/C][C]3215[/C][C]1297.81284545122[/C][C]4200[/C][/ROW]
[ROW][C]8[/C][C]2640[/C][C]855.027910230261[/C][C]2470[/C][/ROW]
[ROW][C]9[/C][C]3046.66666666667[/C][C]1896.72604689494[/C][C]6730[/C][/ROW]
[/TABLE]
Source: https://freestatistics.org/blog/index.php?pk=300709&T=1

Globally Unique Identifier (entire table): ba.freestatistics.org/blog/index.php?pk=300709&T=1

As an alternative you can also use a QR Code:  

The GUIDs for individual cells are displayed in the table below:

Standard Deviation-Mean Plot
SectionMeanStandard DeviationRange
15820.833333333332440.046416597759240
25705.833333333332438.630235243226970
35794.166666666672146.855875813556760
44519.166666666671446.013066289093940
537251460.843467440524440
639452125.094650298496820
732151297.812845451224200
82640855.0279102302612470
93046.666666666671896.726046894946730


Regression: S.E.(k) = alpha + beta * Mean(k)
alpha296.40259426466
beta0.349878782467404
S.D.0.101594685625785
T-STAT3.44386894169004
p-value0.0107805023766322

\begin{tabular}{lllllllll}
\hline
Regression: S.E.(k) = alpha + beta * Mean(k) \tabularnewline
alpha & 296.40259426466 \tabularnewline
beta & 0.349878782467404 \tabularnewline
S.D. & 0.101594685625785 \tabularnewline
T-STAT & 3.44386894169004 \tabularnewline
p-value & 0.0107805023766322 \tabularnewline
\hline
\end{tabular}
%Source: https://freestatistics.org/blog/index.php?pk=300709&T=2

[TABLE]
[ROW][C]Regression: S.E.(k) = alpha + beta * Mean(k)[/C][/ROW]
[ROW][C]alpha[/C][C]296.40259426466[/C][/ROW]
[ROW][C]beta[/C][C]0.349878782467404[/C][/ROW]
[ROW][C]S.D.[/C][C]0.101594685625785[/C][/ROW]
[ROW][C]T-STAT[/C][C]3.44386894169004[/C][/ROW]
[ROW][C]p-value[/C][C]0.0107805023766322[/C][/ROW]
[/TABLE]
Source: https://freestatistics.org/blog/index.php?pk=300709&T=2

Globally Unique Identifier (entire table): ba.freestatistics.org/blog/index.php?pk=300709&T=2

As an alternative you can also use a QR Code:  

The GUIDs for individual cells are displayed in the table below:

Regression: S.E.(k) = alpha + beta * Mean(k)
alpha296.40259426466
beta0.349878782467404
S.D.0.101594685625785
T-STAT3.44386894169004
p-value0.0107805023766322


Regression: ln S.E.(k) = alpha + beta * ln Mean(k)
alpha-0.173837398135262
beta0.915189352699446
S.D.0.273856148709668
T-STAT3.3418616197283
p-value0.0123880337362444
Lambda0.0848106473005537

\begin{tabular}{lllllllll}
\hline
Regression: ln S.E.(k) = alpha + beta * ln Mean(k) \tabularnewline
alpha & -0.173837398135262 \tabularnewline
beta & 0.915189352699446 \tabularnewline
S.D. & 0.273856148709668 \tabularnewline
T-STAT & 3.3418616197283 \tabularnewline
p-value & 0.0123880337362444 \tabularnewline
Lambda & 0.0848106473005537 \tabularnewline
\hline
\end{tabular}
%Source: https://freestatistics.org/blog/index.php?pk=300709&T=3

[TABLE]
[ROW][C]Regression: ln S.E.(k) = alpha + beta * ln Mean(k)[/C][/ROW]
[ROW][C]alpha[/C][C]-0.173837398135262[/C][/ROW]
[ROW][C]beta[/C][C]0.915189352699446[/C][/ROW]
[ROW][C]S.D.[/C][C]0.273856148709668[/C][/ROW]
[ROW][C]T-STAT[/C][C]3.3418616197283[/C][/ROW]
[ROW][C]p-value[/C][C]0.0123880337362444[/C][/ROW]
[ROW][C]Lambda[/C][C]0.0848106473005537[/C][/ROW]
[/TABLE]
Source: https://freestatistics.org/blog/index.php?pk=300709&T=3

Globally Unique Identifier (entire table): ba.freestatistics.org/blog/index.php?pk=300709&T=3

As an alternative you can also use a QR Code:  

The GUIDs for individual cells are displayed in the table below:

Regression: ln S.E.(k) = alpha + beta * ln Mean(k)
alpha-0.173837398135262
beta0.915189352699446
S.D.0.273856148709668
T-STAT3.3418616197283
p-value0.0123880337362444
Lambda0.0848106473005537


Parameters (Session):
par1 = 12 ;
Parameters (R input):
par1 = 12 ;
R code (references can be found in the software module):
par1 <- as.numeric(par1)
(n <- length(x))
(np <- floor(n / par1))
arr <- array(NA,dim=c(par1,np))
j <- 0
k <- 1
for (i in 1:(np*par1))
{
j = j + 1
arr[j,k] <- x[i]
if (j == par1) {
j = 0
k=k+1
}
}
arr
arr.mean <- array(NA,dim=np)
arr.sd <- array(NA,dim=np)
arr.range <- array(NA,dim=np)
for (j in 1:np)
{
arr.mean[j] <- mean(arr[,j],na.rm=TRUE)
arr.sd[j] <- sd(arr[,j],na.rm=TRUE)
arr.range[j] <- max(arr[,j],na.rm=TRUE) - min(arr[,j],na.rm=TRUE)
}
arr.mean
arr.sd
arr.range
(lm1 <- lm(arr.sd~arr.mean))
(lnlm1 <- lm(log(arr.sd)~log(arr.mean)))
(lm2 <- lm(arr.range~arr.mean))
bitmap(file='test1.png')
plot(arr.mean,arr.sd,main='Standard Deviation-Mean Plot',xlab='mean',ylab='standard deviation')
dev.off()
bitmap(file='test2.png')
plot(arr.mean,arr.range,main='Range-Mean Plot',xlab='mean',ylab='range')
dev.off()
load(file='createtable')
a<-table.start()
a<-table.row.start(a)
a<-table.element(a,'Standard Deviation-Mean Plot',4,TRUE)
a<-table.row.end(a)
a<-table.row.start(a)
a<-table.element(a,'Section',header=TRUE)
a<-table.element(a,'Mean',header=TRUE)
a<-table.element(a,'Standard Deviation',header=TRUE)
a<-table.element(a,'Range',header=TRUE)
a<-table.row.end(a)
for (j in 1:np) {
a<-table.row.start(a)
a<-table.element(a,j,header=TRUE)
a<-table.element(a,arr.mean[j])
a<-table.element(a,arr.sd[j] )
a<-table.element(a,arr.range[j] )
a<-table.row.end(a)
}
a<-table.end(a)
table.save(a,file='mytable.tab')
a<-table.start()
a<-table.row.start(a)
a<-table.element(a,'Regression: S.E.(k) = alpha + beta * Mean(k)',2,TRUE)
a<-table.row.end(a)
a<-table.row.start(a)
a<-table.element(a,'alpha',header=TRUE)
a<-table.element(a,lm1$coefficients[[1]])
a<-table.row.end(a)
a<-table.row.start(a)
a<-table.element(a,'beta',header=TRUE)
a<-table.element(a,lm1$coefficients[[2]])
a<-table.row.end(a)
a<-table.row.start(a)
a<-table.element(a,'S.D.',header=TRUE)
a<-table.element(a,summary(lm1)$coefficients[2,2])
a<-table.row.end(a)
a<-table.row.start(a)
a<-table.element(a,'T-STAT',header=TRUE)
a<-table.element(a,summary(lm1)$coefficients[2,3])
a<-table.row.end(a)
a<-table.row.start(a)
a<-table.element(a,'p-value',header=TRUE)
a<-table.element(a,summary(lm1)$coefficients[2,4])
a<-table.row.end(a)
a<-table.end(a)
table.save(a,file='mytable1.tab')
a<-table.start()
a<-table.row.start(a)
a<-table.element(a,'Regression: ln S.E.(k) = alpha + beta * ln Mean(k)',2,TRUE)
a<-table.row.end(a)
a<-table.row.start(a)
a<-table.element(a,'alpha',header=TRUE)
a<-table.element(a,lnlm1$coefficients[[1]])
a<-table.row.end(a)
a<-table.row.start(a)
a<-table.element(a,'beta',header=TRUE)
a<-table.element(a,lnlm1$coefficients[[2]])
a<-table.row.end(a)
a<-table.row.start(a)
a<-table.element(a,'S.D.',header=TRUE)
a<-table.element(a,summary(lnlm1)$coefficients[2,2])
a<-table.row.end(a)
a<-table.row.start(a)
a<-table.element(a,'T-STAT',header=TRUE)
a<-table.element(a,summary(lnlm1)$coefficients[2,3])
a<-table.row.end(a)
a<-table.row.start(a)
a<-table.element(a,'p-value',header=TRUE)
a<-table.element(a,summary(lnlm1)$coefficients[2,4])
a<-table.row.end(a)
a<-table.row.start(a)
a<-table.element(a,'Lambda',header=TRUE)
a<-table.element(a,1-lnlm1$coefficients[[2]])
a<-table.row.end(a)
a<-table.end(a)
table.save(a,file='mytable2.tab')