Free Statistics

of Irreproducible Research!

Author's title

Author*The author of this computation has been verified*
R Software Modulerwasp_histogram.wasp
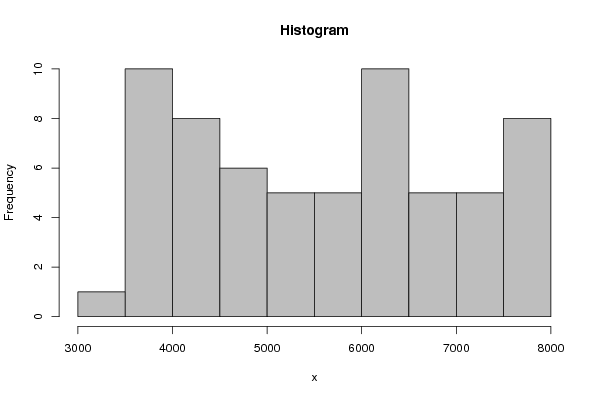
Title produced by softwareHistogram
Date of computationSat, 17 Dec 2016 12:39:45 +0100
Cite this page as followsStatistical Computations at FreeStatistics.org, Office for Research Development and Education, URL https://freestatistics.org/blog/index.php?v=date/2016/Dec/17/t1481974808jaqk57bo6v0q36t.htm/, Retrieved Thu, 02 May 2024 01:47:56 +0000
Statistical Computations at FreeStatistics.org, Office for Research Development and Education, URL https://freestatistics.org/blog/index.php?pk=300717, Retrieved Thu, 02 May 2024 01:47:56 +0000
QR Codes:

Original text written by user:
IsPrivate?No (this computation is public)
User-defined keywords
Estimated Impact78
Family? (F = Feedback message, R = changed R code, M = changed R Module, P = changed Parameters, D = changed Data)
-       [Histogram] [] [2016-12-17 11:39:45] [9ac947b5174fcc9cd01e144b03ceb277] [Current]
Feedback Forum

Post a new message
Dataseries X:
7984
7937
7821
7749
7785
7632
7533
7536
7470
7367
7246
7150
7050
6907
6803
6626
6512
6509
6419
6365
6395
6360
6386
6360
6259
6198
6103
6064
5968
5908
5805
5728
5678
5274
5166
5106
5008
5034
4901
4853
4790
4703
4640
4544
4465
4335
4345
4246
4131
4112
4111
4096
3970
3970
3908
3861
3819
3781
3684
3664
3648
3564
3490


Summary of computational transaction
Raw Input view raw input (R code)
Raw Outputview raw output of R engine
Computing time0 seconds
R ServerBig Analytics Cloud Computing Center

\begin{tabular}{lllllllll}
\hline
Summary of computational transaction \tabularnewline
Raw Input view raw input (R code)  \tabularnewline
Raw Outputview raw output of R engine  \tabularnewline
Computing time0 seconds \tabularnewline
R ServerBig Analytics Cloud Computing Center \tabularnewline
\hline
\end{tabular}
%Source: https://freestatistics.org/blog/index.php?pk=300717&T=0

[TABLE]
[ROW]
Summary of computational transaction[/C][/ROW] [ROW]Raw Input[/C] view raw input (R code) [/C][/ROW] [ROW]Raw Output[/C]view raw output of R engine [/C][/ROW] [ROW]Computing time[/C]0 seconds[/C][/ROW] [ROW]R Server[/C]Big Analytics Cloud Computing Center[/C][/ROW] [/TABLE] Source: https://freestatistics.org/blog/index.php?pk=300717&T=0

Globally Unique Identifier (entire table): ba.freestatistics.org/blog/index.php?pk=300717&T=0

As an alternative you can also use a QR Code:  

The GUIDs for individual cells are displayed in the table below:

Summary of computational transaction
Raw Input view raw input (R code)
Raw Outputview raw output of R engine
Computing time0 seconds
R ServerBig Analytics Cloud Computing Center


Frequency Table (Histogram)
BinsMidpointAbs. FrequencyRel. FrequencyCumul. Rel. Freq.Density
[3000,3500[325010.0158730.0158733.2e-05
[3500,4000[3750100.158730.1746030.000317
[4000,4500[425080.1269840.3015870.000254
[4500,5000[475060.0952380.3968250.00019
[5000,5500[525050.0793650.476190.000159
[5500,6000[575050.0793650.5555560.000159
[6000,6500[6250100.158730.7142860.000317
[6500,7000[675050.0793650.7936510.000159
[7000,7500[725050.0793650.8730160.000159
[7500,8000]775080.12698410.000254

\begin{tabular}{lllllllll}
\hline
Frequency Table (Histogram) \tabularnewline
Bins & Midpoint & Abs. Frequency & Rel. Frequency & Cumul. Rel. Freq. & Density \tabularnewline
[3000,3500[ & 3250 & 1 & 0.015873 & 0.015873 & 3.2e-05 \tabularnewline
[3500,4000[ & 3750 & 10 & 0.15873 & 0.174603 & 0.000317 \tabularnewline
[4000,4500[ & 4250 & 8 & 0.126984 & 0.301587 & 0.000254 \tabularnewline
[4500,5000[ & 4750 & 6 & 0.095238 & 0.396825 & 0.00019 \tabularnewline
[5000,5500[ & 5250 & 5 & 0.079365 & 0.47619 & 0.000159 \tabularnewline
[5500,6000[ & 5750 & 5 & 0.079365 & 0.555556 & 0.000159 \tabularnewline
[6000,6500[ & 6250 & 10 & 0.15873 & 0.714286 & 0.000317 \tabularnewline
[6500,7000[ & 6750 & 5 & 0.079365 & 0.793651 & 0.000159 \tabularnewline
[7000,7500[ & 7250 & 5 & 0.079365 & 0.873016 & 0.000159 \tabularnewline
[7500,8000] & 7750 & 8 & 0.126984 & 1 & 0.000254 \tabularnewline
\hline
\end{tabular}
%Source: https://freestatistics.org/blog/index.php?pk=300717&T=1

[TABLE]
[ROW][C]Frequency Table (Histogram)[/C][/ROW]
[ROW][C]Bins[/C][C]Midpoint[/C][C]Abs. Frequency[/C][C]Rel. Frequency[/C][C]Cumul. Rel. Freq.[/C][C]Density[/C][/ROW]
[ROW][C][3000,3500[[/C][C]3250[/C][C]1[/C][C]0.015873[/C][C]0.015873[/C][C]3.2e-05[/C][/ROW]
[ROW][C][3500,4000[[/C][C]3750[/C][C]10[/C][C]0.15873[/C][C]0.174603[/C][C]0.000317[/C][/ROW]
[ROW][C][4000,4500[[/C][C]4250[/C][C]8[/C][C]0.126984[/C][C]0.301587[/C][C]0.000254[/C][/ROW]
[ROW][C][4500,5000[[/C][C]4750[/C][C]6[/C][C]0.095238[/C][C]0.396825[/C][C]0.00019[/C][/ROW]
[ROW][C][5000,5500[[/C][C]5250[/C][C]5[/C][C]0.079365[/C][C]0.47619[/C][C]0.000159[/C][/ROW]
[ROW][C][5500,6000[[/C][C]5750[/C][C]5[/C][C]0.079365[/C][C]0.555556[/C][C]0.000159[/C][/ROW]
[ROW][C][6000,6500[[/C][C]6250[/C][C]10[/C][C]0.15873[/C][C]0.714286[/C][C]0.000317[/C][/ROW]
[ROW][C][6500,7000[[/C][C]6750[/C][C]5[/C][C]0.079365[/C][C]0.793651[/C][C]0.000159[/C][/ROW]
[ROW][C][7000,7500[[/C][C]7250[/C][C]5[/C][C]0.079365[/C][C]0.873016[/C][C]0.000159[/C][/ROW]
[ROW][C][7500,8000][/C][C]7750[/C][C]8[/C][C]0.126984[/C][C]1[/C][C]0.000254[/C][/ROW]
[/TABLE]
Source: https://freestatistics.org/blog/index.php?pk=300717&T=1

Globally Unique Identifier (entire table): ba.freestatistics.org/blog/index.php?pk=300717&T=1

As an alternative you can also use a QR Code:  

The GUIDs for individual cells are displayed in the table below:

Frequency Table (Histogram)
BinsMidpointAbs. FrequencyRel. FrequencyCumul. Rel. Freq.Density
[3000,3500[325010.0158730.0158733.2e-05
[3500,4000[3750100.158730.1746030.000317
[4000,4500[425080.1269840.3015870.000254
[4500,5000[475060.0952380.3968250.00019
[5000,5500[525050.0793650.476190.000159
[5500,6000[575050.0793650.5555560.000159
[6000,6500[6250100.158730.7142860.000317
[6500,7000[675050.0793650.7936510.000159
[7000,7500[725050.0793650.8730160.000159
[7500,8000]775080.12698410.000254


Parameters (Session):
par2 = grey ; par3 = FALSE ; par4 = Unknown ;
Parameters (R input):
par1 = ; par2 = grey ; par3 = FALSE ; par4 = Unknown ;
R code (references can be found in the software module):
par1 <- as.numeric(par1)
if (par3 == 'TRUE') par3 <- TRUE
if (par3 == 'FALSE') par3 <- FALSE
if (par4 == 'Unknown') par1 <- as.numeric(par1)
if (par4 == 'Interval/Ratio') par1 <- as.numeric(par1)
if (par4 == '3-point Likert') par1 <- c(1:3 - 0.5, 3.5)
if (par4 == '4-point Likert') par1 <- c(1:4 - 0.5, 4.5)
if (par4 == '5-point Likert') par1 <- c(1:5 - 0.5, 5.5)
if (par4 == '6-point Likert') par1 <- c(1:6 - 0.5, 6.5)
if (par4 == '7-point Likert') par1 <- c(1:7 - 0.5, 7.5)
if (par4 == '8-point Likert') par1 <- c(1:8 - 0.5, 8.5)
if (par4 == '9-point Likert') par1 <- c(1:9 - 0.5, 9.5)
if (par4 == '10-point Likert') par1 <- c(1:10 - 0.5, 10.5)
bitmap(file='test1.png')
if(is.numeric(x[1])) {
if (is.na(par1)) {
myhist<-hist(x,col=par2,main=main,xlab=xlab,right=par3)
} else {
if (par1 < 0) par1 <- 3
if (par1 > 50) par1 <- 50
myhist<-hist(x,breaks=par1,col=par2,main=main,xlab=xlab,right=par3)
}
} else {
barplot(mytab <- sort(table(x),T),col=par2,main='Frequency Plot',xlab=xlab,ylab='Absolute Frequency')
}
dev.off()
if(is.numeric(x[1])) {
myhist
n <- length(x)
load(file='createtable')
a<-table.start()
a<-table.row.start(a)
a<-table.element(a,'Frequency Table (Histogram)',6,TRUE)
a<-table.row.end(a)
a<-table.row.start(a)
a<-table.element(a,'Bins',header=TRUE)
a<-table.element(a,'Midpoint',header=TRUE)
a<-table.element(a,'Abs. Frequency',header=TRUE)
a<-table.element(a,'Rel. Frequency',header=TRUE)
a<-table.element(a,'Cumul. Rel. Freq.',header=TRUE)
a<-table.element(a,'Density',header=TRUE)
a<-table.row.end(a)
crf <- 0
if (par3 == FALSE) mybracket <- '[' else mybracket <- ']'
mynumrows <- (length(myhist$breaks)-1)
for (i in 1:mynumrows) {
a<-table.row.start(a)
if (i == 1)
dum <- paste('[',myhist$breaks[i],sep='')
else
dum <- paste(mybracket,myhist$breaks[i],sep='')
dum <- paste(dum,myhist$breaks[i+1],sep=',')
if (i==mynumrows)
dum <- paste(dum,']',sep='')
else
dum <- paste(dum,mybracket,sep='')
a<-table.element(a,dum,header=TRUE)
a<-table.element(a,myhist$mids[i])
a<-table.element(a,myhist$counts[i])
rf <- myhist$counts[i]/n
crf <- crf + rf
a<-table.element(a,round(rf,6))
a<-table.element(a,round(crf,6))
a<-table.element(a,round(myhist$density[i],6))
a<-table.row.end(a)
}
a<-table.end(a)
table.save(a,file='mytable.tab')
} else {
mytab
reltab <- mytab / sum(mytab)
n <- length(mytab)
load(file='createtable')
a<-table.start()
a<-table.row.start(a)
a<-table.element(a,'Frequency Table (Categorical Data)',3,TRUE)
a<-table.row.end(a)
a<-table.row.start(a)
a<-table.element(a,'Category',header=TRUE)
a<-table.element(a,'Abs. Frequency',header=TRUE)
a<-table.element(a,'Rel. Frequency',header=TRUE)
a<-table.row.end(a)
for (i in 1:n) {
a<-table.row.start(a)
a<-table.element(a,labels(mytab)$x[i],header=TRUE)
a<-table.element(a,mytab[i])
a<-table.element(a,round(reltab[i],4))
a<-table.row.end(a)
}
a<-table.end(a)
table.save(a,file='mytable1.tab')
}