Free Statistics

of Irreproducible Research!

Author's title

Author*The author of this computation has been verified*
R Software Modulerwasp_exponentialsmoothing.wasp
Title produced by softwareExponential Smoothing
Date of computationSat, 17 Dec 2016 14:57:58 +0100
Cite this page as followsStatistical Computations at FreeStatistics.org, Office for Research Development and Education, URL https://freestatistics.org/blog/index.php?v=date/2016/Dec/17/t1481983093bdd9zy88fdhvr7y.htm/, Retrieved Thu, 02 May 2024 00:11:40 +0000
Statistical Computations at FreeStatistics.org, Office for Research Development and Education, URL https://freestatistics.org/blog/index.php?pk=300791, Retrieved Thu, 02 May 2024 00:11:40 +0000
QR Codes:

Original text written by user:
IsPrivate?No (this computation is public)
User-defined keywords
Estimated Impact72
Family? (F = Feedback message, R = changed R code, M = changed R Module, P = changed Parameters, D = changed Data)
-       [Exponential Smoothing] [N1179 Exponential...] [2016-12-17 13:57:58] [2e11ca31a00cf8de75c33c1af2d59434] [Current]
Feedback Forum

Post a new message
Dataseries X:
3128
3444
3428
3803
3044
3427
3246
3505
3052
3613
3555
3675
3267
3601
3501
3855


Summary of computational transaction
Raw Input view raw input (R code)
Raw Outputview raw output of R engine
Computing time1 seconds
R ServerBig Analytics Cloud Computing Center

\begin{tabular}{lllllllll}
\hline
Summary of computational transaction \tabularnewline
Raw Input view raw input (R code)  \tabularnewline
Raw Outputview raw output of R engine  \tabularnewline
Computing time1 seconds \tabularnewline
R ServerBig Analytics Cloud Computing Center \tabularnewline
\hline
\end{tabular}
%Source: https://freestatistics.org/blog/index.php?pk=300791&T=0

[TABLE]
[ROW]
Summary of computational transaction[/C][/ROW] [ROW]Raw Input[/C] view raw input (R code) [/C][/ROW] [ROW]Raw Output[/C]view raw output of R engine [/C][/ROW] [ROW]Computing time[/C]1 seconds[/C][/ROW] [ROW]R Server[/C]Big Analytics Cloud Computing Center[/C][/ROW] [/TABLE] Source: https://freestatistics.org/blog/index.php?pk=300791&T=0

Globally Unique Identifier (entire table): ba.freestatistics.org/blog/index.php?pk=300791&T=0

As an alternative you can also use a QR Code:  

The GUIDs for individual cells are displayed in the table below:

Summary of computational transaction
Raw Input view raw input (R code)
Raw Outputview raw output of R engine
Computing time1 seconds
R ServerBig Analytics Cloud Computing Center


Estimated Parameters of Exponential Smoothing
ParameterValue
alpha0.276706723331251
betaFALSE
gammaFALSE

\begin{tabular}{lllllllll}
\hline
Estimated Parameters of Exponential Smoothing \tabularnewline
Parameter & Value \tabularnewline
alpha & 0.276706723331251 \tabularnewline
beta & FALSE \tabularnewline
gamma & FALSE \tabularnewline
\hline
\end{tabular}
%Source: https://freestatistics.org/blog/index.php?pk=300791&T=1

[TABLE]
[ROW][C]Estimated Parameters of Exponential Smoothing[/C][/ROW]
[ROW][C]Parameter[/C][C]Value[/C][/ROW]
[ROW][C]alpha[/C][C]0.276706723331251[/C][/ROW]
[ROW][C]beta[/C][C]FALSE[/C][/ROW]
[ROW][C]gamma[/C][C]FALSE[/C][/ROW]
[/TABLE]
Source: https://freestatistics.org/blog/index.php?pk=300791&T=1

Globally Unique Identifier (entire table): ba.freestatistics.org/blog/index.php?pk=300791&T=1

As an alternative you can also use a QR Code:  

The GUIDs for individual cells are displayed in the table below:

Estimated Parameters of Exponential Smoothing
ParameterValue
alpha0.276706723331251
betaFALSE
gammaFALSE


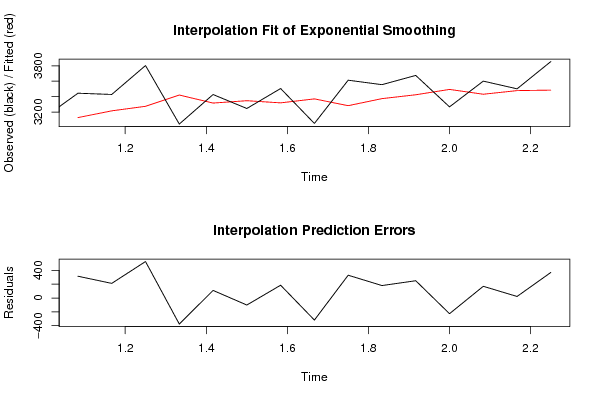
Interpolation Forecasts of Exponential Smoothing
tObservedFittedResiduals
234443128316
334283215.43932457268212.560675427324
438033274.25629257925528.743707420752
530443420.56323134166-376.563231341663
634273316.36565347008110.634346529917
732463346.97892098627-100.978920986271
835053319.03737463463185.962625365366
930523370.49448336156-318.494483361562
1036133282.3649184715330.635081528496
1135553373.85386849962181.146131500384
1236753423.97822099122251.021779008781
1332673493.43763494552-226.437634945521
1436013430.78081894087170.219181059132
1535013477.8816107798723.1183892201307
1638553484.27862450967370.721375490332

\begin{tabular}{lllllllll}
\hline
Interpolation Forecasts of Exponential Smoothing \tabularnewline
t & Observed & Fitted & Residuals \tabularnewline
2 & 3444 & 3128 & 316 \tabularnewline
3 & 3428 & 3215.43932457268 & 212.560675427324 \tabularnewline
4 & 3803 & 3274.25629257925 & 528.743707420752 \tabularnewline
5 & 3044 & 3420.56323134166 & -376.563231341663 \tabularnewline
6 & 3427 & 3316.36565347008 & 110.634346529917 \tabularnewline
7 & 3246 & 3346.97892098627 & -100.978920986271 \tabularnewline
8 & 3505 & 3319.03737463463 & 185.962625365366 \tabularnewline
9 & 3052 & 3370.49448336156 & -318.494483361562 \tabularnewline
10 & 3613 & 3282.3649184715 & 330.635081528496 \tabularnewline
11 & 3555 & 3373.85386849962 & 181.146131500384 \tabularnewline
12 & 3675 & 3423.97822099122 & 251.021779008781 \tabularnewline
13 & 3267 & 3493.43763494552 & -226.437634945521 \tabularnewline
14 & 3601 & 3430.78081894087 & 170.219181059132 \tabularnewline
15 & 3501 & 3477.88161077987 & 23.1183892201307 \tabularnewline
16 & 3855 & 3484.27862450967 & 370.721375490332 \tabularnewline
\hline
\end{tabular}
%Source: https://freestatistics.org/blog/index.php?pk=300791&T=2

[TABLE]
[ROW][C]Interpolation Forecasts of Exponential Smoothing[/C][/ROW]
[ROW][C]t[/C][C]Observed[/C][C]Fitted[/C][C]Residuals[/C][/ROW]
[ROW][C]2[/C][C]3444[/C][C]3128[/C][C]316[/C][/ROW]
[ROW][C]3[/C][C]3428[/C][C]3215.43932457268[/C][C]212.560675427324[/C][/ROW]
[ROW][C]4[/C][C]3803[/C][C]3274.25629257925[/C][C]528.743707420752[/C][/ROW]
[ROW][C]5[/C][C]3044[/C][C]3420.56323134166[/C][C]-376.563231341663[/C][/ROW]
[ROW][C]6[/C][C]3427[/C][C]3316.36565347008[/C][C]110.634346529917[/C][/ROW]
[ROW][C]7[/C][C]3246[/C][C]3346.97892098627[/C][C]-100.978920986271[/C][/ROW]
[ROW][C]8[/C][C]3505[/C][C]3319.03737463463[/C][C]185.962625365366[/C][/ROW]
[ROW][C]9[/C][C]3052[/C][C]3370.49448336156[/C][C]-318.494483361562[/C][/ROW]
[ROW][C]10[/C][C]3613[/C][C]3282.3649184715[/C][C]330.635081528496[/C][/ROW]
[ROW][C]11[/C][C]3555[/C][C]3373.85386849962[/C][C]181.146131500384[/C][/ROW]
[ROW][C]12[/C][C]3675[/C][C]3423.97822099122[/C][C]251.021779008781[/C][/ROW]
[ROW][C]13[/C][C]3267[/C][C]3493.43763494552[/C][C]-226.437634945521[/C][/ROW]
[ROW][C]14[/C][C]3601[/C][C]3430.78081894087[/C][C]170.219181059132[/C][/ROW]
[ROW][C]15[/C][C]3501[/C][C]3477.88161077987[/C][C]23.1183892201307[/C][/ROW]
[ROW][C]16[/C][C]3855[/C][C]3484.27862450967[/C][C]370.721375490332[/C][/ROW]
[/TABLE]
Source: https://freestatistics.org/blog/index.php?pk=300791&T=2

Globally Unique Identifier (entire table): ba.freestatistics.org/blog/index.php?pk=300791&T=2

As an alternative you can also use a QR Code:  

The GUIDs for individual cells are displayed in the table below:

Interpolation Forecasts of Exponential Smoothing
tObservedFittedResiduals
234443128316
334283215.43932457268212.560675427324
438033274.25629257925528.743707420752
530443420.56323134166-376.563231341663
634273316.36565347008110.634346529917
732463346.97892098627-100.978920986271
835053319.03737463463185.962625365366
930523370.49448336156-318.494483361562
1036133282.3649184715330.635081528496
1135553373.85386849962181.146131500384
1236753423.97822099122251.021779008781
1332673493.43763494552-226.437634945521
1436013430.78081894087170.219181059132
1535013477.8816107798723.1183892201307
1638553484.27862450967370.721375490332


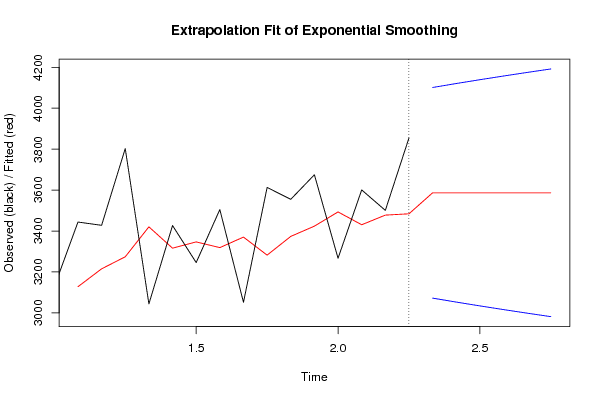
Extrapolation Forecasts of Exponential Smoothing
tForecast95% Lower Bound95% Upper Bound
173586.859721590453072.312521749294101.40692143162
183586.859721590453052.977237853984120.74220532692
193586.859721590453034.318146668844139.40129651207
203586.859721590453016.26890708934157.45053609161
213586.859721590452998.773364692654174.94607848825
223586.859721590452981.783487760734191.93595542018

\begin{tabular}{lllllllll}
\hline
Extrapolation Forecasts of Exponential Smoothing \tabularnewline
t & Forecast & 95% Lower Bound & 95% Upper Bound \tabularnewline
17 & 3586.85972159045 & 3072.31252174929 & 4101.40692143162 \tabularnewline
18 & 3586.85972159045 & 3052.97723785398 & 4120.74220532692 \tabularnewline
19 & 3586.85972159045 & 3034.31814666884 & 4139.40129651207 \tabularnewline
20 & 3586.85972159045 & 3016.2689070893 & 4157.45053609161 \tabularnewline
21 & 3586.85972159045 & 2998.77336469265 & 4174.94607848825 \tabularnewline
22 & 3586.85972159045 & 2981.78348776073 & 4191.93595542018 \tabularnewline
\hline
\end{tabular}
%Source: https://freestatistics.org/blog/index.php?pk=300791&T=3

[TABLE]
[ROW][C]Extrapolation Forecasts of Exponential Smoothing[/C][/ROW]
[ROW][C]t[/C][C]Forecast[/C][C]95% Lower Bound[/C][C]95% Upper Bound[/C][/ROW]
[ROW][C]17[/C][C]3586.85972159045[/C][C]3072.31252174929[/C][C]4101.40692143162[/C][/ROW]
[ROW][C]18[/C][C]3586.85972159045[/C][C]3052.97723785398[/C][C]4120.74220532692[/C][/ROW]
[ROW][C]19[/C][C]3586.85972159045[/C][C]3034.31814666884[/C][C]4139.40129651207[/C][/ROW]
[ROW][C]20[/C][C]3586.85972159045[/C][C]3016.2689070893[/C][C]4157.45053609161[/C][/ROW]
[ROW][C]21[/C][C]3586.85972159045[/C][C]2998.77336469265[/C][C]4174.94607848825[/C][/ROW]
[ROW][C]22[/C][C]3586.85972159045[/C][C]2981.78348776073[/C][C]4191.93595542018[/C][/ROW]
[/TABLE]
Source: https://freestatistics.org/blog/index.php?pk=300791&T=3

Globally Unique Identifier (entire table): ba.freestatistics.org/blog/index.php?pk=300791&T=3

As an alternative you can also use a QR Code:  

The GUIDs for individual cells are displayed in the table below:

Extrapolation Forecasts of Exponential Smoothing
tForecast95% Lower Bound95% Upper Bound
173586.859721590453072.312521749294101.40692143162
183586.859721590453052.977237853984120.74220532692
193586.859721590453034.318146668844139.40129651207
203586.859721590453016.26890708934157.45053609161
213586.859721590452998.773364692654174.94607848825
223586.859721590452981.783487760734191.93595542018


Parameters (Session):
par1 = Default ; par2 = 1 ; par3 = 1 ; par4 = 0 ; par5 = 12 ; par6 = White Noise ; par7 = 0.95 ;
Parameters (R input):
par1 = 12 ; par2 = Single ; par3 = additive ; par4 = 6 ;
R code (references can be found in the software module):
par4 <- '6'
par3 <- 'additive'
par2 <- 'Single'
par1 <- 'Default'
par1 <- as.numeric(par1)
par4 <- as.numeric(par4)
if (par2 == 'Single') K <- 1
if (par2 == 'Double') K <- 2
if (par2 == 'Triple') K <- par1
nx <- length(x)
nxmK <- nx - K
x <- ts(x, frequency = par1)
if (par2 == 'Single') fit <- HoltWinters(x, gamma=F, beta=F)
if (par2 == 'Double') fit <- HoltWinters(x, gamma=F)
if (par2 == 'Triple') fit <- HoltWinters(x, seasonal=par3)
fit
myresid <- x - fit$fitted[,'xhat']
bitmap(file='test1.png')
op <- par(mfrow=c(2,1))
plot(fit,ylab='Observed (black) / Fitted (red)',main='Interpolation Fit of Exponential Smoothing')
plot(myresid,ylab='Residuals',main='Interpolation Prediction Errors')
par(op)
dev.off()
bitmap(file='test2.png')
p <- predict(fit, par4, prediction.interval=TRUE)
np <- length(p[,1])
plot(fit,p,ylab='Observed (black) / Fitted (red)',main='Extrapolation Fit of Exponential Smoothing')
dev.off()
bitmap(file='test3.png')
op <- par(mfrow = c(2,2))
acf(as.numeric(myresid),lag.max = nx/2,main='Residual ACF')
spectrum(myresid,main='Residals Periodogram')
cpgram(myresid,main='Residal Cumulative Periodogram')
qqnorm(myresid,main='Residual Normal QQ Plot')
qqline(myresid)
par(op)
dev.off()
load(file='createtable')
a<-table.start()
a<-table.row.start(a)
a<-table.element(a,'Estimated Parameters of Exponential Smoothing',2,TRUE)
a<-table.row.end(a)
a<-table.row.start(a)
a<-table.element(a,'Parameter',header=TRUE)
a<-table.element(a,'Value',header=TRUE)
a<-table.row.end(a)
a<-table.row.start(a)
a<-table.element(a,'alpha',header=TRUE)
a<-table.element(a,fit$alpha)
a<-table.row.end(a)
a<-table.row.start(a)
a<-table.element(a,'beta',header=TRUE)
a<-table.element(a,fit$beta)
a<-table.row.end(a)
a<-table.row.start(a)
a<-table.element(a,'gamma',header=TRUE)
a<-table.element(a,fit$gamma)
a<-table.row.end(a)
a<-table.end(a)
table.save(a,file='mytable.tab')
a<-table.start()
a<-table.row.start(a)
a<-table.element(a,'Interpolation Forecasts of Exponential Smoothing',4,TRUE)
a<-table.row.end(a)
a<-table.row.start(a)
a<-table.element(a,'t',header=TRUE)
a<-table.element(a,'Observed',header=TRUE)
a<-table.element(a,'Fitted',header=TRUE)
a<-table.element(a,'Residuals',header=TRUE)
a<-table.row.end(a)
for (i in 1:nxmK) {
a<-table.row.start(a)
a<-table.element(a,i+K,header=TRUE)
a<-table.element(a,x[i+K])
a<-table.element(a,fit$fitted[i,'xhat'])
a<-table.element(a,myresid[i])
a<-table.row.end(a)
}
a<-table.end(a)
table.save(a,file='mytable1.tab')
a<-table.start()
a<-table.row.start(a)
a<-table.element(a,'Extrapolation Forecasts of Exponential Smoothing',4,TRUE)
a<-table.row.end(a)
a<-table.row.start(a)
a<-table.element(a,'t',header=TRUE)
a<-table.element(a,'Forecast',header=TRUE)
a<-table.element(a,'95% Lower Bound',header=TRUE)
a<-table.element(a,'95% Upper Bound',header=TRUE)
a<-table.row.end(a)
for (i in 1:np) {
a<-table.row.start(a)
a<-table.element(a,nx+i,header=TRUE)
a<-table.element(a,p[i,'fit'])
a<-table.element(a,p[i,'lwr'])
a<-table.element(a,p[i,'upr'])
a<-table.row.end(a)
}
a<-table.end(a)
table.save(a,file='mytable2.tab')