Free Statistics

of Irreproducible Research!

Author's title

Author*The author of this computation has been verified*
R Software Modulerwasp_structuraltimeseries.wasp
Title produced by softwareStructural Time Series Models
Date of computationSat, 17 Dec 2016 15:28:54 +0100
Cite this page as followsStatistical Computations at FreeStatistics.org, Office for Research Development and Education, URL https://freestatistics.org/blog/index.php?v=date/2016/Dec/17/t1481985000xac8l7021iykr5u.htm/, Retrieved Thu, 02 May 2024 00:16:19 +0000
Statistical Computations at FreeStatistics.org, Office for Research Development and Education, URL https://freestatistics.org/blog/index.php?pk=300812, Retrieved Thu, 02 May 2024 00:16:19 +0000
QR Codes:

Original text written by user:
IsPrivate?No (this computation is public)
User-defined keywords
Estimated Impact91
Family? (F = Feedback message, R = changed R code, M = changed R Module, P = changed Parameters, D = changed Data)
-       [Structural Time Series Models] [] [2016-12-17 14:28:54] [6e17bb30248b72d8119c893128a7a697] [Current]
Feedback Forum

Post a new message
Dataseries X:
3228
3480.8
3621.8
3667.6
3458.4
3594.2
3780.8
3807.8
3595.4
3798
3966
3985.4
3755.4
3972
4189.6
4142.8


Summary of computational transaction
Raw Input view raw input (R code)
Raw Outputview raw output of R engine
Computing time3 seconds
R ServerBig Analytics Cloud Computing Center

\begin{tabular}{lllllllll}
\hline
Summary of computational transaction \tabularnewline
Raw Input view raw input (R code)  \tabularnewline
Raw Outputview raw output of R engine  \tabularnewline
Computing time3 seconds \tabularnewline
R ServerBig Analytics Cloud Computing Center \tabularnewline
\hline
\end{tabular}
%Source: https://freestatistics.org/blog/index.php?pk=300812&T=0

[TABLE]
[ROW]
Summary of computational transaction[/C][/ROW] [ROW]Raw Input[/C] view raw input (R code) [/C][/ROW] [ROW]Raw Output[/C]view raw output of R engine [/C][/ROW] [ROW]Computing time[/C]3 seconds[/C][/ROW] [ROW]R Server[/C]Big Analytics Cloud Computing Center[/C][/ROW] [/TABLE] Source: https://freestatistics.org/blog/index.php?pk=300812&T=0

Globally Unique Identifier (entire table): ba.freestatistics.org/blog/index.php?pk=300812&T=0

As an alternative you can also use a QR Code:  

The GUIDs for individual cells are displayed in the table below:

Summary of computational transaction
Raw Input view raw input (R code)
Raw Outputview raw output of R engine
Computing time3 seconds
R ServerBig Analytics Cloud Computing Center


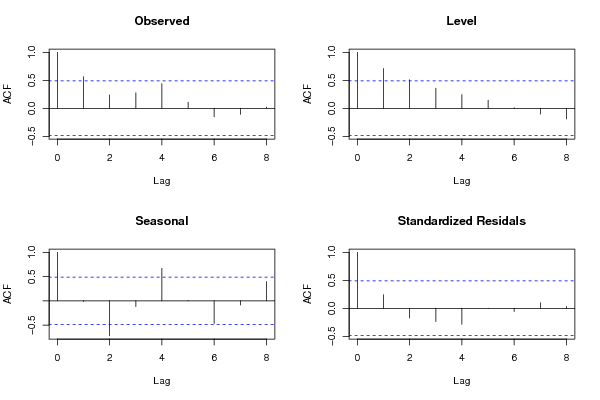
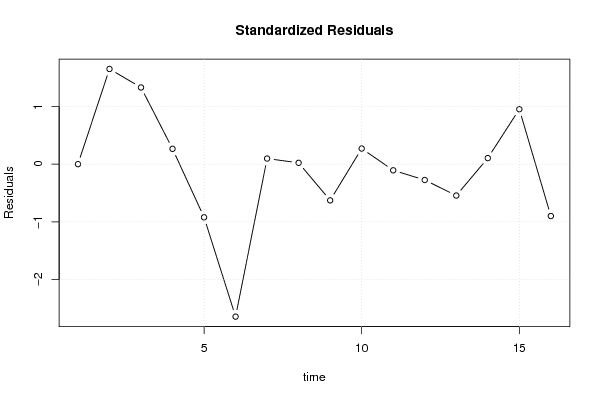
Structural Time Series Model -- Interpolation
tObservedLevelSlopeSeasonalStand. Residuals
132283228000
23480.83436.2123574135553.484866483511844.58764258644621.6511444710944
33621.83536.6495920048963.381662006235685.15040799510891.33005556221672
43667.63607.8308486067364.591119433155859.76915139327290.266026767771487
53458.43645.5264983064362.7308202977208-187.126498306435-0.921713172392771
63594.23623.2154510010250.9125018829873-29.0154510010249-2.64483715560918
73780.83677.3544031135251.4381177219266103.4455968864810.0971979117000578
83807.83729.5274520259951.553051701624878.2725479740090.022912026721026
93595.43760.9983740978748.6004944932617-165.598374097866-0.628061828524111
1037983818.3367661435349.9396181541766-20.33676614353450.270525666672769
1139663864.8069590559149.3886522145533101.193040944094-0.106427875329824
123985.43905.258258411447.967707913224680.1417415885982-0.275018663132168
133755.43935.5456002085445.1766469452863-180.145600208539-0.544692948915019
1439723984.1264147133445.7159835014382-12.12641471334070.104748511064367
154189.64060.8503154901450.6579975501294128.7496845098570.952654440279375
164142.84082.2281538965345.984229664328260.5718461034685-0.89959365613178

\begin{tabular}{lllllllll}
\hline
Structural Time Series Model -- Interpolation \tabularnewline
t & Observed & Level & Slope & Seasonal & Stand. Residuals \tabularnewline
1 & 3228 & 3228 & 0 & 0 & 0 \tabularnewline
2 & 3480.8 & 3436.21235741355 & 53.4848664835118 & 44.5876425864462 & 1.6511444710944 \tabularnewline
3 & 3621.8 & 3536.64959200489 & 63.3816620062356 & 85.1504079951089 & 1.33005556221672 \tabularnewline
4 & 3667.6 & 3607.83084860673 & 64.5911194331558 & 59.7691513932729 & 0.266026767771487 \tabularnewline
5 & 3458.4 & 3645.52649830643 & 62.7308202977208 & -187.126498306435 & -0.921713172392771 \tabularnewline
6 & 3594.2 & 3623.21545100102 & 50.9125018829873 & -29.0154510010249 & -2.64483715560918 \tabularnewline
7 & 3780.8 & 3677.35440311352 & 51.4381177219266 & 103.445596886481 & 0.0971979117000578 \tabularnewline
8 & 3807.8 & 3729.52745202599 & 51.5530517016248 & 78.272547974009 & 0.022912026721026 \tabularnewline
9 & 3595.4 & 3760.99837409787 & 48.6004944932617 & -165.598374097866 & -0.628061828524111 \tabularnewline
10 & 3798 & 3818.33676614353 & 49.9396181541766 & -20.3367661435345 & 0.270525666672769 \tabularnewline
11 & 3966 & 3864.80695905591 & 49.3886522145533 & 101.193040944094 & -0.106427875329824 \tabularnewline
12 & 3985.4 & 3905.2582584114 & 47.9677079132246 & 80.1417415885982 & -0.275018663132168 \tabularnewline
13 & 3755.4 & 3935.54560020854 & 45.1766469452863 & -180.145600208539 & -0.544692948915019 \tabularnewline
14 & 3972 & 3984.12641471334 & 45.7159835014382 & -12.1264147133407 & 0.104748511064367 \tabularnewline
15 & 4189.6 & 4060.85031549014 & 50.6579975501294 & 128.749684509857 & 0.952654440279375 \tabularnewline
16 & 4142.8 & 4082.22815389653 & 45.9842296643282 & 60.5718461034685 & -0.89959365613178 \tabularnewline
\hline
\end{tabular}
%Source: https://freestatistics.org/blog/index.php?pk=300812&T=1

[TABLE]
[ROW][C]Structural Time Series Model -- Interpolation[/C][/ROW]
[ROW][C]t[/C][C]Observed[/C][C]Level[/C][C]Slope[/C][C]Seasonal[/C][C]Stand. Residuals[/C][/ROW]
[ROW][C]1[/C][C]3228[/C][C]3228[/C][C]0[/C][C]0[/C][C]0[/C][/ROW]
[ROW][C]2[/C][C]3480.8[/C][C]3436.21235741355[/C][C]53.4848664835118[/C][C]44.5876425864462[/C][C]1.6511444710944[/C][/ROW]
[ROW][C]3[/C][C]3621.8[/C][C]3536.64959200489[/C][C]63.3816620062356[/C][C]85.1504079951089[/C][C]1.33005556221672[/C][/ROW]
[ROW][C]4[/C][C]3667.6[/C][C]3607.83084860673[/C][C]64.5911194331558[/C][C]59.7691513932729[/C][C]0.266026767771487[/C][/ROW]
[ROW][C]5[/C][C]3458.4[/C][C]3645.52649830643[/C][C]62.7308202977208[/C][C]-187.126498306435[/C][C]-0.921713172392771[/C][/ROW]
[ROW][C]6[/C][C]3594.2[/C][C]3623.21545100102[/C][C]50.9125018829873[/C][C]-29.0154510010249[/C][C]-2.64483715560918[/C][/ROW]
[ROW][C]7[/C][C]3780.8[/C][C]3677.35440311352[/C][C]51.4381177219266[/C][C]103.445596886481[/C][C]0.0971979117000578[/C][/ROW]
[ROW][C]8[/C][C]3807.8[/C][C]3729.52745202599[/C][C]51.5530517016248[/C][C]78.272547974009[/C][C]0.022912026721026[/C][/ROW]
[ROW][C]9[/C][C]3595.4[/C][C]3760.99837409787[/C][C]48.6004944932617[/C][C]-165.598374097866[/C][C]-0.628061828524111[/C][/ROW]
[ROW][C]10[/C][C]3798[/C][C]3818.33676614353[/C][C]49.9396181541766[/C][C]-20.3367661435345[/C][C]0.270525666672769[/C][/ROW]
[ROW][C]11[/C][C]3966[/C][C]3864.80695905591[/C][C]49.3886522145533[/C][C]101.193040944094[/C][C]-0.106427875329824[/C][/ROW]
[ROW][C]12[/C][C]3985.4[/C][C]3905.2582584114[/C][C]47.9677079132246[/C][C]80.1417415885982[/C][C]-0.275018663132168[/C][/ROW]
[ROW][C]13[/C][C]3755.4[/C][C]3935.54560020854[/C][C]45.1766469452863[/C][C]-180.145600208539[/C][C]-0.544692948915019[/C][/ROW]
[ROW][C]14[/C][C]3972[/C][C]3984.12641471334[/C][C]45.7159835014382[/C][C]-12.1264147133407[/C][C]0.104748511064367[/C][/ROW]
[ROW][C]15[/C][C]4189.6[/C][C]4060.85031549014[/C][C]50.6579975501294[/C][C]128.749684509857[/C][C]0.952654440279375[/C][/ROW]
[ROW][C]16[/C][C]4142.8[/C][C]4082.22815389653[/C][C]45.9842296643282[/C][C]60.5718461034685[/C][C]-0.89959365613178[/C][/ROW]
[/TABLE]
Source: https://freestatistics.org/blog/index.php?pk=300812&T=1

Globally Unique Identifier (entire table): ba.freestatistics.org/blog/index.php?pk=300812&T=1

As an alternative you can also use a QR Code:  

The GUIDs for individual cells are displayed in the table below:

Structural Time Series Model -- Interpolation
tObservedLevelSlopeSeasonalStand. Residuals
132283228000
23480.83436.2123574135553.484866483511844.58764258644621.6511444710944
33621.83536.6495920048963.381662006235685.15040799510891.33005556221672
43667.63607.8308486067364.591119433155859.76915139327290.266026767771487
53458.43645.5264983064362.7308202977208-187.126498306435-0.921713172392771
63594.23623.2154510010250.9125018829873-29.0154510010249-2.64483715560918
73780.83677.3544031135251.4381177219266103.4455968864810.0971979117000578
83807.83729.5274520259951.553051701624878.2725479740090.022912026721026
93595.43760.9983740978748.6004944932617-165.598374097866-0.628061828524111
1037983818.3367661435349.9396181541766-20.33676614353450.270525666672769
1139663864.8069590559149.3886522145533101.193040944094-0.106427875329824
123985.43905.258258411447.967707913224680.1417415885982-0.275018663132168
133755.43935.5456002085445.1766469452863-180.145600208539-0.544692948915019
1439723984.1264147133445.7159835014382-12.12641471334070.104748511064367
154189.64060.8503154901450.6579975501294128.7496845098570.952654440279375
164142.84082.2281538965345.984229664328260.5718461034685-0.89959365613178


Structural Time Series Model -- Extrapolation
tObservedLevelSeasonal
13945.9742700284126.02494454367-180.050674515676
24147.272040143174170.20418902846-22.9321488852916
34356.41195697314214.38343351325142.028523459853
44319.516977939154258.5626779980360.9542999411146
54122.691247967144302.74192248282-180.050674515676
64323.989018082314346.92116696761-22.9321488852916
74533.128934912254391.10041145239142.028523459853
84496.23395587834435.2796559371860.9542999411146
94299.408225906294479.45890042197-180.050674515676
104500.705996021464523.63814490675-22.9321488852916
114709.84591285144567.81738939154142.028523459853
124672.950933817444611.9966338763360.9542999411146
134476.125203845444656.17587836112-180.050674515676
144677.422973960614700.3551228459-22.9321488852916
154886.562890790544744.53436733069142.028523459853
164849.667911756594788.7136118154860.9542999411146
174652.842181784594832.89285630026-180.050674515676
184854.139951899764877.07210078505-22.9321488852916

\begin{tabular}{lllllllll}
\hline
Structural Time Series Model -- Extrapolation \tabularnewline
t & Observed & Level & Seasonal \tabularnewline
1 & 3945.974270028 & 4126.02494454367 & -180.050674515676 \tabularnewline
2 & 4147.27204014317 & 4170.20418902846 & -22.9321488852916 \tabularnewline
3 & 4356.4119569731 & 4214.38343351325 & 142.028523459853 \tabularnewline
4 & 4319.51697793915 & 4258.56267799803 & 60.9542999411146 \tabularnewline
5 & 4122.69124796714 & 4302.74192248282 & -180.050674515676 \tabularnewline
6 & 4323.98901808231 & 4346.92116696761 & -22.9321488852916 \tabularnewline
7 & 4533.12893491225 & 4391.10041145239 & 142.028523459853 \tabularnewline
8 & 4496.2339558783 & 4435.27965593718 & 60.9542999411146 \tabularnewline
9 & 4299.40822590629 & 4479.45890042197 & -180.050674515676 \tabularnewline
10 & 4500.70599602146 & 4523.63814490675 & -22.9321488852916 \tabularnewline
11 & 4709.8459128514 & 4567.81738939154 & 142.028523459853 \tabularnewline
12 & 4672.95093381744 & 4611.99663387633 & 60.9542999411146 \tabularnewline
13 & 4476.12520384544 & 4656.17587836112 & -180.050674515676 \tabularnewline
14 & 4677.42297396061 & 4700.3551228459 & -22.9321488852916 \tabularnewline
15 & 4886.56289079054 & 4744.53436733069 & 142.028523459853 \tabularnewline
16 & 4849.66791175659 & 4788.71361181548 & 60.9542999411146 \tabularnewline
17 & 4652.84218178459 & 4832.89285630026 & -180.050674515676 \tabularnewline
18 & 4854.13995189976 & 4877.07210078505 & -22.9321488852916 \tabularnewline
\hline
\end{tabular}
%Source: https://freestatistics.org/blog/index.php?pk=300812&T=2

[TABLE]
[ROW][C]Structural Time Series Model -- Extrapolation[/C][/ROW]
[ROW][C]t[/C][C]Observed[/C][C]Level[/C][C]Seasonal[/C][/ROW]
[ROW][C]1[/C][C]3945.974270028[/C][C]4126.02494454367[/C][C]-180.050674515676[/C][/ROW]
[ROW][C]2[/C][C]4147.27204014317[/C][C]4170.20418902846[/C][C]-22.9321488852916[/C][/ROW]
[ROW][C]3[/C][C]4356.4119569731[/C][C]4214.38343351325[/C][C]142.028523459853[/C][/ROW]
[ROW][C]4[/C][C]4319.51697793915[/C][C]4258.56267799803[/C][C]60.9542999411146[/C][/ROW]
[ROW][C]5[/C][C]4122.69124796714[/C][C]4302.74192248282[/C][C]-180.050674515676[/C][/ROW]
[ROW][C]6[/C][C]4323.98901808231[/C][C]4346.92116696761[/C][C]-22.9321488852916[/C][/ROW]
[ROW][C]7[/C][C]4533.12893491225[/C][C]4391.10041145239[/C][C]142.028523459853[/C][/ROW]
[ROW][C]8[/C][C]4496.2339558783[/C][C]4435.27965593718[/C][C]60.9542999411146[/C][/ROW]
[ROW][C]9[/C][C]4299.40822590629[/C][C]4479.45890042197[/C][C]-180.050674515676[/C][/ROW]
[ROW][C]10[/C][C]4500.70599602146[/C][C]4523.63814490675[/C][C]-22.9321488852916[/C][/ROW]
[ROW][C]11[/C][C]4709.8459128514[/C][C]4567.81738939154[/C][C]142.028523459853[/C][/ROW]
[ROW][C]12[/C][C]4672.95093381744[/C][C]4611.99663387633[/C][C]60.9542999411146[/C][/ROW]
[ROW][C]13[/C][C]4476.12520384544[/C][C]4656.17587836112[/C][C]-180.050674515676[/C][/ROW]
[ROW][C]14[/C][C]4677.42297396061[/C][C]4700.3551228459[/C][C]-22.9321488852916[/C][/ROW]
[ROW][C]15[/C][C]4886.56289079054[/C][C]4744.53436733069[/C][C]142.028523459853[/C][/ROW]
[ROW][C]16[/C][C]4849.66791175659[/C][C]4788.71361181548[/C][C]60.9542999411146[/C][/ROW]
[ROW][C]17[/C][C]4652.84218178459[/C][C]4832.89285630026[/C][C]-180.050674515676[/C][/ROW]
[ROW][C]18[/C][C]4854.13995189976[/C][C]4877.07210078505[/C][C]-22.9321488852916[/C][/ROW]
[/TABLE]
Source: https://freestatistics.org/blog/index.php?pk=300812&T=2

Globally Unique Identifier (entire table): ba.freestatistics.org/blog/index.php?pk=300812&T=2

As an alternative you can also use a QR Code:  

The GUIDs for individual cells are displayed in the table below:

Structural Time Series Model -- Extrapolation
tObservedLevelSeasonal
13945.9742700284126.02494454367-180.050674515676
24147.272040143174170.20418902846-22.9321488852916
34356.41195697314214.38343351325142.028523459853
44319.516977939154258.5626779980360.9542999411146
54122.691247967144302.74192248282-180.050674515676
64323.989018082314346.92116696761-22.9321488852916
74533.128934912254391.10041145239142.028523459853
84496.23395587834435.2796559371860.9542999411146
94299.408225906294479.45890042197-180.050674515676
104500.705996021464523.63814490675-22.9321488852916
114709.84591285144567.81738939154142.028523459853
124672.950933817444611.9966338763360.9542999411146
134476.125203845444656.17587836112-180.050674515676
144677.422973960614700.3551228459-22.9321488852916
154886.562890790544744.53436733069142.028523459853
164849.667911756594788.7136118154860.9542999411146
174652.842181784594832.89285630026-180.050674515676
184854.139951899764877.07210078505-22.9321488852916


Parameters (Session):
par1 = FALSE ; par2 = 1 ; par3 = 1 ; par4 = 0 ; par5 = 4 ; par6 = 3 ; par7 = 1 ; par8 = 2 ; par9 = 1 ;
Parameters (R input):
par1 = 4 ; par2 = 18 ; par3 = BFGS ;
R code (references can be found in the software module):
par3 <- 'BFGS'
par2 <- '12'
par1 <- '4'
require('stsm')
require('stsm.class')
require('KFKSDS')
par1 <- as.numeric(par1)
par2 <- as.numeric(par2)
nx <- length(x)
x <- ts(x,frequency=par1)
m <- StructTS(x,type='BSM')
print(m$coef)
print(m$fitted)
print(m$resid)
mylevel <- as.numeric(m$fitted[,'level'])
myslope <- as.numeric(m$fitted[,'slope'])
myseas <- as.numeric(m$fitted[,'sea'])
myresid <- as.numeric(m$resid)
myfit <- mylevel+myseas
mm <- stsm.model(model = 'BSM', y = x, transPars = 'StructTS')
fit2 <- stsmFit(mm, stsm.method = 'maxlik.td.optim', method = par3, KF.args = list(P0cov = TRUE))
(fit2.comps <- tsSmooth(fit2, P0cov = FALSE)$states)
m2 <- set.pars(mm, pmax(fit2$par, .Machine$double.eps))
(ss <- char2numeric(m2))
(pred <- predict(ss, x, n.ahead = par2))
mylagmax <- nx/2
bitmap(file='test2.png')
op <- par(mfrow = c(2,2))
acf(as.numeric(x),lag.max = mylagmax,main='Observed')
acf(mylevel,na.action=na.pass,lag.max = mylagmax,main='Level')
acf(myseas,na.action=na.pass,lag.max = mylagmax,main='Seasonal')
acf(myresid,na.action=na.pass,lag.max = mylagmax,main='Standardized Residals')
par(op)
dev.off()
bitmap(file='test3.png')
op <- par(mfrow = c(2,2))
spectrum(as.numeric(x),main='Observed')
spectrum(mylevel,main='Level')
spectrum(myseas,main='Seasonal')
spectrum(myresid,main='Standardized Residals')
par(op)
dev.off()
bitmap(file='test4.png')
op <- par(mfrow = c(2,2))
cpgram(as.numeric(x),main='Observed')
cpgram(mylevel,main='Level')
cpgram(myseas,main='Seasonal')
cpgram(myresid,main='Standardized Residals')
par(op)
dev.off()
bitmap(file='test1.png')
plot(as.numeric(m$resid),main='Standardized Residuals',ylab='Residuals',xlab='time',type='b')
grid()
dev.off()
bitmap(file='test5.png')
op <- par(mfrow = c(2,2))
hist(m$resid,main='Residual Histogram')
plot(density(m$resid),main='Residual Kernel Density')
qqnorm(m$resid,main='Residual Normal QQ Plot')
qqline(m$resid)
plot(m$resid^2, myfit^2,main='Sq.Resid vs. Sq.Fit',xlab='Squared residuals',ylab='Squared Fit')
par(op)
dev.off()
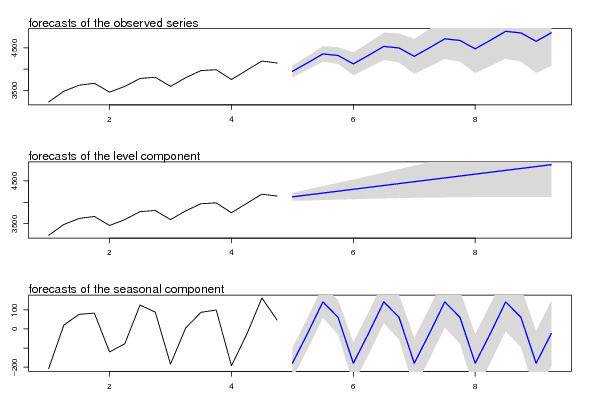
bitmap(file='test6.png')
par(mfrow = c(3,1), mar = c(3,3,3,3))
plot(cbind(x, pred$pred), type = 'n', plot.type = 'single', ylab = '')
lines(x)
polygon(c(time(pred$pred), rev(time(pred$pred))), c(pred$pred + 2 * pred$se, rev(pred$pred)), col = 'gray85', border = NA)
polygon(c(time(pred$pred), rev(time(pred$pred))), c(pred$pred - 2 * pred$se, rev(pred$pred)), col = ' gray85', border = NA)
lines(pred$pred, col = 'blue', lwd = 1.5)
mtext(text = 'forecasts of the observed series', side = 3, adj = 0)
plot(cbind(x, pred$a[,1]), type = 'n', plot.type = 'single', ylab = '')
lines(x)
polygon(c(time(pred$a[,1]), rev(time(pred$a[,1]))), c(pred$a[,1] + 2 * sqrt(pred$P[,1]), rev(pred$a[,1])), col = 'gray85', border = NA)
polygon(c(time(pred$a[,1]), rev(time(pred$a[,1]))), c(pred$a[,1] - 2 * sqrt(pred$P[,1]), rev(pred$a[,1])), col = ' gray85', border = NA)
lines(pred$a[,1], col = 'blue', lwd = 1.5)
mtext(text = 'forecasts of the level component', side = 3, adj = 0)
plot(cbind(fit2.comps[,3], pred$a[,3]), type = 'n', plot.type = 'single', ylab = '')
lines(fit2.comps[,3])
polygon(c(time(pred$a[,3]), rev(time(pred$a[,3]))), c(pred$a[,3] + 2 * sqrt(pred$P[,3]), rev(pred$a[,3])), col = 'gray85', border = NA)
polygon(c(time(pred$a[,3]), rev(time(pred$a[,3]))), c(pred$a[,3] - 2 * sqrt(pred$P[,3]), rev(pred$a[,3])), col = ' gray85', border = NA)
lines(pred$a[,3], col = 'blue', lwd = 1.5)
mtext(text = 'forecasts of the seasonal component', side = 3, adj = 0)
dev.off()
load(file='createtable')
a<-table.start()
a<-table.row.start(a)
a<-table.element(a,'Structural Time Series Model -- Interpolation',6,TRUE)
a<-table.row.end(a)
a<-table.row.start(a)
a<-table.element(a,'t',header=TRUE)
a<-table.element(a,'Observed',header=TRUE)
a<-table.element(a,'Level',header=TRUE)
a<-table.element(a,'Slope',header=TRUE)
a<-table.element(a,'Seasonal',header=TRUE)
a<-table.element(a,'Stand. Residuals',header=TRUE)
a<-table.row.end(a)
for (i in 1:nx) {
a<-table.row.start(a)
a<-table.element(a,i,header=TRUE)
a<-table.element(a,x[i])
a<-table.element(a,mylevel[i])
a<-table.element(a,myslope[i])
a<-table.element(a,myseas[i])
a<-table.element(a,myresid[i])
a<-table.row.end(a)
}
a<-table.end(a)
table.save(a,file='mytable.tab')
a<-table.start()
a<-table.row.start(a)
a<-table.element(a,'Structural Time Series Model -- Extrapolation',4,TRUE)
a<-table.row.end(a)
a<-table.row.start(a)
a<-table.element(a,'t',header=TRUE)
a<-table.element(a,'Observed',header=TRUE)
a<-table.element(a,'Level',header=TRUE)
a<-table.element(a,'Seasonal',header=TRUE)
a<-table.row.end(a)
for (i in 1:par2) {
a<-table.row.start(a)
a<-table.element(a,i,header=TRUE)
a<-table.element(a,pred$pred[i])
a<-table.element(a,pred$a[i,1])
a<-table.element(a,pred$a[i,3])
a<-table.row.end(a)
}
a<-table.end(a)
table.save(a,file='mytable1.tab')