Free Statistics

of Irreproducible Research!

Author's title

Author*The author of this computation has been verified*
R Software Modulerwasp_autocorrelation.wasp
Title produced by software(Partial) Autocorrelation Function
Date of computationSat, 17 Dec 2016 16:02:10 +0100
Cite this page as followsStatistical Computations at FreeStatistics.org, Office for Research Development and Education, URL https://freestatistics.org/blog/index.php?v=date/2016/Dec/17/t1481987067lgja3zzorpknepz.htm/, Retrieved Thu, 02 May 2024 03:51:10 +0000
Statistical Computations at FreeStatistics.org, Office for Research Development and Education, URL https://freestatistics.org/blog/index.php?pk=300842, Retrieved Thu, 02 May 2024 03:51:10 +0000
QR Codes:

Original text written by user:
IsPrivate?No (this computation is public)
User-defined keywords
Estimated Impact66
Family? (F = Feedback message, R = changed R code, M = changed R Module, P = changed Parameters, D = changed Data)
-       [(Partial) Autocorrelation Function] [""N2582"" autocorr 2] [2016-12-17 15:02:10] [afe7f6443461a2cd6ee0b843643e84a9] [Current]
Feedback Forum

Post a new message
Dataseries X:
4028.8
4076.6
4125.8
4177.2
4183
4222.6
4255.8
4260.8
4279.2
4328.8
4356.6
4393
4419.4
4426.2
4467.2
4517.4
4517
4560.4
4589
4596
4621.2
4654.6
4708.6
4774.4
4824.8
4839
4869.8
4895.8
4895.8
4968.8
5010
5032.4
5054
5083.8
5117.4
5170.8
5182.2
5163.6
5212.6
5288
5303.4
5367.6
5433.8
5465.8
5493.8
5549.4
5590.2
5661.2
5699
5654.2
5671.8
5730.8
5693
5720.4
5747.8
5764.2
5783
5822.4
5836.2
5864.6
5913.4
5906.8
5954
6031.2
6011.2
6059.8
6091.6
6088
6082.2
6108
6151.4
6187
6190
6152.2
6183.8
6222.8
6165.8
6223.4
6292.8
6320.6
6344
6391.2
6443.4
6504
6520.2
6518.8
6563.8
6614
6555.6
6601.8
6632.4
6657.8
6674.4
6687
6697.6
6732
6736.4
6745.8
6805.2
6850.4
6807.2
6844.6
6850.8
6848.2
6837.8
6857.6
6900.8
6940.8
6937.4
6950.4
6978.8
6997.8
6934.8
6946.8
6956.2
6968.2
NA
NA
NA
NA
NA
NA
NA
NA
NA
NA
NA
NA
NA
NA
NA
NA
NA
NA
NA
NA
NA
NA
NA
NA
NA
NA
NA
NA


Summary of computational transaction
Raw Input view raw input (R code)
Raw Outputview raw output of R engine
Computing time1 seconds
R ServerBig Analytics Cloud Computing Center

\begin{tabular}{lllllllll}
\hline
Summary of computational transaction \tabularnewline
Raw Input view raw input (R code)  \tabularnewline
Raw Outputview raw output of R engine  \tabularnewline
Computing time1 seconds \tabularnewline
R ServerBig Analytics Cloud Computing Center \tabularnewline
\hline
\end{tabular}
%Source: https://freestatistics.org/blog/index.php?pk=300842&T=0

[TABLE]
[ROW]
Summary of computational transaction[/C][/ROW] [ROW]Raw Input[/C] view raw input (R code) [/C][/ROW] [ROW]Raw Output[/C]view raw output of R engine [/C][/ROW] [ROW]Computing time[/C]1 seconds[/C][/ROW] [ROW]R Server[/C]Big Analytics Cloud Computing Center[/C][/ROW] [/TABLE] Source: https://freestatistics.org/blog/index.php?pk=300842&T=0

Globally Unique Identifier (entire table): ba.freestatistics.org/blog/index.php?pk=300842&T=0

As an alternative you can also use a QR Code:  

The GUIDs for individual cells are displayed in the table below:

Summary of computational transaction
Raw Input view raw input (R code)
Raw Outputview raw output of R engine
Computing time1 seconds
R ServerBig Analytics Cloud Computing Center


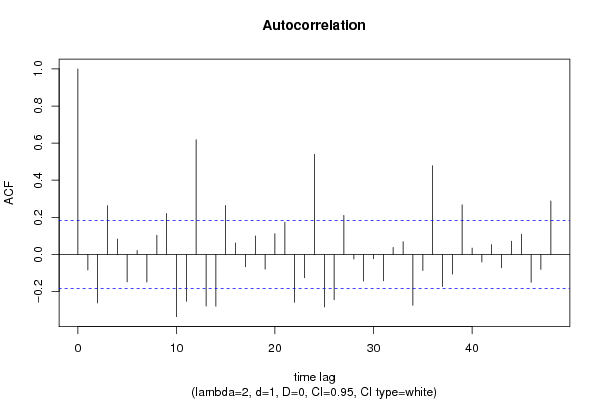
Autocorrelation Function
Time lag kACF(k)T-STATP-value
1-0.083764-0.89830.18546
2-0.261259-2.80170.002983
30.2630442.82080.002822
40.0825290.8850.188996
5-0.147866-1.58570.057778
60.0208140.22320.411884
7-0.149055-1.59840.056345
80.1037771.11290.13404
90.2208062.36790.00978
10-0.335471-3.59750.000237
11-0.252264-2.70520.003932
120.6183846.63140
13-0.278198-2.98330.001741
14-0.278889-2.99070.001703
150.2634312.8250.002788
160.06130.65740.256129
17-0.066761-0.71590.237741
180.0993181.06510.144538
19-0.079229-0.84960.198646
200.1113941.19460.117356
210.1732861.85830.032843
22-0.257569-2.76210.003344
23-0.125729-1.34830.090107
240.539495.78540
25-0.282772-3.03240.001499
26-0.244428-2.62120.004973
270.210432.25660.012961
28-0.0248-0.2660.395376
29-0.143601-1.540.06316
30-0.023628-0.25340.400211
31-0.141722-1.51980.065653
320.0371360.39820.345596
330.0681620.7310.233147
34-0.274322-2.94180.001974
35-0.086838-0.93120.176841
360.4782725.12891e-06
37-0.173002-1.85520.033062
38-0.105557-1.1320.130001
390.2674042.86760.002461
400.0340190.36480.357959
41-0.041002-0.43970.330492
420.0531130.56960.285038
43-0.071431-0.7660.222621
440.0712170.76370.223298
450.1088191.1670.122821
46-0.1498-1.60640.055462
47-0.080643-0.86480.194473
480.2878843.08720.001266

\begin{tabular}{lllllllll}
\hline
Autocorrelation Function \tabularnewline
Time lag k & ACF(k) & T-STAT & P-value \tabularnewline
1 & -0.083764 & -0.8983 & 0.18546 \tabularnewline
2 & -0.261259 & -2.8017 & 0.002983 \tabularnewline
3 & 0.263044 & 2.8208 & 0.002822 \tabularnewline
4 & 0.082529 & 0.885 & 0.188996 \tabularnewline
5 & -0.147866 & -1.5857 & 0.057778 \tabularnewline
6 & 0.020814 & 0.2232 & 0.411884 \tabularnewline
7 & -0.149055 & -1.5984 & 0.056345 \tabularnewline
8 & 0.103777 & 1.1129 & 0.13404 \tabularnewline
9 & 0.220806 & 2.3679 & 0.00978 \tabularnewline
10 & -0.335471 & -3.5975 & 0.000237 \tabularnewline
11 & -0.252264 & -2.7052 & 0.003932 \tabularnewline
12 & 0.618384 & 6.6314 & 0 \tabularnewline
13 & -0.278198 & -2.9833 & 0.001741 \tabularnewline
14 & -0.278889 & -2.9907 & 0.001703 \tabularnewline
15 & 0.263431 & 2.825 & 0.002788 \tabularnewline
16 & 0.0613 & 0.6574 & 0.256129 \tabularnewline
17 & -0.066761 & -0.7159 & 0.237741 \tabularnewline
18 & 0.099318 & 1.0651 & 0.144538 \tabularnewline
19 & -0.079229 & -0.8496 & 0.198646 \tabularnewline
20 & 0.111394 & 1.1946 & 0.117356 \tabularnewline
21 & 0.173286 & 1.8583 & 0.032843 \tabularnewline
22 & -0.257569 & -2.7621 & 0.003344 \tabularnewline
23 & -0.125729 & -1.3483 & 0.090107 \tabularnewline
24 & 0.53949 & 5.7854 & 0 \tabularnewline
25 & -0.282772 & -3.0324 & 0.001499 \tabularnewline
26 & -0.244428 & -2.6212 & 0.004973 \tabularnewline
27 & 0.21043 & 2.2566 & 0.012961 \tabularnewline
28 & -0.0248 & -0.266 & 0.395376 \tabularnewline
29 & -0.143601 & -1.54 & 0.06316 \tabularnewline
30 & -0.023628 & -0.2534 & 0.400211 \tabularnewline
31 & -0.141722 & -1.5198 & 0.065653 \tabularnewline
32 & 0.037136 & 0.3982 & 0.345596 \tabularnewline
33 & 0.068162 & 0.731 & 0.233147 \tabularnewline
34 & -0.274322 & -2.9418 & 0.001974 \tabularnewline
35 & -0.086838 & -0.9312 & 0.176841 \tabularnewline
36 & 0.478272 & 5.1289 & 1e-06 \tabularnewline
37 & -0.173002 & -1.8552 & 0.033062 \tabularnewline
38 & -0.105557 & -1.132 & 0.130001 \tabularnewline
39 & 0.267404 & 2.8676 & 0.002461 \tabularnewline
40 & 0.034019 & 0.3648 & 0.357959 \tabularnewline
41 & -0.041002 & -0.4397 & 0.330492 \tabularnewline
42 & 0.053113 & 0.5696 & 0.285038 \tabularnewline
43 & -0.071431 & -0.766 & 0.222621 \tabularnewline
44 & 0.071217 & 0.7637 & 0.223298 \tabularnewline
45 & 0.108819 & 1.167 & 0.122821 \tabularnewline
46 & -0.1498 & -1.6064 & 0.055462 \tabularnewline
47 & -0.080643 & -0.8648 & 0.194473 \tabularnewline
48 & 0.287884 & 3.0872 & 0.001266 \tabularnewline
\hline
\end{tabular}
%Source: https://freestatistics.org/blog/index.php?pk=300842&T=1

[TABLE]
[ROW][C]Autocorrelation Function[/C][/ROW]
[ROW][C]Time lag k[/C][C]ACF(k)[/C][C]T-STAT[/C][C]P-value[/C][/ROW]
[ROW][C]1[/C][C]-0.083764[/C][C]-0.8983[/C][C]0.18546[/C][/ROW]
[ROW][C]2[/C][C]-0.261259[/C][C]-2.8017[/C][C]0.002983[/C][/ROW]
[ROW][C]3[/C][C]0.263044[/C][C]2.8208[/C][C]0.002822[/C][/ROW]
[ROW][C]4[/C][C]0.082529[/C][C]0.885[/C][C]0.188996[/C][/ROW]
[ROW][C]5[/C][C]-0.147866[/C][C]-1.5857[/C][C]0.057778[/C][/ROW]
[ROW][C]6[/C][C]0.020814[/C][C]0.2232[/C][C]0.411884[/C][/ROW]
[ROW][C]7[/C][C]-0.149055[/C][C]-1.5984[/C][C]0.056345[/C][/ROW]
[ROW][C]8[/C][C]0.103777[/C][C]1.1129[/C][C]0.13404[/C][/ROW]
[ROW][C]9[/C][C]0.220806[/C][C]2.3679[/C][C]0.00978[/C][/ROW]
[ROW][C]10[/C][C]-0.335471[/C][C]-3.5975[/C][C]0.000237[/C][/ROW]
[ROW][C]11[/C][C]-0.252264[/C][C]-2.7052[/C][C]0.003932[/C][/ROW]
[ROW][C]12[/C][C]0.618384[/C][C]6.6314[/C][C]0[/C][/ROW]
[ROW][C]13[/C][C]-0.278198[/C][C]-2.9833[/C][C]0.001741[/C][/ROW]
[ROW][C]14[/C][C]-0.278889[/C][C]-2.9907[/C][C]0.001703[/C][/ROW]
[ROW][C]15[/C][C]0.263431[/C][C]2.825[/C][C]0.002788[/C][/ROW]
[ROW][C]16[/C][C]0.0613[/C][C]0.6574[/C][C]0.256129[/C][/ROW]
[ROW][C]17[/C][C]-0.066761[/C][C]-0.7159[/C][C]0.237741[/C][/ROW]
[ROW][C]18[/C][C]0.099318[/C][C]1.0651[/C][C]0.144538[/C][/ROW]
[ROW][C]19[/C][C]-0.079229[/C][C]-0.8496[/C][C]0.198646[/C][/ROW]
[ROW][C]20[/C][C]0.111394[/C][C]1.1946[/C][C]0.117356[/C][/ROW]
[ROW][C]21[/C][C]0.173286[/C][C]1.8583[/C][C]0.032843[/C][/ROW]
[ROW][C]22[/C][C]-0.257569[/C][C]-2.7621[/C][C]0.003344[/C][/ROW]
[ROW][C]23[/C][C]-0.125729[/C][C]-1.3483[/C][C]0.090107[/C][/ROW]
[ROW][C]24[/C][C]0.53949[/C][C]5.7854[/C][C]0[/C][/ROW]
[ROW][C]25[/C][C]-0.282772[/C][C]-3.0324[/C][C]0.001499[/C][/ROW]
[ROW][C]26[/C][C]-0.244428[/C][C]-2.6212[/C][C]0.004973[/C][/ROW]
[ROW][C]27[/C][C]0.21043[/C][C]2.2566[/C][C]0.012961[/C][/ROW]
[ROW][C]28[/C][C]-0.0248[/C][C]-0.266[/C][C]0.395376[/C][/ROW]
[ROW][C]29[/C][C]-0.143601[/C][C]-1.54[/C][C]0.06316[/C][/ROW]
[ROW][C]30[/C][C]-0.023628[/C][C]-0.2534[/C][C]0.400211[/C][/ROW]
[ROW][C]31[/C][C]-0.141722[/C][C]-1.5198[/C][C]0.065653[/C][/ROW]
[ROW][C]32[/C][C]0.037136[/C][C]0.3982[/C][C]0.345596[/C][/ROW]
[ROW][C]33[/C][C]0.068162[/C][C]0.731[/C][C]0.233147[/C][/ROW]
[ROW][C]34[/C][C]-0.274322[/C][C]-2.9418[/C][C]0.001974[/C][/ROW]
[ROW][C]35[/C][C]-0.086838[/C][C]-0.9312[/C][C]0.176841[/C][/ROW]
[ROW][C]36[/C][C]0.478272[/C][C]5.1289[/C][C]1e-06[/C][/ROW]
[ROW][C]37[/C][C]-0.173002[/C][C]-1.8552[/C][C]0.033062[/C][/ROW]
[ROW][C]38[/C][C]-0.105557[/C][C]-1.132[/C][C]0.130001[/C][/ROW]
[ROW][C]39[/C][C]0.267404[/C][C]2.8676[/C][C]0.002461[/C][/ROW]
[ROW][C]40[/C][C]0.034019[/C][C]0.3648[/C][C]0.357959[/C][/ROW]
[ROW][C]41[/C][C]-0.041002[/C][C]-0.4397[/C][C]0.330492[/C][/ROW]
[ROW][C]42[/C][C]0.053113[/C][C]0.5696[/C][C]0.285038[/C][/ROW]
[ROW][C]43[/C][C]-0.071431[/C][C]-0.766[/C][C]0.222621[/C][/ROW]
[ROW][C]44[/C][C]0.071217[/C][C]0.7637[/C][C]0.223298[/C][/ROW]
[ROW][C]45[/C][C]0.108819[/C][C]1.167[/C][C]0.122821[/C][/ROW]
[ROW][C]46[/C][C]-0.1498[/C][C]-1.6064[/C][C]0.055462[/C][/ROW]
[ROW][C]47[/C][C]-0.080643[/C][C]-0.8648[/C][C]0.194473[/C][/ROW]
[ROW][C]48[/C][C]0.287884[/C][C]3.0872[/C][C]0.001266[/C][/ROW]
[/TABLE]
Source: https://freestatistics.org/blog/index.php?pk=300842&T=1

Globally Unique Identifier (entire table): ba.freestatistics.org/blog/index.php?pk=300842&T=1

As an alternative you can also use a QR Code:  

The GUIDs for individual cells are displayed in the table below:

Autocorrelation Function
Time lag kACF(k)T-STATP-value
1-0.083764-0.89830.18546
2-0.261259-2.80170.002983
30.2630442.82080.002822
40.0825290.8850.188996
5-0.147866-1.58570.057778
60.0208140.22320.411884
7-0.149055-1.59840.056345
80.1037771.11290.13404
90.2208062.36790.00978
10-0.335471-3.59750.000237
11-0.252264-2.70520.003932
120.6183846.63140
13-0.278198-2.98330.001741
14-0.278889-2.99070.001703
150.2634312.8250.002788
160.06130.65740.256129
17-0.066761-0.71590.237741
180.0993181.06510.144538
19-0.079229-0.84960.198646
200.1113941.19460.117356
210.1732861.85830.032843
22-0.257569-2.76210.003344
23-0.125729-1.34830.090107
240.539495.78540
25-0.282772-3.03240.001499
26-0.244428-2.62120.004973
270.210432.25660.012961
28-0.0248-0.2660.395376
29-0.143601-1.540.06316
30-0.023628-0.25340.400211
31-0.141722-1.51980.065653
320.0371360.39820.345596
330.0681620.7310.233147
34-0.274322-2.94180.001974
35-0.086838-0.93120.176841
360.4782725.12891e-06
37-0.173002-1.85520.033062
38-0.105557-1.1320.130001
390.2674042.86760.002461
400.0340190.36480.357959
41-0.041002-0.43970.330492
420.0531130.56960.285038
43-0.071431-0.7660.222621
440.0712170.76370.223298
450.1088191.1670.122821
46-0.1498-1.60640.055462
47-0.080643-0.86480.194473
480.2878843.08720.001266


Partial Autocorrelation Function
Time lag kPACF(k)T-STATP-value
1-0.083764-0.89830.18546
2-0.270171-2.89730.002254
30.2309782.4770.007352
40.0565570.60650.272686
5-0.018969-0.20340.419585
6-0.018494-0.19830.421572
7-0.254441-2.72860.00368
80.1445011.54960.061992
90.195382.09520.019173
10-0.230794-2.4750.007391
11-0.300182-3.21910.000836
120.5039625.40440
13-0.415982-4.46091e-05
140.1444551.54910.062052
150.0022580.02420.490363
160.0105070.11270.455241
170.1074041.15180.1259
180.0179960.1930.423655
190.1296751.39060.083515
20-0.085068-0.91230.181772
21-0.057316-0.61460.270002
220.0814270.87320.192184
230.0756970.81180.209303
240.0082030.0880.465028
25-0.048496-0.52010.302011
26-0.082804-0.8880.188205
27-0.080795-0.86640.194028
280.0537020.57590.282908
29-0.088971-0.95410.171015
30-0.101437-1.08780.13948
31-0.070406-0.7550.225889
32-0.146231-1.56820.059796
33-0.012713-0.13630.445897
34-0.079246-0.84980.198595
350.0268480.28790.386967
360.0467840.50170.30842
370.1322481.41820.079418
380.0577620.61940.268428
390.0528290.56650.286069
400.0106720.11440.454541
410.0323510.34690.364641
420.0944241.01260.156692
43-0.053209-0.57060.28469
440.0380650.40820.341943
450.0507130.54380.293802
460.1387541.4880.069748
47-0.062972-0.67530.250421
48-0.037968-0.40720.342322

\begin{tabular}{lllllllll}
\hline
Partial Autocorrelation Function \tabularnewline
Time lag k & PACF(k) & T-STAT & P-value \tabularnewline
1 & -0.083764 & -0.8983 & 0.18546 \tabularnewline
2 & -0.270171 & -2.8973 & 0.002254 \tabularnewline
3 & 0.230978 & 2.477 & 0.007352 \tabularnewline
4 & 0.056557 & 0.6065 & 0.272686 \tabularnewline
5 & -0.018969 & -0.2034 & 0.419585 \tabularnewline
6 & -0.018494 & -0.1983 & 0.421572 \tabularnewline
7 & -0.254441 & -2.7286 & 0.00368 \tabularnewline
8 & 0.144501 & 1.5496 & 0.061992 \tabularnewline
9 & 0.19538 & 2.0952 & 0.019173 \tabularnewline
10 & -0.230794 & -2.475 & 0.007391 \tabularnewline
11 & -0.300182 & -3.2191 & 0.000836 \tabularnewline
12 & 0.503962 & 5.4044 & 0 \tabularnewline
13 & -0.415982 & -4.4609 & 1e-05 \tabularnewline
14 & 0.144455 & 1.5491 & 0.062052 \tabularnewline
15 & 0.002258 & 0.0242 & 0.490363 \tabularnewline
16 & 0.010507 & 0.1127 & 0.455241 \tabularnewline
17 & 0.107404 & 1.1518 & 0.1259 \tabularnewline
18 & 0.017996 & 0.193 & 0.423655 \tabularnewline
19 & 0.129675 & 1.3906 & 0.083515 \tabularnewline
20 & -0.085068 & -0.9123 & 0.181772 \tabularnewline
21 & -0.057316 & -0.6146 & 0.270002 \tabularnewline
22 & 0.081427 & 0.8732 & 0.192184 \tabularnewline
23 & 0.075697 & 0.8118 & 0.209303 \tabularnewline
24 & 0.008203 & 0.088 & 0.465028 \tabularnewline
25 & -0.048496 & -0.5201 & 0.302011 \tabularnewline
26 & -0.082804 & -0.888 & 0.188205 \tabularnewline
27 & -0.080795 & -0.8664 & 0.194028 \tabularnewline
28 & 0.053702 & 0.5759 & 0.282908 \tabularnewline
29 & -0.088971 & -0.9541 & 0.171015 \tabularnewline
30 & -0.101437 & -1.0878 & 0.13948 \tabularnewline
31 & -0.070406 & -0.755 & 0.225889 \tabularnewline
32 & -0.146231 & -1.5682 & 0.059796 \tabularnewline
33 & -0.012713 & -0.1363 & 0.445897 \tabularnewline
34 & -0.079246 & -0.8498 & 0.198595 \tabularnewline
35 & 0.026848 & 0.2879 & 0.386967 \tabularnewline
36 & 0.046784 & 0.5017 & 0.30842 \tabularnewline
37 & 0.132248 & 1.4182 & 0.079418 \tabularnewline
38 & 0.057762 & 0.6194 & 0.268428 \tabularnewline
39 & 0.052829 & 0.5665 & 0.286069 \tabularnewline
40 & 0.010672 & 0.1144 & 0.454541 \tabularnewline
41 & 0.032351 & 0.3469 & 0.364641 \tabularnewline
42 & 0.094424 & 1.0126 & 0.156692 \tabularnewline
43 & -0.053209 & -0.5706 & 0.28469 \tabularnewline
44 & 0.038065 & 0.4082 & 0.341943 \tabularnewline
45 & 0.050713 & 0.5438 & 0.293802 \tabularnewline
46 & 0.138754 & 1.488 & 0.069748 \tabularnewline
47 & -0.062972 & -0.6753 & 0.250421 \tabularnewline
48 & -0.037968 & -0.4072 & 0.342322 \tabularnewline
\hline
\end{tabular}
%Source: https://freestatistics.org/blog/index.php?pk=300842&T=2

[TABLE]
[ROW][C]Partial Autocorrelation Function[/C][/ROW]
[ROW][C]Time lag k[/C][C]PACF(k)[/C][C]T-STAT[/C][C]P-value[/C][/ROW]
[ROW][C]1[/C][C]-0.083764[/C][C]-0.8983[/C][C]0.18546[/C][/ROW]
[ROW][C]2[/C][C]-0.270171[/C][C]-2.8973[/C][C]0.002254[/C][/ROW]
[ROW][C]3[/C][C]0.230978[/C][C]2.477[/C][C]0.007352[/C][/ROW]
[ROW][C]4[/C][C]0.056557[/C][C]0.6065[/C][C]0.272686[/C][/ROW]
[ROW][C]5[/C][C]-0.018969[/C][C]-0.2034[/C][C]0.419585[/C][/ROW]
[ROW][C]6[/C][C]-0.018494[/C][C]-0.1983[/C][C]0.421572[/C][/ROW]
[ROW][C]7[/C][C]-0.254441[/C][C]-2.7286[/C][C]0.00368[/C][/ROW]
[ROW][C]8[/C][C]0.144501[/C][C]1.5496[/C][C]0.061992[/C][/ROW]
[ROW][C]9[/C][C]0.19538[/C][C]2.0952[/C][C]0.019173[/C][/ROW]
[ROW][C]10[/C][C]-0.230794[/C][C]-2.475[/C][C]0.007391[/C][/ROW]
[ROW][C]11[/C][C]-0.300182[/C][C]-3.2191[/C][C]0.000836[/C][/ROW]
[ROW][C]12[/C][C]0.503962[/C][C]5.4044[/C][C]0[/C][/ROW]
[ROW][C]13[/C][C]-0.415982[/C][C]-4.4609[/C][C]1e-05[/C][/ROW]
[ROW][C]14[/C][C]0.144455[/C][C]1.5491[/C][C]0.062052[/C][/ROW]
[ROW][C]15[/C][C]0.002258[/C][C]0.0242[/C][C]0.490363[/C][/ROW]
[ROW][C]16[/C][C]0.010507[/C][C]0.1127[/C][C]0.455241[/C][/ROW]
[ROW][C]17[/C][C]0.107404[/C][C]1.1518[/C][C]0.1259[/C][/ROW]
[ROW][C]18[/C][C]0.017996[/C][C]0.193[/C][C]0.423655[/C][/ROW]
[ROW][C]19[/C][C]0.129675[/C][C]1.3906[/C][C]0.083515[/C][/ROW]
[ROW][C]20[/C][C]-0.085068[/C][C]-0.9123[/C][C]0.181772[/C][/ROW]
[ROW][C]21[/C][C]-0.057316[/C][C]-0.6146[/C][C]0.270002[/C][/ROW]
[ROW][C]22[/C][C]0.081427[/C][C]0.8732[/C][C]0.192184[/C][/ROW]
[ROW][C]23[/C][C]0.075697[/C][C]0.8118[/C][C]0.209303[/C][/ROW]
[ROW][C]24[/C][C]0.008203[/C][C]0.088[/C][C]0.465028[/C][/ROW]
[ROW][C]25[/C][C]-0.048496[/C][C]-0.5201[/C][C]0.302011[/C][/ROW]
[ROW][C]26[/C][C]-0.082804[/C][C]-0.888[/C][C]0.188205[/C][/ROW]
[ROW][C]27[/C][C]-0.080795[/C][C]-0.8664[/C][C]0.194028[/C][/ROW]
[ROW][C]28[/C][C]0.053702[/C][C]0.5759[/C][C]0.282908[/C][/ROW]
[ROW][C]29[/C][C]-0.088971[/C][C]-0.9541[/C][C]0.171015[/C][/ROW]
[ROW][C]30[/C][C]-0.101437[/C][C]-1.0878[/C][C]0.13948[/C][/ROW]
[ROW][C]31[/C][C]-0.070406[/C][C]-0.755[/C][C]0.225889[/C][/ROW]
[ROW][C]32[/C][C]-0.146231[/C][C]-1.5682[/C][C]0.059796[/C][/ROW]
[ROW][C]33[/C][C]-0.012713[/C][C]-0.1363[/C][C]0.445897[/C][/ROW]
[ROW][C]34[/C][C]-0.079246[/C][C]-0.8498[/C][C]0.198595[/C][/ROW]
[ROW][C]35[/C][C]0.026848[/C][C]0.2879[/C][C]0.386967[/C][/ROW]
[ROW][C]36[/C][C]0.046784[/C][C]0.5017[/C][C]0.30842[/C][/ROW]
[ROW][C]37[/C][C]0.132248[/C][C]1.4182[/C][C]0.079418[/C][/ROW]
[ROW][C]38[/C][C]0.057762[/C][C]0.6194[/C][C]0.268428[/C][/ROW]
[ROW][C]39[/C][C]0.052829[/C][C]0.5665[/C][C]0.286069[/C][/ROW]
[ROW][C]40[/C][C]0.010672[/C][C]0.1144[/C][C]0.454541[/C][/ROW]
[ROW][C]41[/C][C]0.032351[/C][C]0.3469[/C][C]0.364641[/C][/ROW]
[ROW][C]42[/C][C]0.094424[/C][C]1.0126[/C][C]0.156692[/C][/ROW]
[ROW][C]43[/C][C]-0.053209[/C][C]-0.5706[/C][C]0.28469[/C][/ROW]
[ROW][C]44[/C][C]0.038065[/C][C]0.4082[/C][C]0.341943[/C][/ROW]
[ROW][C]45[/C][C]0.050713[/C][C]0.5438[/C][C]0.293802[/C][/ROW]
[ROW][C]46[/C][C]0.138754[/C][C]1.488[/C][C]0.069748[/C][/ROW]
[ROW][C]47[/C][C]-0.062972[/C][C]-0.6753[/C][C]0.250421[/C][/ROW]
[ROW][C]48[/C][C]-0.037968[/C][C]-0.4072[/C][C]0.342322[/C][/ROW]
[/TABLE]
Source: https://freestatistics.org/blog/index.php?pk=300842&T=2

Globally Unique Identifier (entire table): ba.freestatistics.org/blog/index.php?pk=300842&T=2

As an alternative you can also use a QR Code:  

The GUIDs for individual cells are displayed in the table below:

Partial Autocorrelation Function
Time lag kPACF(k)T-STATP-value
1-0.083764-0.89830.18546
2-0.270171-2.89730.002254
30.2309782.4770.007352
40.0565570.60650.272686
5-0.018969-0.20340.419585
6-0.018494-0.19830.421572
7-0.254441-2.72860.00368
80.1445011.54960.061992
90.195382.09520.019173
10-0.230794-2.4750.007391
11-0.300182-3.21910.000836
120.5039625.40440
13-0.415982-4.46091e-05
140.1444551.54910.062052
150.0022580.02420.490363
160.0105070.11270.455241
170.1074041.15180.1259
180.0179960.1930.423655
190.1296751.39060.083515
20-0.085068-0.91230.181772
21-0.057316-0.61460.270002
220.0814270.87320.192184
230.0756970.81180.209303
240.0082030.0880.465028
25-0.048496-0.52010.302011
26-0.082804-0.8880.188205
27-0.080795-0.86640.194028
280.0537020.57590.282908
29-0.088971-0.95410.171015
30-0.101437-1.08780.13948
31-0.070406-0.7550.225889
32-0.146231-1.56820.059796
33-0.012713-0.13630.445897
34-0.079246-0.84980.198595
350.0268480.28790.386967
360.0467840.50170.30842
370.1322481.41820.079418
380.0577620.61940.268428
390.0528290.56650.286069
400.0106720.11440.454541
410.0323510.34690.364641
420.0944241.01260.156692
43-0.053209-0.57060.28469
440.0380650.40820.341943
450.0507130.54380.293802
460.1387541.4880.069748
47-0.062972-0.67530.250421
48-0.037968-0.40720.342322


Parameters (Session):
par1 = 48 ; par2 = 2.0 ; par3 = 1 ; par4 = 0 ; par5 = 12 ; par6 = White Noise ; par7 = 0.95 ;
Parameters (R input):
par1 = 48 ; par2 = 2.0 ; par3 = 1 ; par4 = 0 ; par5 = 12 ; par6 = White Noise ; par7 = 0.95 ; par8 = ;
R code (references can be found in the software module):
if (par1 == 'Default') {
par1 = 10*log10(length(x))
} else {
par1 <- as.numeric(par1)
}
par2 <- as.numeric(par2)
par3 <- as.numeric(par3)
par4 <- as.numeric(par4)
par5 <- as.numeric(par5)
if (par6 == 'White Noise') par6 <- 'white' else par6 <- 'ma'
par7 <- as.numeric(par7)
if (par8 != '') par8 <- as.numeric(par8)
x <- na.omit(x)
ox <- x
if (par8 == '') {
if (par2 == 0) {
x <- log(x)
} else {
x <- (x ^ par2 - 1) / par2
}
} else {
x <- log(x,base=par8)
}
if (par3 > 0) x <- diff(x,lag=1,difference=par3)
if (par4 > 0) x <- diff(x,lag=par5,difference=par4)
bitmap(file='picts.png')
op <- par(mfrow=c(2,1))
plot(ox,type='l',main='Original Time Series',xlab='time',ylab='value')
if (par8=='') {
mytitle <- paste('Working Time Series (lambda=',par2,', d=',par3,', D=',par4,')',sep='')
mysub <- paste('(lambda=',par2,', d=',par3,', D=',par4,', CI=', par7, ', CI type=',par6,')',sep='')
} else {
mytitle <- paste('Working Time Series (base=',par8,', d=',par3,', D=',par4,')',sep='')
mysub <- paste('(base=',par8,', d=',par3,', D=',par4,', CI=', par7, ', CI type=',par6,')',sep='')
}
plot(x,type='l', main=mytitle,xlab='time',ylab='value')
par(op)
dev.off()
bitmap(file='pic1.png')
racf <- acf(x, par1, main='Autocorrelation', xlab='time lag', ylab='ACF', ci.type=par6, ci=par7, sub=mysub)
dev.off()
bitmap(file='pic2.png')
rpacf <- pacf(x,par1,main='Partial Autocorrelation',xlab='lags',ylab='PACF',sub=mysub)
dev.off()
(myacf <- c(racf$acf))
(mypacf <- c(rpacf$acf))
lengthx <- length(x)
sqrtn <- sqrt(lengthx)
load(file='createtable')
a<-table.start()
a<-table.row.start(a)
a<-table.element(a,'Autocorrelation Function',4,TRUE)
a<-table.row.end(a)
a<-table.row.start(a)
a<-table.element(a,'Time lag k',header=TRUE)
a<-table.element(a,'ACF(k)',header=TRUE)
a<-table.element(a,'T-STAT',header=TRUE)
a<-table.element(a,'P-value',header=TRUE)
a<-table.row.end(a)
for (i in 2:(par1+1)) {
a<-table.row.start(a)
a<-table.element(a,i-1,header=TRUE)
a<-table.element(a,round(myacf[i],6))
mytstat <- myacf[i]*sqrtn
a<-table.element(a,round(mytstat,4))
a<-table.element(a,round(1-pt(abs(mytstat),lengthx),6))
a<-table.row.end(a)
}
a<-table.end(a)
table.save(a,file='mytable.tab')
a<-table.start()
a<-table.row.start(a)
a<-table.element(a,'Partial Autocorrelation Function',4,TRUE)
a<-table.row.end(a)
a<-table.row.start(a)
a<-table.element(a,'Time lag k',header=TRUE)
a<-table.element(a,'PACF(k)',header=TRUE)
a<-table.element(a,'T-STAT',header=TRUE)
a<-table.element(a,'P-value',header=TRUE)
a<-table.row.end(a)
for (i in 1:par1) {
a<-table.row.start(a)
a<-table.element(a,i,header=TRUE)
a<-table.element(a,round(mypacf[i],6))
mytstat <- mypacf[i]*sqrtn
a<-table.element(a,round(mytstat,4))
a<-table.element(a,round(1-pt(abs(mytstat),lengthx),6))
a<-table.row.end(a)
}
a<-table.end(a)
table.save(a,file='mytable1.tab')