Free Statistics

of Irreproducible Research!

Author's title

Author*The author of this computation has been verified*
R Software Modulerwasp_autocorrelation.wasp
Title produced by software(Partial) Autocorrelation Function
Date of computationSat, 17 Dec 2016 19:10:09 +0100
Cite this page as followsStatistical Computations at FreeStatistics.org, Office for Research Development and Education, URL https://freestatistics.org/blog/index.php?v=date/2016/Dec/17/t1481998230h1os509tvjhk5em.htm/, Retrieved Thu, 02 May 2024 10:06:48 +0000
Statistical Computations at FreeStatistics.org, Office for Research Development and Education, URL https://freestatistics.org/blog/index.php?pk=300903, Retrieved Thu, 02 May 2024 10:06:48 +0000
QR Codes:

Original text written by user:
IsPrivate?No (this computation is public)
User-defined keywords
Estimated Impact76
Family? (F = Feedback message, R = changed R code, M = changed R Module, P = changed Parameters, D = changed Data)
-       [(Partial) Autocorrelation Function] [Autocorrelation F...] [2016-12-17 18:10:09] [e6dc02234f5305f92311fb16bc25f73e] [Current]
Feedback Forum

Post a new message
Dataseries X:
13663
11635
9606
8784.5
9415.5
10418
11344.5
11271
11895
12152.5
12731
12951
10692
8563.5
6217
5562
6294.5
7422
9254.5
10607
11268
12041
12962.5
12200.5
10400.5
8765
7000
6677
7318
7999
8762
9696
10373
10682.5
10935.5
10815.5
8669
7079.5
5640
5238.5
5777.5
6479
7290
7343
7810.5
8171.5
8532
8719
7281.5
5923.5
4837
4675.5
4585.5
5083
5766
6201
6778
7393.5
7849.5
8282.5
7610
6192.5
4693.5
4869
5149
5648.5
6230.5
7032
7727
8087.5
8443
9002
7717.5
6374.5
4995.5
4655
5198
5501
6119.5
6922
7390
7466.5
7773
7865
6567
5132.5
3656.5
3623
4045.5
4617
5374
6022.5
6464.5
7058
7484.5
7955
6801
5499
4179.5
4305.5
3304
5773.5
6419.5
6938
7760
8224
8381
8667
7304.5
5565.5
4023
3932.5
4508.5
5491
6284


Summary of computational transaction
Raw Input view raw input (R code)
Raw Outputview raw output of R engine
Computing time1 seconds
R ServerBig Analytics Cloud Computing Center

\begin{tabular}{lllllllll}
\hline
Summary of computational transaction \tabularnewline
Raw Input view raw input (R code)  \tabularnewline
Raw Outputview raw output of R engine  \tabularnewline
Computing time1 seconds \tabularnewline
R ServerBig Analytics Cloud Computing Center \tabularnewline
\hline
\end{tabular}
%Source: https://freestatistics.org/blog/index.php?pk=300903&T=0

[TABLE]
[ROW]
Summary of computational transaction[/C][/ROW] [ROW]Raw Input[/C] view raw input (R code) [/C][/ROW] [ROW]Raw Output[/C]view raw output of R engine [/C][/ROW] [ROW]Computing time[/C]1 seconds[/C][/ROW] [ROW]R Server[/C]Big Analytics Cloud Computing Center[/C][/ROW] [/TABLE] Source: https://freestatistics.org/blog/index.php?pk=300903&T=0

Globally Unique Identifier (entire table): ba.freestatistics.org/blog/index.php?pk=300903&T=0

As an alternative you can also use a QR Code:  

The GUIDs for individual cells are displayed in the table below:

Summary of computational transaction
Raw Input view raw input (R code)
Raw Outputview raw output of R engine
Computing time1 seconds
R ServerBig Analytics Cloud Computing Center


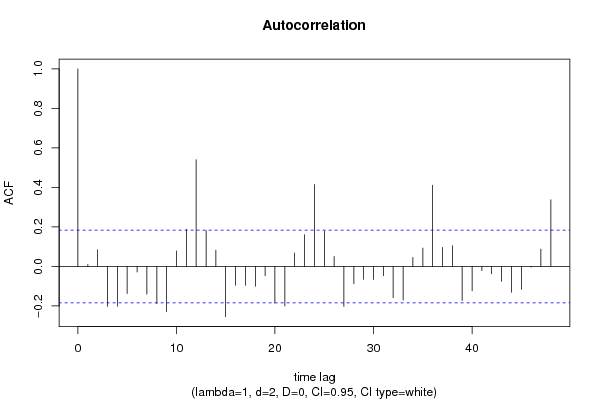
Autocorrelation Function
Time lag kACF(k)T-STATP-value
10.0103390.10990.456341
20.0847610.9010.184746
3-0.202069-2.1480.016924
4-0.201033-2.1370.017377
5-0.137217-1.45860.073719
6-0.028343-0.30130.381875
7-0.139933-1.48750.069833
8-0.187988-1.99830.02404
9-0.229152-2.43590.008208
100.0780090.82920.204356
110.1886832.00570.023637
120.5403575.74410
130.1813761.92810.028179
140.0821070.87280.19231
15-0.254124-2.70140.003985
16-0.095585-1.01610.155881
17-0.094887-1.00870.157647
18-0.100458-1.06790.143925
19-0.047025-0.49990.309065
20-0.185071-1.96730.025798
21-0.200085-2.12690.017801
220.0674460.7170.23744
230.1607181.70850.045149
240.4148934.41041.2e-05
250.1798911.91230.029187
260.0503840.53560.296648
27-0.202173-2.14910.016879
28-0.087812-0.93350.176288
29-0.064865-0.68950.245952
30-0.065936-0.70090.2424
31-0.046766-0.49710.310031
32-0.158494-1.68480.047392
33-0.169869-1.80570.036811
340.0457880.48670.313695
350.0927770.98620.163064
360.4116554.3761.4e-05
370.0962341.0230.154252
380.105271.1190.132749
39-0.172191-1.83040.034912
40-0.122724-1.30460.097345
41-0.021319-0.22660.410563
42-0.036756-0.39070.348369
43-0.075212-0.79950.212835
44-0.130715-1.38950.083703
45-0.115085-1.22340.111867
46-0.002706-0.02880.48855
470.0879050.93440.176035
480.3371233.58370.000251

\begin{tabular}{lllllllll}
\hline
Autocorrelation Function \tabularnewline
Time lag k & ACF(k) & T-STAT & P-value \tabularnewline
1 & 0.010339 & 0.1099 & 0.456341 \tabularnewline
2 & 0.084761 & 0.901 & 0.184746 \tabularnewline
3 & -0.202069 & -2.148 & 0.016924 \tabularnewline
4 & -0.201033 & -2.137 & 0.017377 \tabularnewline
5 & -0.137217 & -1.4586 & 0.073719 \tabularnewline
6 & -0.028343 & -0.3013 & 0.381875 \tabularnewline
7 & -0.139933 & -1.4875 & 0.069833 \tabularnewline
8 & -0.187988 & -1.9983 & 0.02404 \tabularnewline
9 & -0.229152 & -2.4359 & 0.008208 \tabularnewline
10 & 0.078009 & 0.8292 & 0.204356 \tabularnewline
11 & 0.188683 & 2.0057 & 0.023637 \tabularnewline
12 & 0.540357 & 5.7441 & 0 \tabularnewline
13 & 0.181376 & 1.9281 & 0.028179 \tabularnewline
14 & 0.082107 & 0.8728 & 0.19231 \tabularnewline
15 & -0.254124 & -2.7014 & 0.003985 \tabularnewline
16 & -0.095585 & -1.0161 & 0.155881 \tabularnewline
17 & -0.094887 & -1.0087 & 0.157647 \tabularnewline
18 & -0.100458 & -1.0679 & 0.143925 \tabularnewline
19 & -0.047025 & -0.4999 & 0.309065 \tabularnewline
20 & -0.185071 & -1.9673 & 0.025798 \tabularnewline
21 & -0.200085 & -2.1269 & 0.017801 \tabularnewline
22 & 0.067446 & 0.717 & 0.23744 \tabularnewline
23 & 0.160718 & 1.7085 & 0.045149 \tabularnewline
24 & 0.414893 & 4.4104 & 1.2e-05 \tabularnewline
25 & 0.179891 & 1.9123 & 0.029187 \tabularnewline
26 & 0.050384 & 0.5356 & 0.296648 \tabularnewline
27 & -0.202173 & -2.1491 & 0.016879 \tabularnewline
28 & -0.087812 & -0.9335 & 0.176288 \tabularnewline
29 & -0.064865 & -0.6895 & 0.245952 \tabularnewline
30 & -0.065936 & -0.7009 & 0.2424 \tabularnewline
31 & -0.046766 & -0.4971 & 0.310031 \tabularnewline
32 & -0.158494 & -1.6848 & 0.047392 \tabularnewline
33 & -0.169869 & -1.8057 & 0.036811 \tabularnewline
34 & 0.045788 & 0.4867 & 0.313695 \tabularnewline
35 & 0.092777 & 0.9862 & 0.163064 \tabularnewline
36 & 0.411655 & 4.376 & 1.4e-05 \tabularnewline
37 & 0.096234 & 1.023 & 0.154252 \tabularnewline
38 & 0.10527 & 1.119 & 0.132749 \tabularnewline
39 & -0.172191 & -1.8304 & 0.034912 \tabularnewline
40 & -0.122724 & -1.3046 & 0.097345 \tabularnewline
41 & -0.021319 & -0.2266 & 0.410563 \tabularnewline
42 & -0.036756 & -0.3907 & 0.348369 \tabularnewline
43 & -0.075212 & -0.7995 & 0.212835 \tabularnewline
44 & -0.130715 & -1.3895 & 0.083703 \tabularnewline
45 & -0.115085 & -1.2234 & 0.111867 \tabularnewline
46 & -0.002706 & -0.0288 & 0.48855 \tabularnewline
47 & 0.087905 & 0.9344 & 0.176035 \tabularnewline
48 & 0.337123 & 3.5837 & 0.000251 \tabularnewline
\hline
\end{tabular}
%Source: https://freestatistics.org/blog/index.php?pk=300903&T=1

[TABLE]
[ROW][C]Autocorrelation Function[/C][/ROW]
[ROW][C]Time lag k[/C][C]ACF(k)[/C][C]T-STAT[/C][C]P-value[/C][/ROW]
[ROW][C]1[/C][C]0.010339[/C][C]0.1099[/C][C]0.456341[/C][/ROW]
[ROW][C]2[/C][C]0.084761[/C][C]0.901[/C][C]0.184746[/C][/ROW]
[ROW][C]3[/C][C]-0.202069[/C][C]-2.148[/C][C]0.016924[/C][/ROW]
[ROW][C]4[/C][C]-0.201033[/C][C]-2.137[/C][C]0.017377[/C][/ROW]
[ROW][C]5[/C][C]-0.137217[/C][C]-1.4586[/C][C]0.073719[/C][/ROW]
[ROW][C]6[/C][C]-0.028343[/C][C]-0.3013[/C][C]0.381875[/C][/ROW]
[ROW][C]7[/C][C]-0.139933[/C][C]-1.4875[/C][C]0.069833[/C][/ROW]
[ROW][C]8[/C][C]-0.187988[/C][C]-1.9983[/C][C]0.02404[/C][/ROW]
[ROW][C]9[/C][C]-0.229152[/C][C]-2.4359[/C][C]0.008208[/C][/ROW]
[ROW][C]10[/C][C]0.078009[/C][C]0.8292[/C][C]0.204356[/C][/ROW]
[ROW][C]11[/C][C]0.188683[/C][C]2.0057[/C][C]0.023637[/C][/ROW]
[ROW][C]12[/C][C]0.540357[/C][C]5.7441[/C][C]0[/C][/ROW]
[ROW][C]13[/C][C]0.181376[/C][C]1.9281[/C][C]0.028179[/C][/ROW]
[ROW][C]14[/C][C]0.082107[/C][C]0.8728[/C][C]0.19231[/C][/ROW]
[ROW][C]15[/C][C]-0.254124[/C][C]-2.7014[/C][C]0.003985[/C][/ROW]
[ROW][C]16[/C][C]-0.095585[/C][C]-1.0161[/C][C]0.155881[/C][/ROW]
[ROW][C]17[/C][C]-0.094887[/C][C]-1.0087[/C][C]0.157647[/C][/ROW]
[ROW][C]18[/C][C]-0.100458[/C][C]-1.0679[/C][C]0.143925[/C][/ROW]
[ROW][C]19[/C][C]-0.047025[/C][C]-0.4999[/C][C]0.309065[/C][/ROW]
[ROW][C]20[/C][C]-0.185071[/C][C]-1.9673[/C][C]0.025798[/C][/ROW]
[ROW][C]21[/C][C]-0.200085[/C][C]-2.1269[/C][C]0.017801[/C][/ROW]
[ROW][C]22[/C][C]0.067446[/C][C]0.717[/C][C]0.23744[/C][/ROW]
[ROW][C]23[/C][C]0.160718[/C][C]1.7085[/C][C]0.045149[/C][/ROW]
[ROW][C]24[/C][C]0.414893[/C][C]4.4104[/C][C]1.2e-05[/C][/ROW]
[ROW][C]25[/C][C]0.179891[/C][C]1.9123[/C][C]0.029187[/C][/ROW]
[ROW][C]26[/C][C]0.050384[/C][C]0.5356[/C][C]0.296648[/C][/ROW]
[ROW][C]27[/C][C]-0.202173[/C][C]-2.1491[/C][C]0.016879[/C][/ROW]
[ROW][C]28[/C][C]-0.087812[/C][C]-0.9335[/C][C]0.176288[/C][/ROW]
[ROW][C]29[/C][C]-0.064865[/C][C]-0.6895[/C][C]0.245952[/C][/ROW]
[ROW][C]30[/C][C]-0.065936[/C][C]-0.7009[/C][C]0.2424[/C][/ROW]
[ROW][C]31[/C][C]-0.046766[/C][C]-0.4971[/C][C]0.310031[/C][/ROW]
[ROW][C]32[/C][C]-0.158494[/C][C]-1.6848[/C][C]0.047392[/C][/ROW]
[ROW][C]33[/C][C]-0.169869[/C][C]-1.8057[/C][C]0.036811[/C][/ROW]
[ROW][C]34[/C][C]0.045788[/C][C]0.4867[/C][C]0.313695[/C][/ROW]
[ROW][C]35[/C][C]0.092777[/C][C]0.9862[/C][C]0.163064[/C][/ROW]
[ROW][C]36[/C][C]0.411655[/C][C]4.376[/C][C]1.4e-05[/C][/ROW]
[ROW][C]37[/C][C]0.096234[/C][C]1.023[/C][C]0.154252[/C][/ROW]
[ROW][C]38[/C][C]0.10527[/C][C]1.119[/C][C]0.132749[/C][/ROW]
[ROW][C]39[/C][C]-0.172191[/C][C]-1.8304[/C][C]0.034912[/C][/ROW]
[ROW][C]40[/C][C]-0.122724[/C][C]-1.3046[/C][C]0.097345[/C][/ROW]
[ROW][C]41[/C][C]-0.021319[/C][C]-0.2266[/C][C]0.410563[/C][/ROW]
[ROW][C]42[/C][C]-0.036756[/C][C]-0.3907[/C][C]0.348369[/C][/ROW]
[ROW][C]43[/C][C]-0.075212[/C][C]-0.7995[/C][C]0.212835[/C][/ROW]
[ROW][C]44[/C][C]-0.130715[/C][C]-1.3895[/C][C]0.083703[/C][/ROW]
[ROW][C]45[/C][C]-0.115085[/C][C]-1.2234[/C][C]0.111867[/C][/ROW]
[ROW][C]46[/C][C]-0.002706[/C][C]-0.0288[/C][C]0.48855[/C][/ROW]
[ROW][C]47[/C][C]0.087905[/C][C]0.9344[/C][C]0.176035[/C][/ROW]
[ROW][C]48[/C][C]0.337123[/C][C]3.5837[/C][C]0.000251[/C][/ROW]
[/TABLE]
Source: https://freestatistics.org/blog/index.php?pk=300903&T=1

Globally Unique Identifier (entire table): ba.freestatistics.org/blog/index.php?pk=300903&T=1

As an alternative you can also use a QR Code:  

The GUIDs for individual cells are displayed in the table below:

Autocorrelation Function
Time lag kACF(k)T-STATP-value
10.0103390.10990.456341
20.0847610.9010.184746
3-0.202069-2.1480.016924
4-0.201033-2.1370.017377
5-0.137217-1.45860.073719
6-0.028343-0.30130.381875
7-0.139933-1.48750.069833
8-0.187988-1.99830.02404
9-0.229152-2.43590.008208
100.0780090.82920.204356
110.1886832.00570.023637
120.5403575.74410
130.1813761.92810.028179
140.0821070.87280.19231
15-0.254124-2.70140.003985
16-0.095585-1.01610.155881
17-0.094887-1.00870.157647
18-0.100458-1.06790.143925
19-0.047025-0.49990.309065
20-0.185071-1.96730.025798
21-0.200085-2.12690.017801
220.0674460.7170.23744
230.1607181.70850.045149
240.4148934.41041.2e-05
250.1798911.91230.029187
260.0503840.53560.296648
27-0.202173-2.14910.016879
28-0.087812-0.93350.176288
29-0.064865-0.68950.245952
30-0.065936-0.70090.2424
31-0.046766-0.49710.310031
32-0.158494-1.68480.047392
33-0.169869-1.80570.036811
340.0457880.48670.313695
350.0927770.98620.163064
360.4116554.3761.4e-05
370.0962341.0230.154252
380.105271.1190.132749
39-0.172191-1.83040.034912
40-0.122724-1.30460.097345
41-0.021319-0.22660.410563
42-0.036756-0.39070.348369
43-0.075212-0.79950.212835
44-0.130715-1.38950.083703
45-0.115085-1.22340.111867
46-0.002706-0.02880.48855
470.0879050.93440.176035
480.3371233.58370.000251


Partial Autocorrelation Function
Time lag kPACF(k)T-STATP-value
10.0103390.10990.456341
20.0846640.90.185021
3-0.205239-2.18170.0156
4-0.211196-2.2450.013356
5-0.110336-1.17290.121653
6-0.040043-0.42570.335581
7-0.226301-2.40560.008884
8-0.342408-3.63980.000206
9-0.429297-4.56356e-06
10-0.220897-2.34820.010302
11-0.154975-1.64740.051126
120.276312.93720.002007
130.1434231.52460.065076
140.1001911.0650.144562
15-0.140077-1.4890.069631
16-0.001186-0.01260.494983
170.0657920.69940.242877
18-0.092793-0.98640.163023
190.0582020.61870.26868
200.0612030.65060.258315
210.0034230.03640.485517
220.0121360.1290.448791
23-0.068025-0.72310.235551
240.0320080.34020.367152
250.0218890.23270.408214
26-0.001044-0.01110.495584
27-0.071828-0.76350.223364
28-0.005512-0.05860.476688
290.0377890.40170.344331
30-0.036261-0.38550.350309
310.0075860.08060.467936
320.0033910.03610.485653
33-0.049129-0.52220.30126
340.0228060.24240.404443
35-0.134866-1.43360.077218
360.0704830.74920.227634
37-0.022007-0.23390.407728
380.0691550.73510.231893
390.0096480.10260.459248
40-0.071276-0.75770.225113
410.0192320.20440.419191
42-0.002282-0.02430.490345
43-0.027657-0.2940.38465
44-0.054751-0.5820.280861
450.0465030.49430.311014
460.0374950.39860.345477
47-0.057578-0.61210.270861
48-0.008434-0.08970.464362

\begin{tabular}{lllllllll}
\hline
Partial Autocorrelation Function \tabularnewline
Time lag k & PACF(k) & T-STAT & P-value \tabularnewline
1 & 0.010339 & 0.1099 & 0.456341 \tabularnewline
2 & 0.084664 & 0.9 & 0.185021 \tabularnewline
3 & -0.205239 & -2.1817 & 0.0156 \tabularnewline
4 & -0.211196 & -2.245 & 0.013356 \tabularnewline
5 & -0.110336 & -1.1729 & 0.121653 \tabularnewline
6 & -0.040043 & -0.4257 & 0.335581 \tabularnewline
7 & -0.226301 & -2.4056 & 0.008884 \tabularnewline
8 & -0.342408 & -3.6398 & 0.000206 \tabularnewline
9 & -0.429297 & -4.5635 & 6e-06 \tabularnewline
10 & -0.220897 & -2.3482 & 0.010302 \tabularnewline
11 & -0.154975 & -1.6474 & 0.051126 \tabularnewline
12 & 0.27631 & 2.9372 & 0.002007 \tabularnewline
13 & 0.143423 & 1.5246 & 0.065076 \tabularnewline
14 & 0.100191 & 1.065 & 0.144562 \tabularnewline
15 & -0.140077 & -1.489 & 0.069631 \tabularnewline
16 & -0.001186 & -0.0126 & 0.494983 \tabularnewline
17 & 0.065792 & 0.6994 & 0.242877 \tabularnewline
18 & -0.092793 & -0.9864 & 0.163023 \tabularnewline
19 & 0.058202 & 0.6187 & 0.26868 \tabularnewline
20 & 0.061203 & 0.6506 & 0.258315 \tabularnewline
21 & 0.003423 & 0.0364 & 0.485517 \tabularnewline
22 & 0.012136 & 0.129 & 0.448791 \tabularnewline
23 & -0.068025 & -0.7231 & 0.235551 \tabularnewline
24 & 0.032008 & 0.3402 & 0.367152 \tabularnewline
25 & 0.021889 & 0.2327 & 0.408214 \tabularnewline
26 & -0.001044 & -0.0111 & 0.495584 \tabularnewline
27 & -0.071828 & -0.7635 & 0.223364 \tabularnewline
28 & -0.005512 & -0.0586 & 0.476688 \tabularnewline
29 & 0.037789 & 0.4017 & 0.344331 \tabularnewline
30 & -0.036261 & -0.3855 & 0.350309 \tabularnewline
31 & 0.007586 & 0.0806 & 0.467936 \tabularnewline
32 & 0.003391 & 0.0361 & 0.485653 \tabularnewline
33 & -0.049129 & -0.5222 & 0.30126 \tabularnewline
34 & 0.022806 & 0.2424 & 0.404443 \tabularnewline
35 & -0.134866 & -1.4336 & 0.077218 \tabularnewline
36 & 0.070483 & 0.7492 & 0.227634 \tabularnewline
37 & -0.022007 & -0.2339 & 0.407728 \tabularnewline
38 & 0.069155 & 0.7351 & 0.231893 \tabularnewline
39 & 0.009648 & 0.1026 & 0.459248 \tabularnewline
40 & -0.071276 & -0.7577 & 0.225113 \tabularnewline
41 & 0.019232 & 0.2044 & 0.419191 \tabularnewline
42 & -0.002282 & -0.0243 & 0.490345 \tabularnewline
43 & -0.027657 & -0.294 & 0.38465 \tabularnewline
44 & -0.054751 & -0.582 & 0.280861 \tabularnewline
45 & 0.046503 & 0.4943 & 0.311014 \tabularnewline
46 & 0.037495 & 0.3986 & 0.345477 \tabularnewline
47 & -0.057578 & -0.6121 & 0.270861 \tabularnewline
48 & -0.008434 & -0.0897 & 0.464362 \tabularnewline
\hline
\end{tabular}
%Source: https://freestatistics.org/blog/index.php?pk=300903&T=2

[TABLE]
[ROW][C]Partial Autocorrelation Function[/C][/ROW]
[ROW][C]Time lag k[/C][C]PACF(k)[/C][C]T-STAT[/C][C]P-value[/C][/ROW]
[ROW][C]1[/C][C]0.010339[/C][C]0.1099[/C][C]0.456341[/C][/ROW]
[ROW][C]2[/C][C]0.084664[/C][C]0.9[/C][C]0.185021[/C][/ROW]
[ROW][C]3[/C][C]-0.205239[/C][C]-2.1817[/C][C]0.0156[/C][/ROW]
[ROW][C]4[/C][C]-0.211196[/C][C]-2.245[/C][C]0.013356[/C][/ROW]
[ROW][C]5[/C][C]-0.110336[/C][C]-1.1729[/C][C]0.121653[/C][/ROW]
[ROW][C]6[/C][C]-0.040043[/C][C]-0.4257[/C][C]0.335581[/C][/ROW]
[ROW][C]7[/C][C]-0.226301[/C][C]-2.4056[/C][C]0.008884[/C][/ROW]
[ROW][C]8[/C][C]-0.342408[/C][C]-3.6398[/C][C]0.000206[/C][/ROW]
[ROW][C]9[/C][C]-0.429297[/C][C]-4.5635[/C][C]6e-06[/C][/ROW]
[ROW][C]10[/C][C]-0.220897[/C][C]-2.3482[/C][C]0.010302[/C][/ROW]
[ROW][C]11[/C][C]-0.154975[/C][C]-1.6474[/C][C]0.051126[/C][/ROW]
[ROW][C]12[/C][C]0.27631[/C][C]2.9372[/C][C]0.002007[/C][/ROW]
[ROW][C]13[/C][C]0.143423[/C][C]1.5246[/C][C]0.065076[/C][/ROW]
[ROW][C]14[/C][C]0.100191[/C][C]1.065[/C][C]0.144562[/C][/ROW]
[ROW][C]15[/C][C]-0.140077[/C][C]-1.489[/C][C]0.069631[/C][/ROW]
[ROW][C]16[/C][C]-0.001186[/C][C]-0.0126[/C][C]0.494983[/C][/ROW]
[ROW][C]17[/C][C]0.065792[/C][C]0.6994[/C][C]0.242877[/C][/ROW]
[ROW][C]18[/C][C]-0.092793[/C][C]-0.9864[/C][C]0.163023[/C][/ROW]
[ROW][C]19[/C][C]0.058202[/C][C]0.6187[/C][C]0.26868[/C][/ROW]
[ROW][C]20[/C][C]0.061203[/C][C]0.6506[/C][C]0.258315[/C][/ROW]
[ROW][C]21[/C][C]0.003423[/C][C]0.0364[/C][C]0.485517[/C][/ROW]
[ROW][C]22[/C][C]0.012136[/C][C]0.129[/C][C]0.448791[/C][/ROW]
[ROW][C]23[/C][C]-0.068025[/C][C]-0.7231[/C][C]0.235551[/C][/ROW]
[ROW][C]24[/C][C]0.032008[/C][C]0.3402[/C][C]0.367152[/C][/ROW]
[ROW][C]25[/C][C]0.021889[/C][C]0.2327[/C][C]0.408214[/C][/ROW]
[ROW][C]26[/C][C]-0.001044[/C][C]-0.0111[/C][C]0.495584[/C][/ROW]
[ROW][C]27[/C][C]-0.071828[/C][C]-0.7635[/C][C]0.223364[/C][/ROW]
[ROW][C]28[/C][C]-0.005512[/C][C]-0.0586[/C][C]0.476688[/C][/ROW]
[ROW][C]29[/C][C]0.037789[/C][C]0.4017[/C][C]0.344331[/C][/ROW]
[ROW][C]30[/C][C]-0.036261[/C][C]-0.3855[/C][C]0.350309[/C][/ROW]
[ROW][C]31[/C][C]0.007586[/C][C]0.0806[/C][C]0.467936[/C][/ROW]
[ROW][C]32[/C][C]0.003391[/C][C]0.0361[/C][C]0.485653[/C][/ROW]
[ROW][C]33[/C][C]-0.049129[/C][C]-0.5222[/C][C]0.30126[/C][/ROW]
[ROW][C]34[/C][C]0.022806[/C][C]0.2424[/C][C]0.404443[/C][/ROW]
[ROW][C]35[/C][C]-0.134866[/C][C]-1.4336[/C][C]0.077218[/C][/ROW]
[ROW][C]36[/C][C]0.070483[/C][C]0.7492[/C][C]0.227634[/C][/ROW]
[ROW][C]37[/C][C]-0.022007[/C][C]-0.2339[/C][C]0.407728[/C][/ROW]
[ROW][C]38[/C][C]0.069155[/C][C]0.7351[/C][C]0.231893[/C][/ROW]
[ROW][C]39[/C][C]0.009648[/C][C]0.1026[/C][C]0.459248[/C][/ROW]
[ROW][C]40[/C][C]-0.071276[/C][C]-0.7577[/C][C]0.225113[/C][/ROW]
[ROW][C]41[/C][C]0.019232[/C][C]0.2044[/C][C]0.419191[/C][/ROW]
[ROW][C]42[/C][C]-0.002282[/C][C]-0.0243[/C][C]0.490345[/C][/ROW]
[ROW][C]43[/C][C]-0.027657[/C][C]-0.294[/C][C]0.38465[/C][/ROW]
[ROW][C]44[/C][C]-0.054751[/C][C]-0.582[/C][C]0.280861[/C][/ROW]
[ROW][C]45[/C][C]0.046503[/C][C]0.4943[/C][C]0.311014[/C][/ROW]
[ROW][C]46[/C][C]0.037495[/C][C]0.3986[/C][C]0.345477[/C][/ROW]
[ROW][C]47[/C][C]-0.057578[/C][C]-0.6121[/C][C]0.270861[/C][/ROW]
[ROW][C]48[/C][C]-0.008434[/C][C]-0.0897[/C][C]0.464362[/C][/ROW]
[/TABLE]
Source: https://freestatistics.org/blog/index.php?pk=300903&T=2

Globally Unique Identifier (entire table): ba.freestatistics.org/blog/index.php?pk=300903&T=2

As an alternative you can also use a QR Code:  

The GUIDs for individual cells are displayed in the table below:

Partial Autocorrelation Function
Time lag kPACF(k)T-STATP-value
10.0103390.10990.456341
20.0846640.90.185021
3-0.205239-2.18170.0156
4-0.211196-2.2450.013356
5-0.110336-1.17290.121653
6-0.040043-0.42570.335581
7-0.226301-2.40560.008884
8-0.342408-3.63980.000206
9-0.429297-4.56356e-06
10-0.220897-2.34820.010302
11-0.154975-1.64740.051126
120.276312.93720.002007
130.1434231.52460.065076
140.1001911.0650.144562
15-0.140077-1.4890.069631
16-0.001186-0.01260.494983
170.0657920.69940.242877
18-0.092793-0.98640.163023
190.0582020.61870.26868
200.0612030.65060.258315
210.0034230.03640.485517
220.0121360.1290.448791
23-0.068025-0.72310.235551
240.0320080.34020.367152
250.0218890.23270.408214
26-0.001044-0.01110.495584
27-0.071828-0.76350.223364
28-0.005512-0.05860.476688
290.0377890.40170.344331
30-0.036261-0.38550.350309
310.0075860.08060.467936
320.0033910.03610.485653
33-0.049129-0.52220.30126
340.0228060.24240.404443
35-0.134866-1.43360.077218
360.0704830.74920.227634
37-0.022007-0.23390.407728
380.0691550.73510.231893
390.0096480.10260.459248
40-0.071276-0.75770.225113
410.0192320.20440.419191
42-0.002282-0.02430.490345
43-0.027657-0.2940.38465
44-0.054751-0.5820.280861
450.0465030.49430.311014
460.0374950.39860.345477
47-0.057578-0.61210.270861
48-0.008434-0.08970.464362


Parameters (Session):
par1 = 48 ; par2 = 1 ; par3 = 1 ; par4 = 0 ; par5 = 12 ; par6 = White Noise ; par7 = 0.95 ;
Parameters (R input):
par1 = 48 ; par2 = 1 ; par3 = 2 ; par4 = 0 ; par5 = 12 ; par6 = White Noise ; par7 = 0.95 ; par8 = ;
R code (references can be found in the software module):
par8 <- ''
par7 <- '0.95'
par6 <- 'White Noise'
par5 <- '12'
par4 <- '0'
par3 <- '1'
par2 <- '1'
par1 <- '48'
if (par1 == 'Default') {
par1 = 10*log10(length(x))
} else {
par1 <- as.numeric(par1)
}
par2 <- as.numeric(par2)
par3 <- as.numeric(par3)
par4 <- as.numeric(par4)
par5 <- as.numeric(par5)
if (par6 == 'White Noise') par6 <- 'white' else par6 <- 'ma'
par7 <- as.numeric(par7)
if (par8 != '') par8 <- as.numeric(par8)
x <- na.omit(x)
ox <- x
if (par8 == '') {
if (par2 == 0) {
x <- log(x)
} else {
x <- (x ^ par2 - 1) / par2
}
} else {
x <- log(x,base=par8)
}
if (par3 > 0) x <- diff(x,lag=1,difference=par3)
if (par4 > 0) x <- diff(x,lag=par5,difference=par4)
bitmap(file='picts.png')
op <- par(mfrow=c(2,1))
plot(ox,type='l',main='Original Time Series',xlab='time',ylab='value')
if (par8=='') {
mytitle <- paste('Working Time Series (lambda=',par2,', d=',par3,', D=',par4,')',sep='')
mysub <- paste('(lambda=',par2,', d=',par3,', D=',par4,', CI=', par7, ', CI type=',par6,')',sep='')
} else {
mytitle <- paste('Working Time Series (base=',par8,', d=',par3,', D=',par4,')',sep='')
mysub <- paste('(base=',par8,', d=',par3,', D=',par4,', CI=', par7, ', CI type=',par6,')',sep='')
}
plot(x,type='l', main=mytitle,xlab='time',ylab='value')
par(op)
dev.off()
bitmap(file='pic1.png')
racf <- acf(x, par1, main='Autocorrelation', xlab='time lag', ylab='ACF', ci.type=par6, ci=par7, sub=mysub)
dev.off()
bitmap(file='pic2.png')
rpacf <- pacf(x,par1,main='Partial Autocorrelation',xlab='lags',ylab='PACF',sub=mysub)
dev.off()
(myacf <- c(racf$acf))
(mypacf <- c(rpacf$acf))
lengthx <- length(x)
sqrtn <- sqrt(lengthx)
load(file='createtable')
a<-table.start()
a<-table.row.start(a)
a<-table.element(a,'Autocorrelation Function',4,TRUE)
a<-table.row.end(a)
a<-table.row.start(a)
a<-table.element(a,'Time lag k',header=TRUE)
a<-table.element(a,'ACF(k)',header=TRUE)
a<-table.element(a,'T-STAT',header=TRUE)
a<-table.element(a,'P-value',header=TRUE)
a<-table.row.end(a)
for (i in 2:(par1+1)) {
a<-table.row.start(a)
a<-table.element(a,i-1,header=TRUE)
a<-table.element(a,round(myacf[i],6))
mytstat <- myacf[i]*sqrtn
a<-table.element(a,round(mytstat,4))
a<-table.element(a,round(1-pt(abs(mytstat),lengthx),6))
a<-table.row.end(a)
}
a<-table.end(a)
table.save(a,file='mytable.tab')
a<-table.start()
a<-table.row.start(a)
a<-table.element(a,'Partial Autocorrelation Function',4,TRUE)
a<-table.row.end(a)
a<-table.row.start(a)
a<-table.element(a,'Time lag k',header=TRUE)
a<-table.element(a,'PACF(k)',header=TRUE)
a<-table.element(a,'T-STAT',header=TRUE)
a<-table.element(a,'P-value',header=TRUE)
a<-table.row.end(a)
for (i in 1:par1) {
a<-table.row.start(a)
a<-table.element(a,i,header=TRUE)
a<-table.element(a,round(mypacf[i],6))
mytstat <- mypacf[i]*sqrtn
a<-table.element(a,round(mytstat,4))
a<-table.element(a,round(1-pt(abs(mytstat),lengthx),6))
a<-table.row.end(a)
}
a<-table.end(a)
table.save(a,file='mytable1.tab')